You can view job execution lists to check how jobs are executed in the current day. The job execution lists include the job instance list and workflow instance list.
View job execution lists
In SchedulerX Basic Edition, you can view only 10 job instance execution records. In SchedulerX Professional Edition, you can view 100 job instance execution records.
Log on to the SchedulerX console.
In the top navigation bar, select a region.
In the left-side navigation pane, click Execution List.
Select a namespace from the Namespace to which the namespace belongs drop-down list on the Execution List page and click the Task instance List or Process instance List tab.
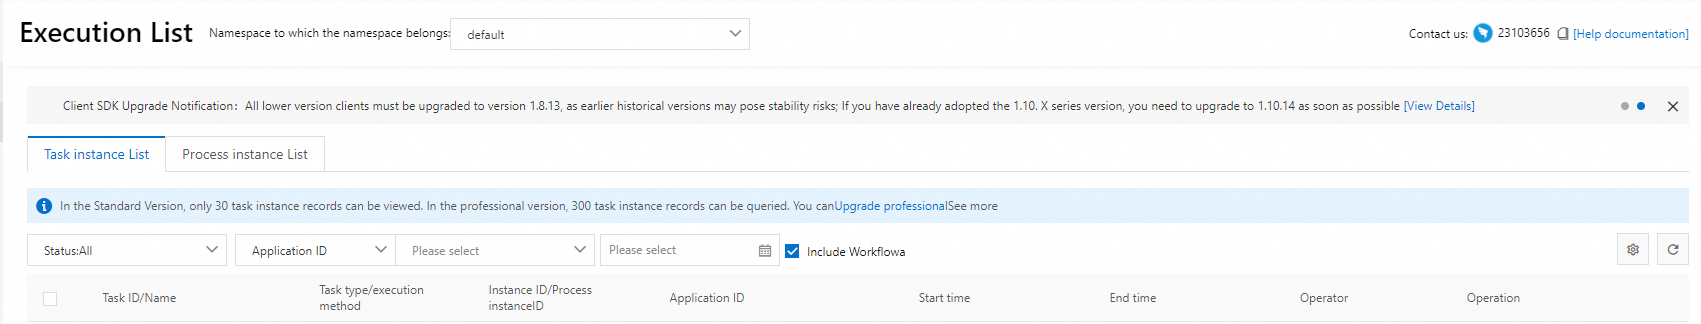
By default, SchedulerX displays all execution records.
You can filter or search execution records based on your business requirements.
You can filter execution records by selecting Status:All, Success, Failure, Run, Pool, or Wait.
You can filter execution records by Application ID, Task ID., and Instance ID.
You can also filter execution records by Minute, hour, day, week, month, and User-Defined.
View job instance details
On the Task instance List tab of the Execution List page, find the job instance that you want to view and click Details in the Operation column.
You can view Basic Information, Current Execution Details, Tasks, Operational Log, and Sharding Details on different tabs of the Job Instance Details page.
The execution details vary based on how the job is executed.
Standalone: displays Basic Information and Operational Log.
Broadcast: displays Basic Information and Current Execution Details.
Parallel Computing: displays Basic Information, Current Execution Details, and Tasks.
Memory Grid: displays Basic Information and Current Execution Details.
Grid Computing: displays Basic Information and Current Execution Details.
Sharding: displays Basic Information and Sharding Details.
On the Tasks tab, you can perform different operations on tasks that are in different states.
Wait: You can mark pending tasks as completed.
Failure: You can rerun failed tasks or mark failed tasks as completed.
Run: You can terminate running tasks.
Success: You cannot perform operations on completed tasks.
View workflow instance details
On the Process instance List tab of the Execution List page, find the workflow instance that you want to view and click the ID of the workflow instance in the Operation column.
On the Canvas page, you can view detailed information about the workflow instance.
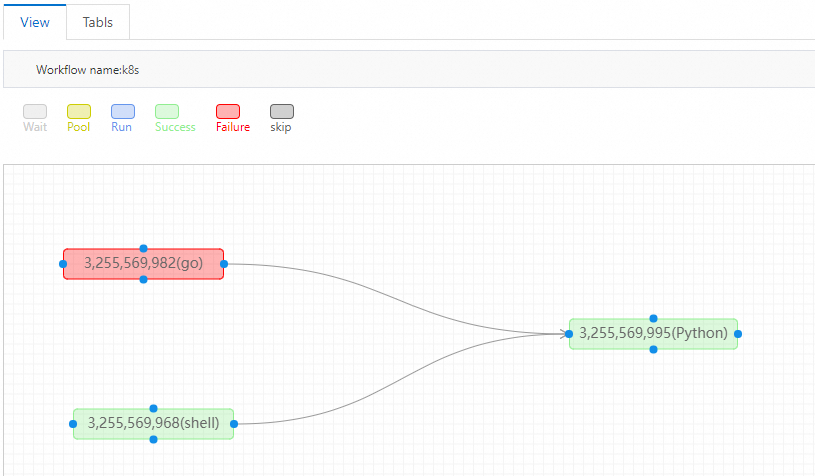
Jobs in different states are displayed in different colors. For example, jobs in red are failed jobs and jobs in gray are pending jobs. If a job fails, all jobs that depend on the failed job change to the pending state.
You can right-click a failed job and select Details from the short-cut menu to view the cause of failure.
After you modify the failed job, right-click the job and select Rerun from the short-cut menu to rerun the job.
Only if the job is complete, the system can run the downstream jobs.
If you no longer need the job, select Mark as Completed from the shortcut menu to mark the job as completed. This way, the system can run the downstream jobs without the need to complete the job first.