Latency insights is a CloudDBA feature that tracks execution time across all Redis commands and up to 27 internal events in a Tair (Redis OSS-compatible) instance. Statistics are accurate to the microsecond and retained for three days, making it useful for both real-time diagnosis and retrospective analysis of latency spikes.
How it works
Redis 2.8.13 introduced built-in latency monitoring. It covers a limited set of events, retains data for only 160 seconds, and stores just one record per second (the highest-latency event).
Latency insights extends this with:
Persistence — data is stored for three days and latency spikes are traceable across that window
High precision — full events are monitored within milliseconds
Low overhead — implemented asynchronously with minimal impact on instance performance
Real-time queries — data is available for immediate query and aggregation
Multiple analysis dimensions — slice data by event type, time range, or latency value
Only commands and events that exceed a defined threshold are recorded. Thresholds vary by event type (30 ms, 50 ms, or 100 ms). See Appendix: Common special events for the full list.
Prerequisites
Before you begin, ensure that:
The instance minor version meets the minimum requirement for your edition: For instructions on updating a minor version, see Update the minor version of an instance.
Edition Minimum minor version Notes Tair (Enterprise Edition) memory-optimized 1.6.9 For Tair module command statistics, use 1.7.28 or later Redis Open-Source Edition 5.0 5.1.4 Redis Open-Source Edition 6.0 0.1.15 Redis Open-Source Edition 7.0 7.0.0.6
Billing
Latency insights is free of charge.
View latency statistics
Log on to the console and go to the Instances page. In the top navigation bar, select the region where your instance is deployed. Find the instance and click its ID.
In the left navigation pane, click CloudDBA > Latency Insights.
On the Latency Insights page, select a time range and click Search. The default view shows statistics from the last 5 minutes. Queries can span up to three days of data, but a single query cannot cover more than one hour. For cluster and read/write splitting instances, use the Data Node and Proxy Node tabs to view statistics separately by node type.
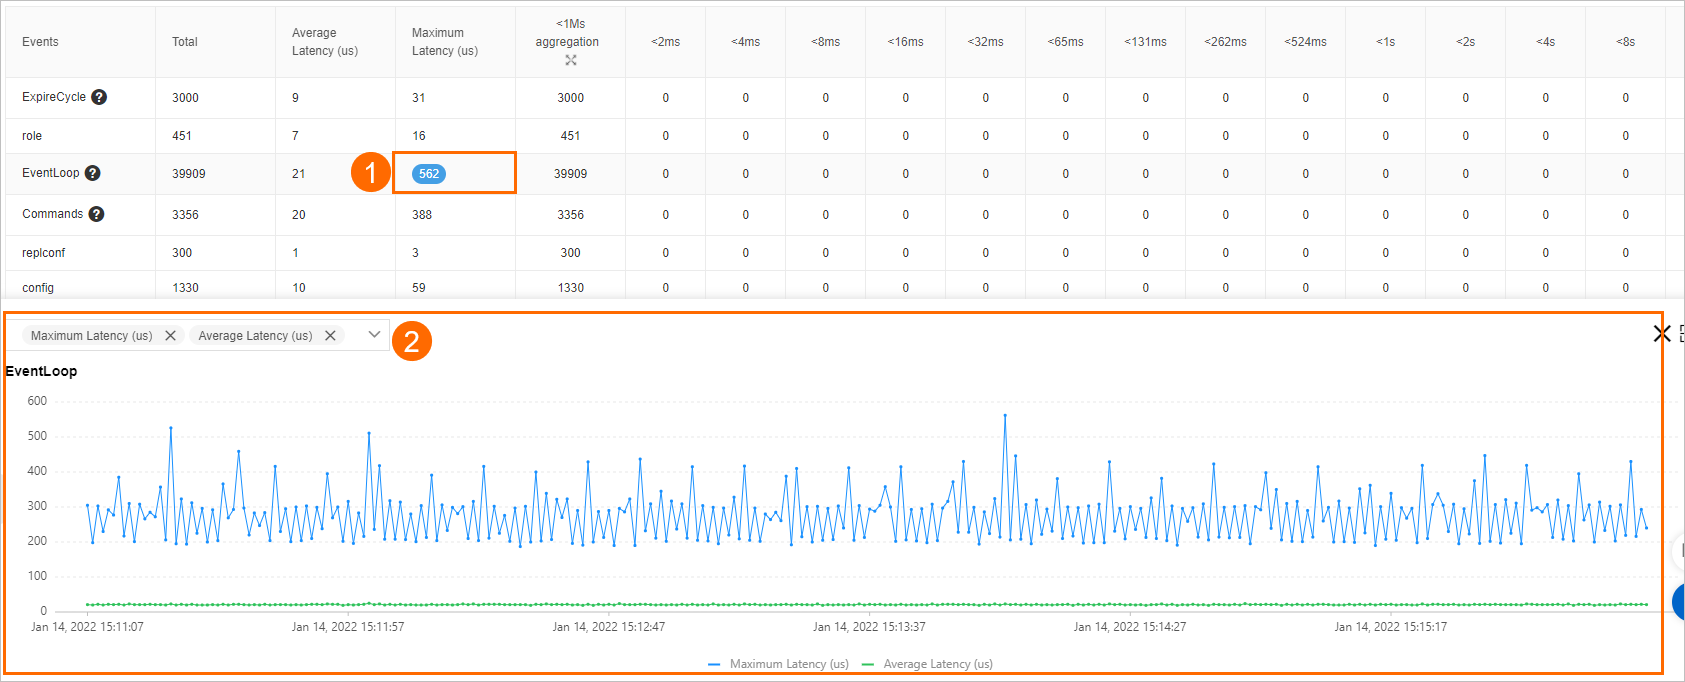
Click an event name or a count in the list to open its latency trend chart. In the chart, select additional metrics to overlay their trends.
Only commands and events that exceed their configured threshold are recorded. If you see high-latency events, see Suggestions for handling common latency events for remediation guidance.
Metrics reference
The Latency Insights table displays the following columns:
| Metric | Description |
|---|---|
| Event | The event name. Examples: ExpireCycle, EventLoop, Ping, Scan, Commands, Info. See Appendix: Common special events. |
| Total | Total number of recorded occurrences. |
| Average Latency (us) | Mean latency across all recorded occurrences, in microseconds. |
| Maximum Latency (us) | Highest latency observed, in microseconds. |
| Aggregated count (< 1 ms) | Count of events with latency below 1 ms. Click the |
| \<2 ms, \<4 ms, ..., >33s | Count of events in each latency range. |
Counting rules: Each range is exclusive at the lower bound and inclusive at the upper bound. For example, \<2 us counts events with latency between 1 us and 2 us. \<2 ms counts events with latency between 1 ms and 2 ms. >33s counts events with latency above 33 seconds.
What's next
Suggestions for handling common latency events — remediation steps for each event type
Update the minor version of an instance — update the instance to meet version requirements
Appendix: Common special events
Events are grouped by the Redis subsystem they relate to. The threshold column shows the minimum latency that triggers recording.
Memory eviction
| Event | Threshold | Description |
|---|---|---|
| EvictionDel | 30 ms | Time to delete evicted keys in one eviction cycle. |
| EvictionLazyFree | 30 ms | Time for background threads to release memory in one eviction cycle. |
| EvictionCycle | 30 ms | Total time for one eviction cycle, including key selection, deletion, and waiting for background threads. |
Memory defragmentation
| Event | Threshold | Description |
|---|---|---|
| ActiveDefragCycle | 100 ms | Time to run one memory defragmentation cycle. |
Rehash
| Event | Threshold | Description |
|---|---|---|
| Rehash | 100 ms | Time to complete a hash table rehash. |
Data structure upgrade
| Event | Threshold | Description |
|---|---|---|
| ZipListConvertHash | 30 ms | Time to convert a ziplist to a dictionary using hash encoding. |
| IntsetConvertSet | 30 ms | Time to convert an intset to a set using set encoding. |
| ZipListConvertZset | 30 ms | Time to convert a ziplist to a skiplist using ziplist encoding. |
Append-only file (AOF)
| Event | Threshold | Description |
|---|---|---|
| AofWriteAlone | 30 ms | Time to write an AOF under normal conditions. |
| AofWrite | 30 ms | Total time to write an AOF. Each successful AOF write records this event alongside exactly one of: AofWriteAlone, AofWriteActiveChild, or AofWritePendingFsync. |
| AofFstat | 30 ms | Time to retrieve AOF file metadata. |
| AofRename | 30 ms | Time to rename an AOF file. |
| AofReWriteDiffWrite | 30 ms | Time for the parent process to write incremental AOF data after a child process completes an AOF rewrite. |
| AofWriteActiveChild | 30 ms | Time to write AOF data to disk when another child process is also writing. |
| AofWritePendingFsync | 30 ms | Time to write AOF data when a background process is running fsync. |
RDB file
| Event | Threshold | Description |
|---|---|---|
| RdbUnlinkTempFile | 50 ms | Time to delete a temporary RDB file after the bgsave child process exits. |
Other events
| Event | Threshold | Description |
|---|---|---|
| Commands | 30 ms | Time to run a command not tagged as fast. |
| FastCommand | 30 ms | Time to run a fast-tagged command with O(1) or O(log N) complexity. For the list of fast commands, see the FastCommands section. |
| EventLoop | 50 ms | Time to complete one main event loop iteration. |
| Fork | 100 ms | Time to call fork(). |
| Transaction | 50 ms | Execution time of a transaction. |
| PipeLine | 50 ms | Time consumed by a multi-threaded pipeline. |
| ExpireCycle | 30 ms | Time to scan and clear expired keys in one cycle. |
| ExpireDel | 30 ms | Time to delete expired keys within one expiry cycle. |
| SlotRdbsUnlinkTempFile | 30 ms | Time to delete a slot's temporary RDB file after the bgsave child process exits. |
| LoadSlotRdb | 100 ms | Time to load an RDB file from a slot. |
| SlotreplTargetcron | 50 ms | Time to load a slot's RDB file into a temporary database and migrate it to the destination database using a child process. |