This document shows benchmark results for IVFFlat indexes on ApsaraDB RDS for PostgreSQL. Use these results to understand how data volume affects storage, and how the lists and probes parameters trade off query throughput against recall rate before you tune them for your workload.
How IVFFlat indexes work
IVFFlat divides vectors into clusters during index construction. At query time, the database searches only a subset of clusters rather than all vectors.
| Parameter | Role | Effect of a higher value |
|---|---|---|
lists | Number of clusters built during index creation | Faster queries (fewer vectors per cluster), but lower recall when query vectors land near cluster boundaries |
probes | Number of clusters searched at query time | Higher recall, but slower queries |
The two parameters have opposite effects on recall and throughput.
Test environment
The RDS instance and ECS instance must be in the same virtual private cloud (VPC) and vSwitch to avoid network-related variance in test results.
| Component | Specification |
|---|---|
| RDS instance | PostgreSQL 16, RDS High-availability Edition, pg.x8.2xlarge.2c dedicated instance (16 cores, 128 GB memory) |
| pgvector version | 0.8.0 |
| ECS instance | ecs.c6.xlarge (4 cores, 8 GiB memory), Alibaba Cloud Linux 3 |
| PostgreSQL client | 15.1 |
| Test tool | pgbench |
Prerequisites
Before you begin, ensure that you have:
A privileged account named
testuserand a database namedtestdb. See Create a database and an accountThe pgvector extension installed in
testdb. The extension is namedvectorin the system. See Manage extensionsA connection to the RDS instance. See Connect to an ApsaraDB RDS for PostgreSQL instance
Set up test data
Connect to
testdband create a helper function that generates random vectors of a given length:CREATE OR REPLACE FUNCTION random_array(dim integer) RETURNS DOUBLE PRECISION[] AS $$ SELECT array_agg(random()) FROM generate_series(1, dim); $$ LANGUAGE SQL VOLATILE COST 1;Create a table for 1536-dimensional vectors:
CREATE TABLE vtest(id BIGINT, v VECTOR(1536));Insert 100,000 rows of test data:
INSERT INTO vtest
SELECT i, random_array(1536)::VECTOR(1536)
FROM generate_series(1, 100000) AS i;
Create an IVFFlat index using cosine distance with 100 lists:
CREATE INDEX ON vtest USING ivfflat(v vector_cosine_ops) WITH(lists = 100);
Run the benchmark
Use the internal endpoint of the RDS instance to eliminate network latency as a variable.
Create a SQL file named
test.sqlwith the following query. The query generates a random 1536-dimensional vector and retrieves the most similar records fromvtestusing cosine distance:WITH tmp AS ( SELECT random_array(1536)::VECTOR(1536) AS vec ) SELECT id FROM vtest ORDER BY v <=> (SELECT vec FROM tmp) LIMIT FLOOR(RANDOM() * 50);Run pgbench from the ECS instance. Make sure the PostgreSQL client is installed. See the pgbench documentation for reference.
pgbench -f ./test.sql -c6 -T60 -P5 -U testuser -h pgm-bp****.pg.rds.aliyuncs.com -p 5432 -d testdbParameter Description -f ./test.sqlPath to the test SQL file. Replace with the actual path -c6Number of concurrent client connections (6 in this test) -T60Test duration in seconds (60 seconds in this test) -P5Progress report interval in seconds (every 5 seconds) -U testuserDatabase username. Replace with your username -h pgm-bp****.pg.rds.aliyuncs.comInternal endpoint of the RDS instance -p 5432Internal port of the RDS instance -d testdbTarget database
Test results
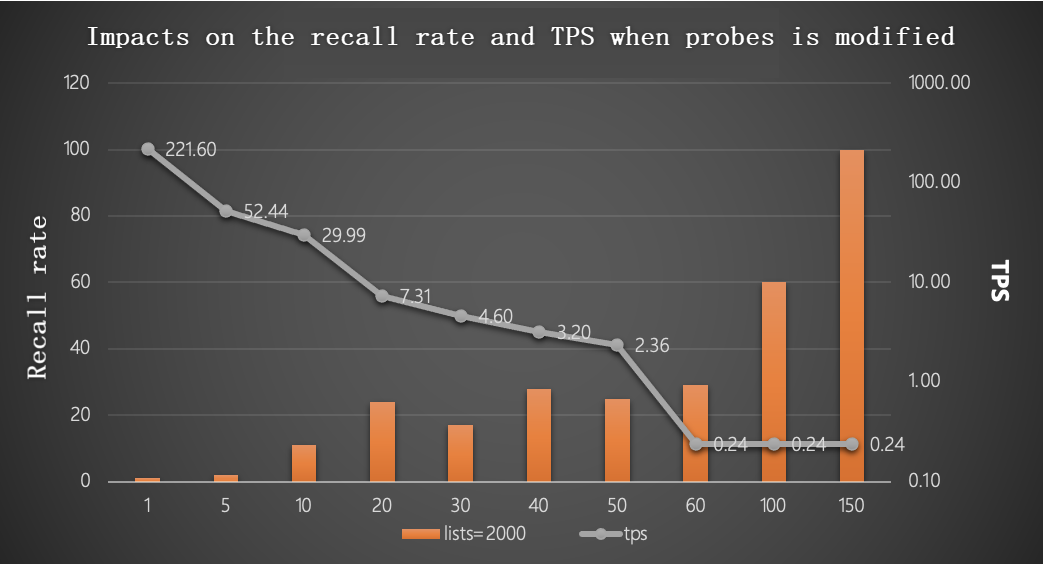
With lists = 2000 and 1,000,000 rows: a higher probes value indicates a higher recall rate but a lower TPS.
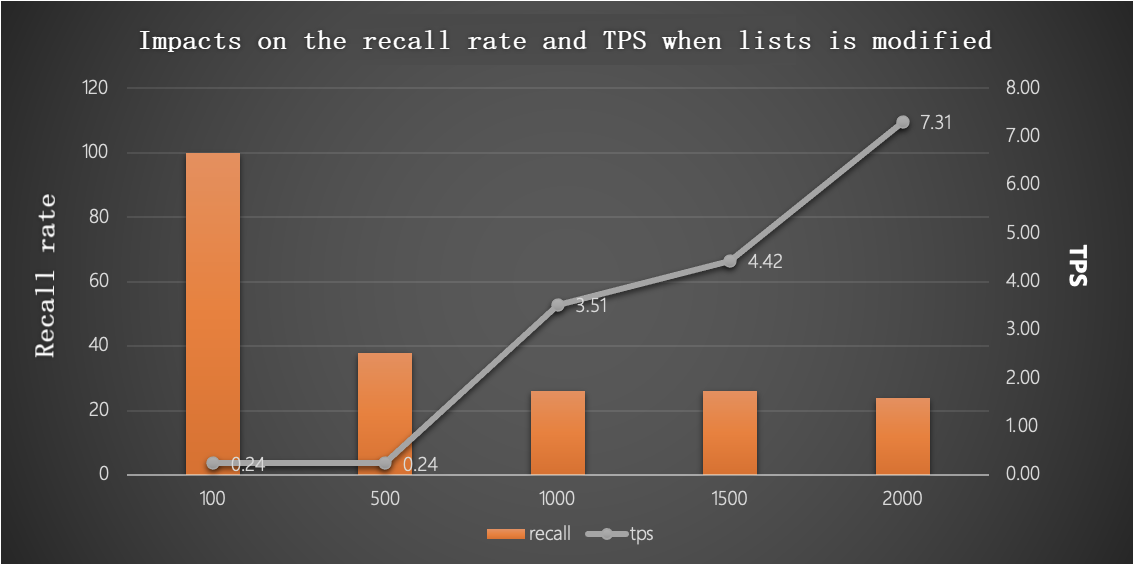
With probes = 20 and 1,000,000 rows: a higher lists value indicates a lower recall rate but a higher TPS.
Tune lists and probes for production
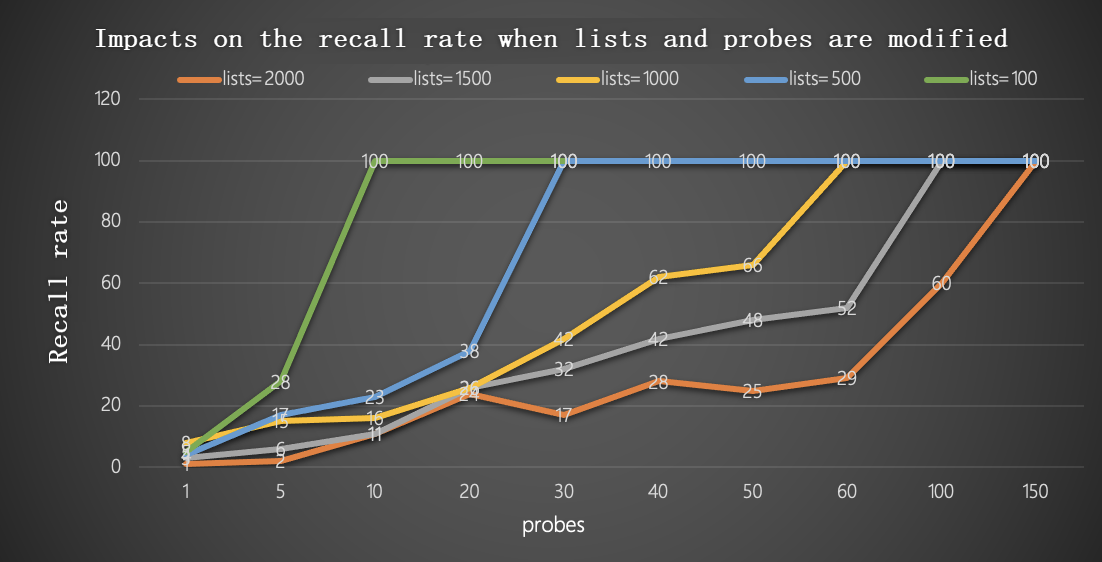
The following chart shows the combined trade-off between recall and throughput as both parameters vary.
Use these formulas as a starting point based on the number of rows in your table:
Up to 1,000,000 rows:
lists  = row_count / 1,000
probes = lists / 10
Over 1,000,000 rows:
lists  = sqrt(row_count)
probes = sqrt(lists)sqrt is the square root function. After applying the formulas, adjust probes upward if recall is insufficient, or downward to improve throughput.