Learn how to verify tracking implementation using IDE console logs, the QT tracking verification tool, and QT analytics modules.
1. Verification method of tracking
R&D: In the IDE console, the SDK outputs reporting logs
Test: QT background provides "tracking point verification" tool
Business: In the QT background, use the "analysis" module to build business indicators and verify whether calculation results match the expected business logic.
Detailed procedures for each method are described below.
1.1 Output tracking logs in the IDE console
1.1.1 Android
Call the UMConfigure.setLogEnabled(boolean) interface to control LOG output.
Note: Disable SDK running and debugging logs before the app goes live to avoid unnecessary log output.
Enable the log exporting feature
Call the following method to toggle SDK debug log output. Debug logging is disabled by default and must be enabled manually.
/**
* Set the switch for component-based logs.
* Parameter: boolean is set to false by default. If you want to view LOG, set it to true.
*/
UMConfigure.setLogEnabled(true);Note: To view logs during initialization, enable the LOG switch before calling the initialization method.
The following log entries are displayed:
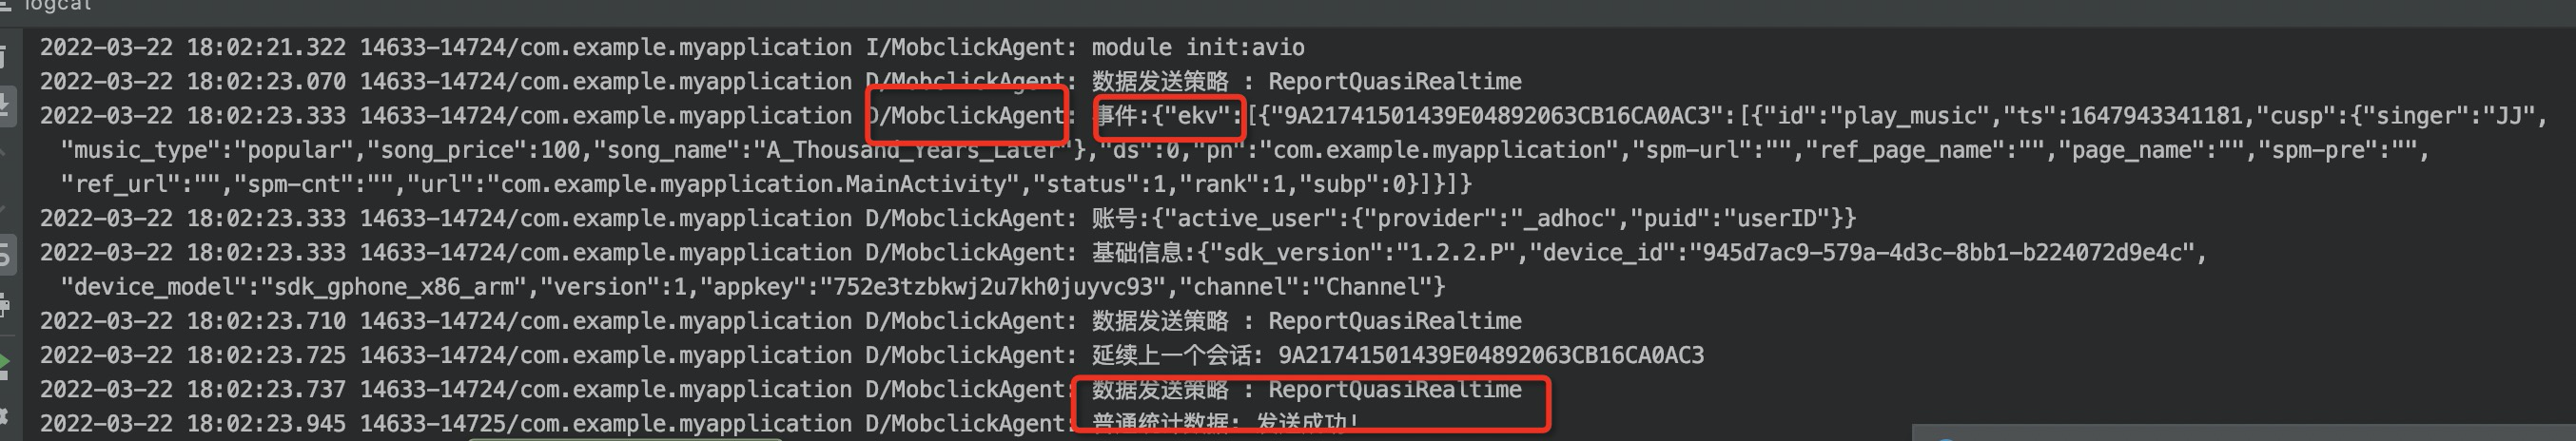
Log levels
-
Logs are classified into four levels for easy viewing:
-
Error (print SDK integration or run time error message).
-
Warn (print SDK warning information).
-
Info (print SDK prompt information).
-
Debug (print SDK debugging information).
1.1.2 iOS
On iOS, the log module is a separate plug-in that must be integrated before use.
Import Log Plug-in
pod import
pod 'UMCCommonLog'Local Import
-
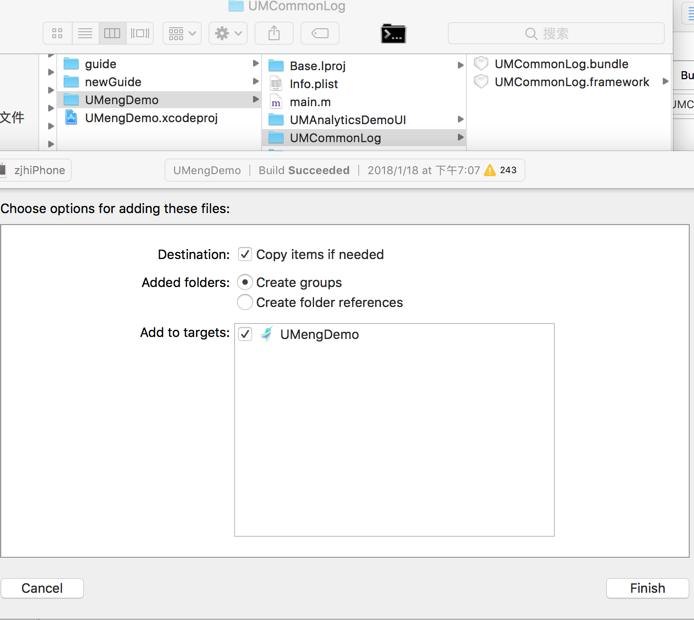
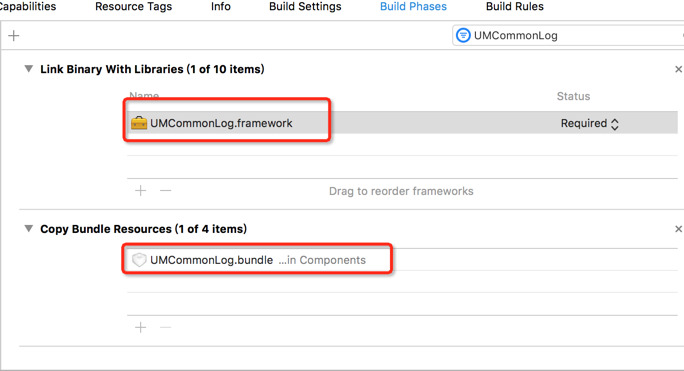
Select and download the SDK functional components. Decompress the. zip file to obtain the corresponding component package (UMCommonLog.framework,UMCommonLog.bundle).
2. XcodeFile -> Add Files to "Your Project" and select the downloaded component package-> Add in the pop-up Panel. (Note: check "Copy items if needed")
Log Toggle
Use the UMConfigure.h API of the UMCommon.framwork header file to enable logging.
API:
/**Specify whether to output the log information of the SDK in the console.
 @ param bFlag Default NO (no log output); Set to YES to output log information for debugging reference. When publishing the product, set it to NO.
 */
+ (void)setLogEnabled:(BOOL)bFlag;
Example
#import <UMCommon/UMCommon.h>
- (BOOL)application:(UIApplication *)application didFinishLaunchingWithOptions:(NSDictionary *)launchOptions {
// Developers need to explicitly call this function for the logging system to work.
[UMCommonLogManager setUpUMCommonLogManager];
[UMConfigure setLogEnabled:YES];// Specify to enable logging.
[UMConfigure setCustomDomain:@"https://www.umeng.com" standbyDomain:nil];// Set the domain name.
[UMConfigure initWithAppkey:@"Your appkey" channel:@"App Store"];
}
The following log entries are displayed:
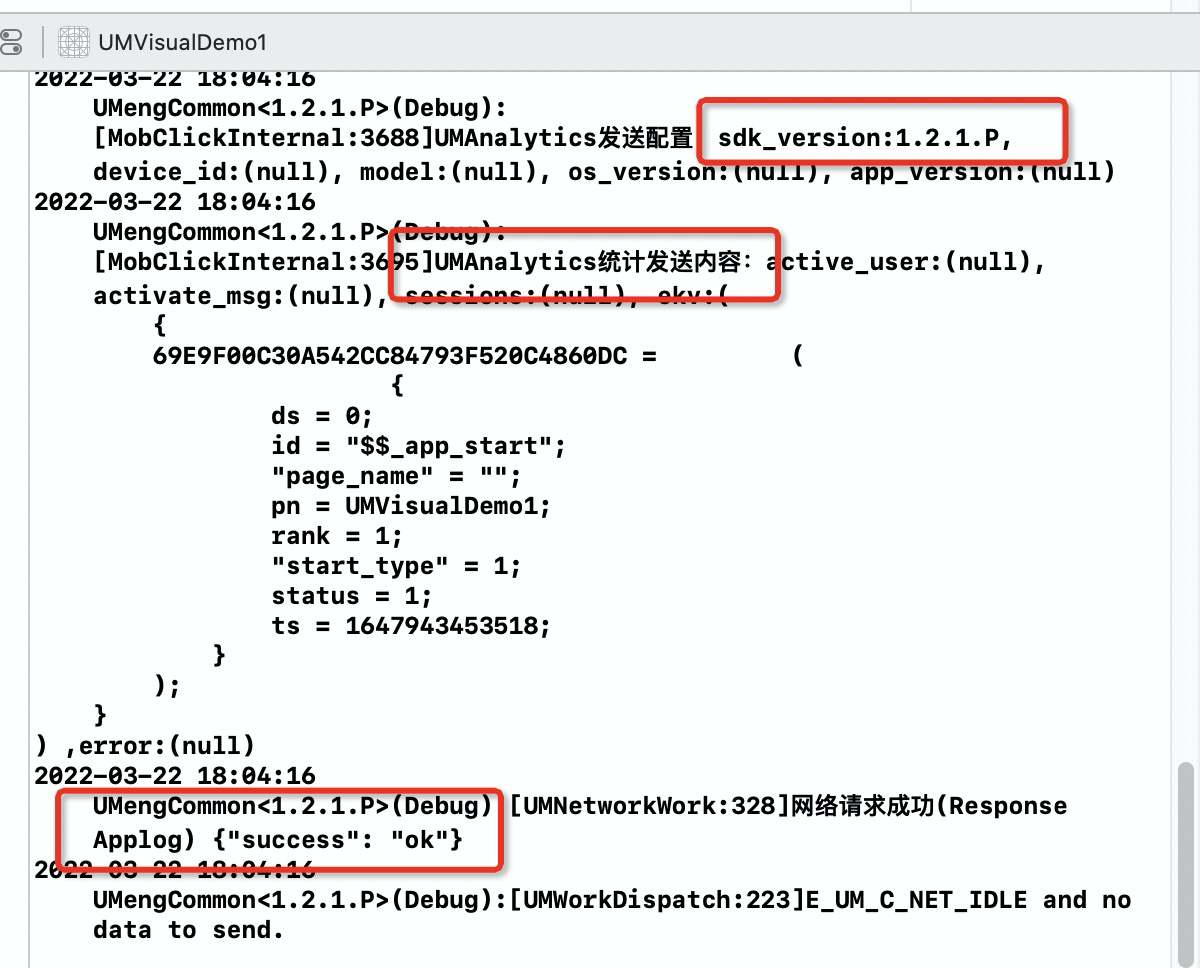
Log levels
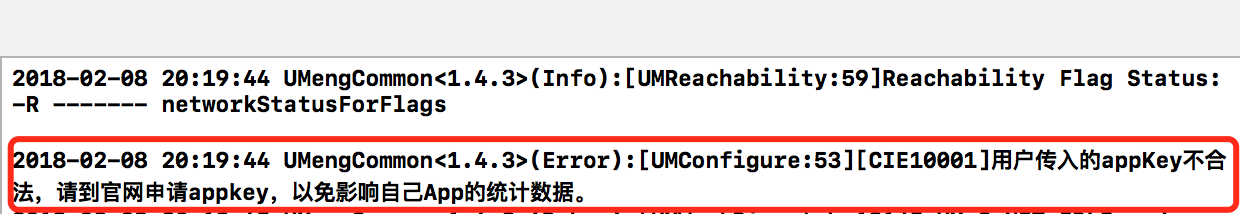
For example, if the AppKey is empty, the following log is printed:
-
2018-02-08 20:19:44: Refers to the current printing time;
-
UMengCommon: the name of the component-based SDK(UMCommon.framework).
-
<1.4.3>: the version number of the component-based SDK(UMCommon.framework).
-
(Error): refers to logs whose log level is Error;
-
[CIE10001]: refers to the code of the log FAQ. You can also find the corresponding solution through the FAQ document.
-
The specified AppKey is invalid. Apply for an AppKey on the official website to avoid affecting the statistics of your app. : the error message that helps the developer identify the cause.
1.1.3 Small program
Enable the log exporting feature
aplus.aplus_queue.push({
  action: 'aplus.setMetaInfo',
  arguments: ['DEBUG', true]
});-
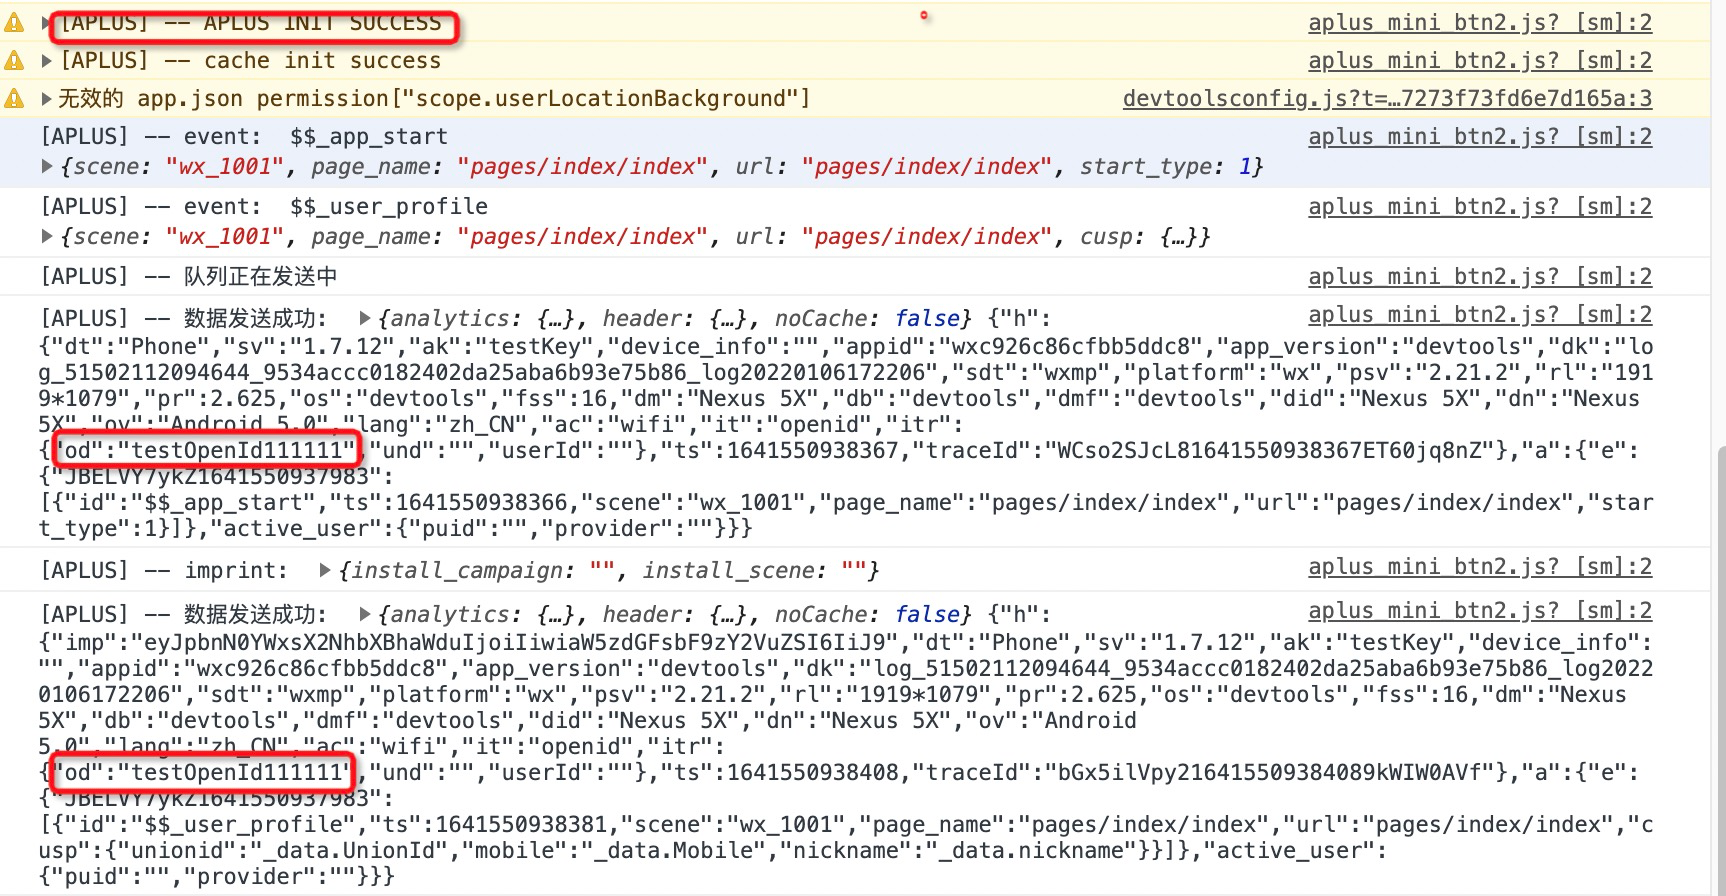
Go to the IDE and open the console option in the debugging tool. You can see the log report as shown in the following figure.
1.1.4 Web
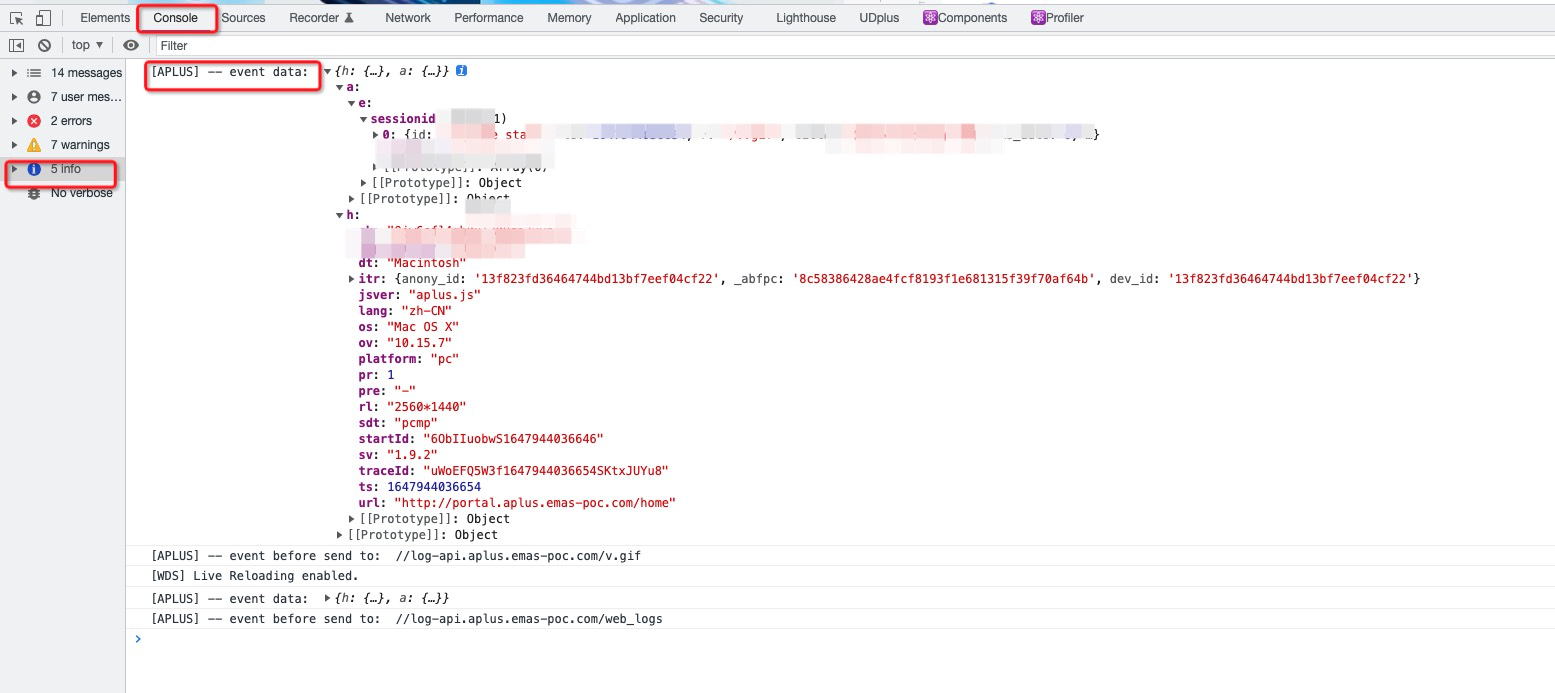
Enable the log exporting feature
aplus.aplus_queue.push({
  action: 'aplus.setMetaInfo',
  arguments: ['DEBUG', true]
});
The following log entries are displayed:
1.2 QT background "tracking verification" tool
The tracking verification locations are as follows: 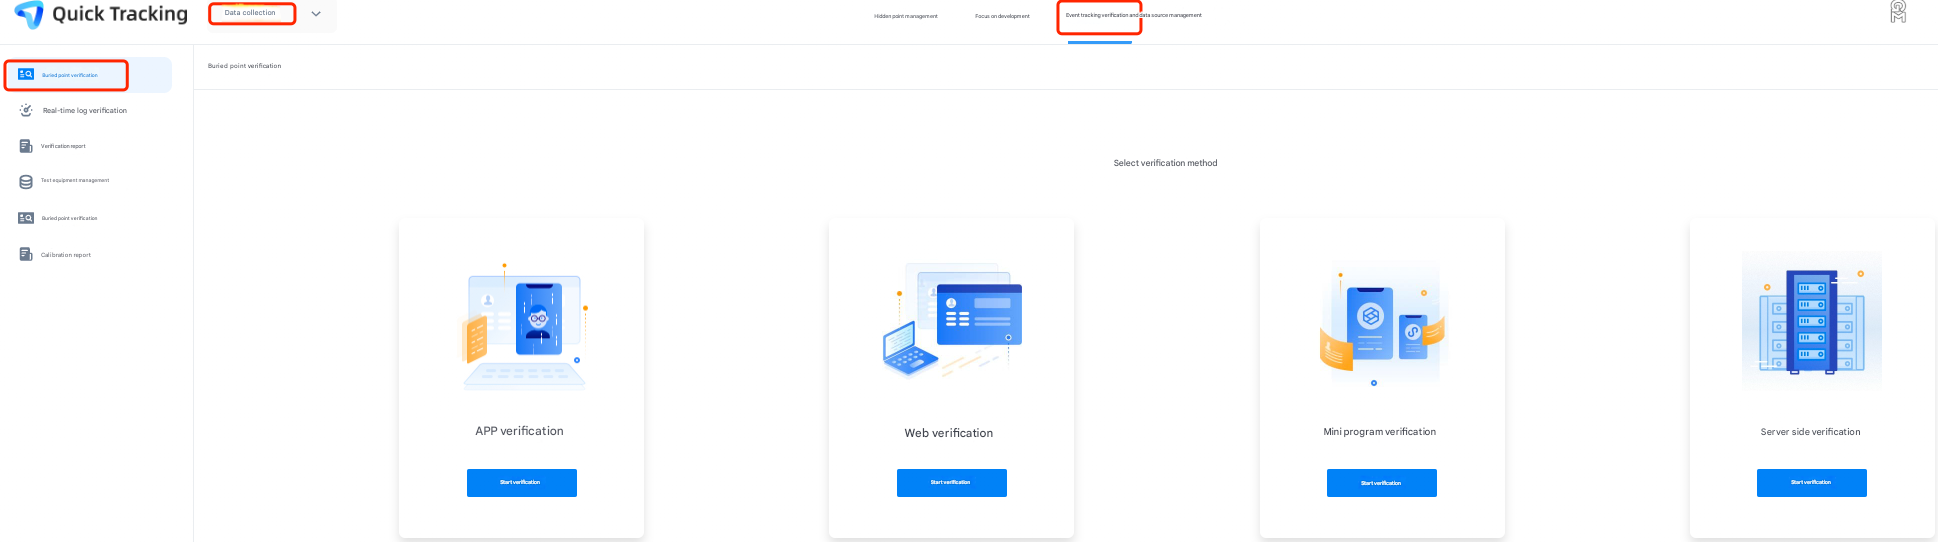
1.2.1 APP verification
-
Android
Android currently supports two methods: scan code verification and API verification
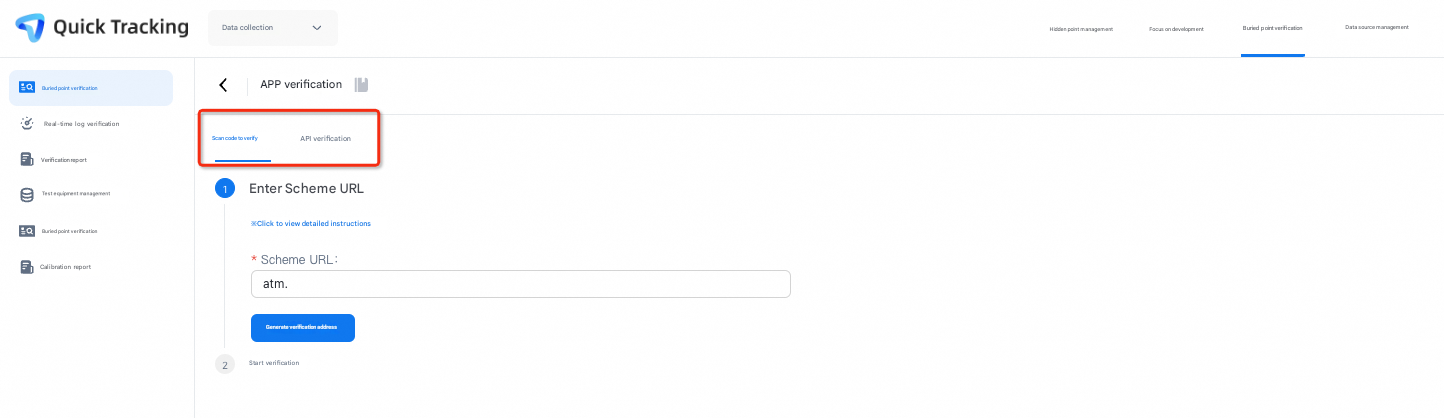
1.1 scan code verification
When integrating app, find the activity of the response android.intent.action.MAIN (that is, the first Activity that the application can be evoked externally) in the manifest.xml file, and add the following code so that the application can be evoked by the specified connection scheme.
<intent-filter>
  <action android:name="android.intent.action.VIEW"/>
  <category android:name="android.intent.category.DEFAULT" />
  <category android:name="android.intent.category.BROWSABLE" />
  <data android:scheme="atm. Your appkey" />
</intent-filter>1. Please use a separate intent-filter, juxtaposed with other intent-filters, and do not fill the above code into other intent-filters; 2. Please replace "your appkey" with your real appkey, the same below;
-
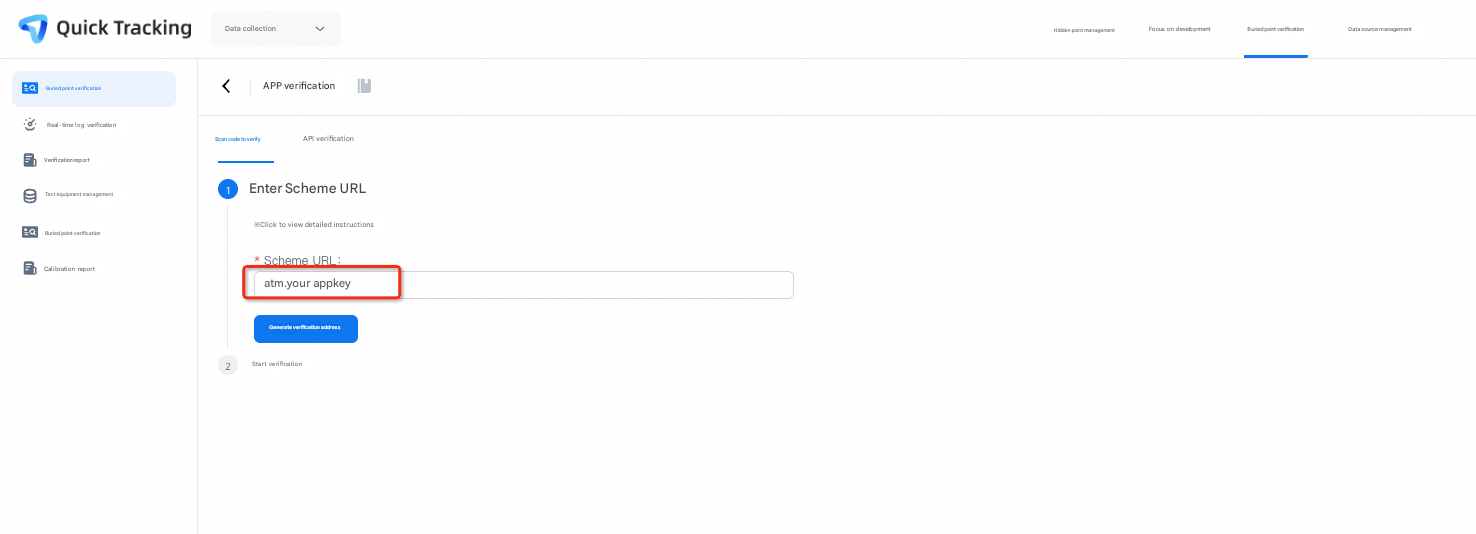
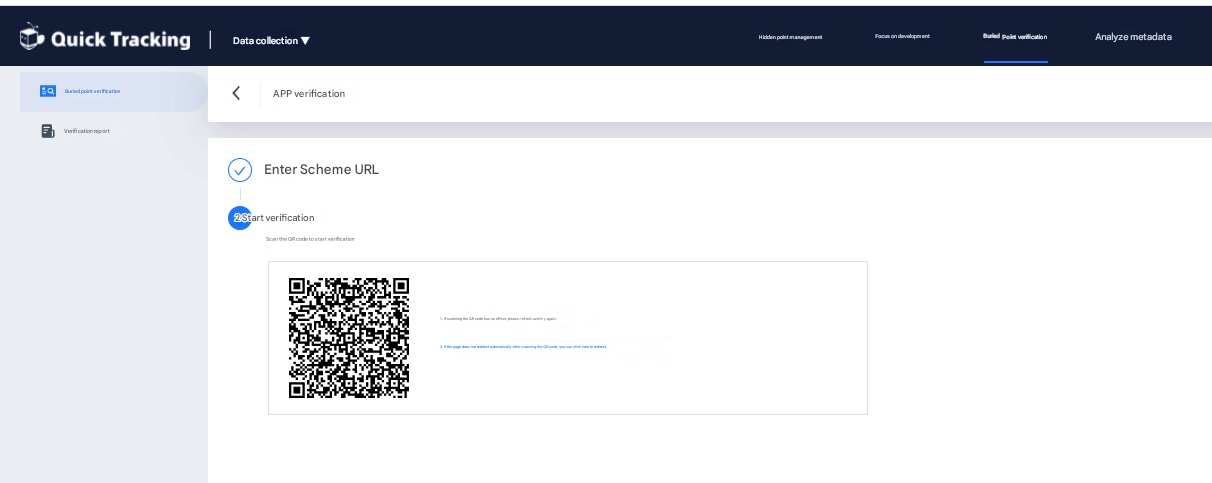
In the module, enter "atm. Your appkey", generate a QR code and scan it using a browser
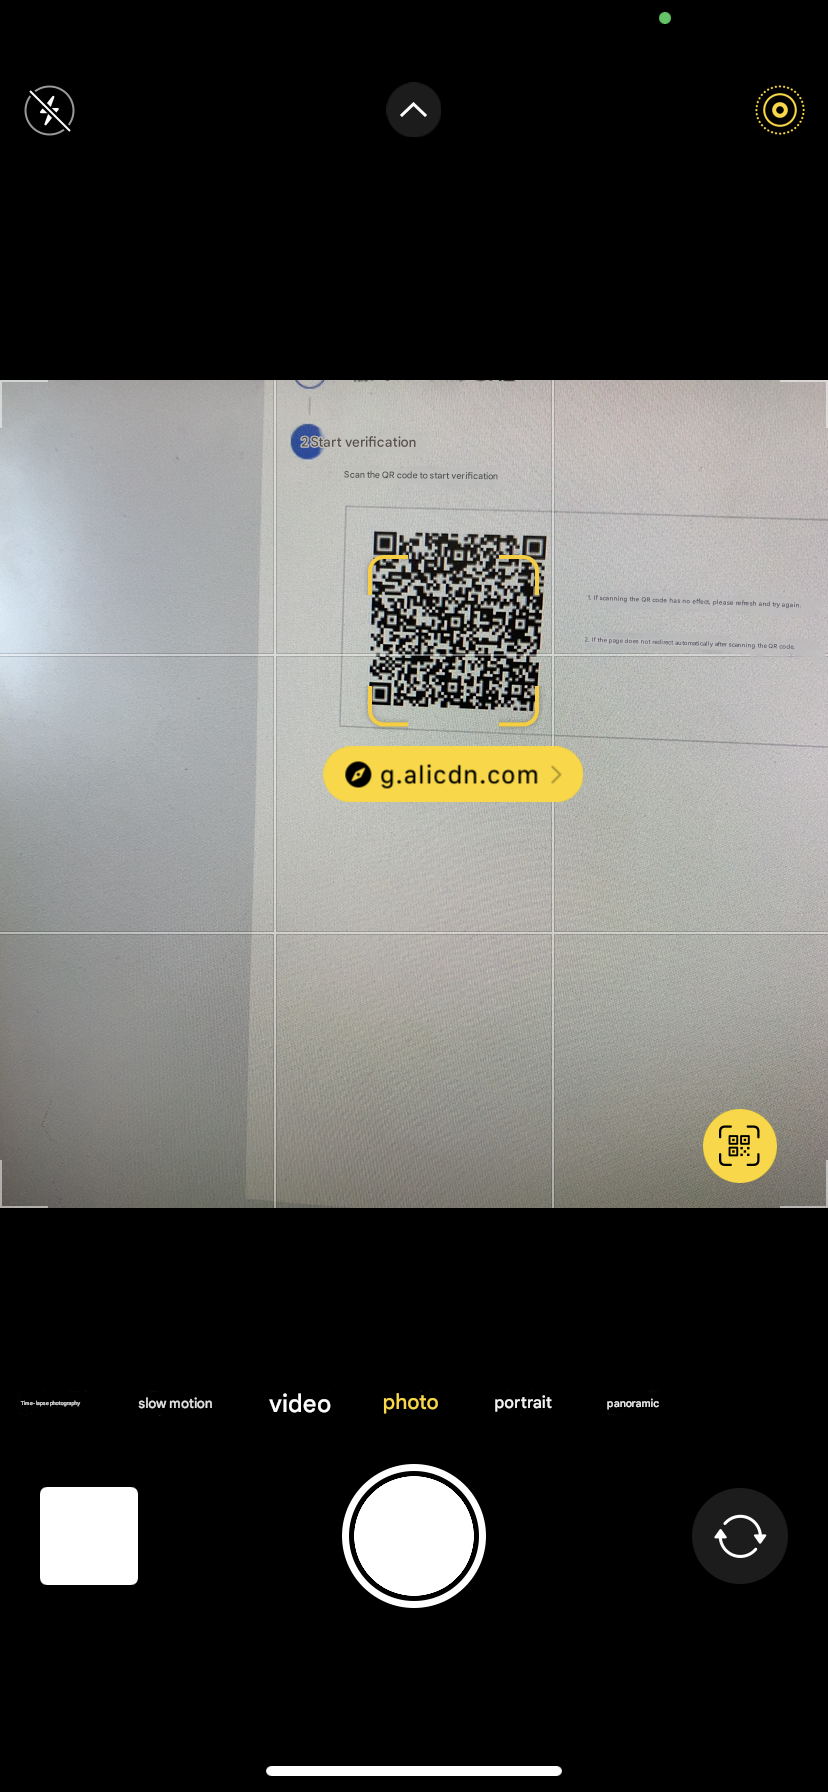
-
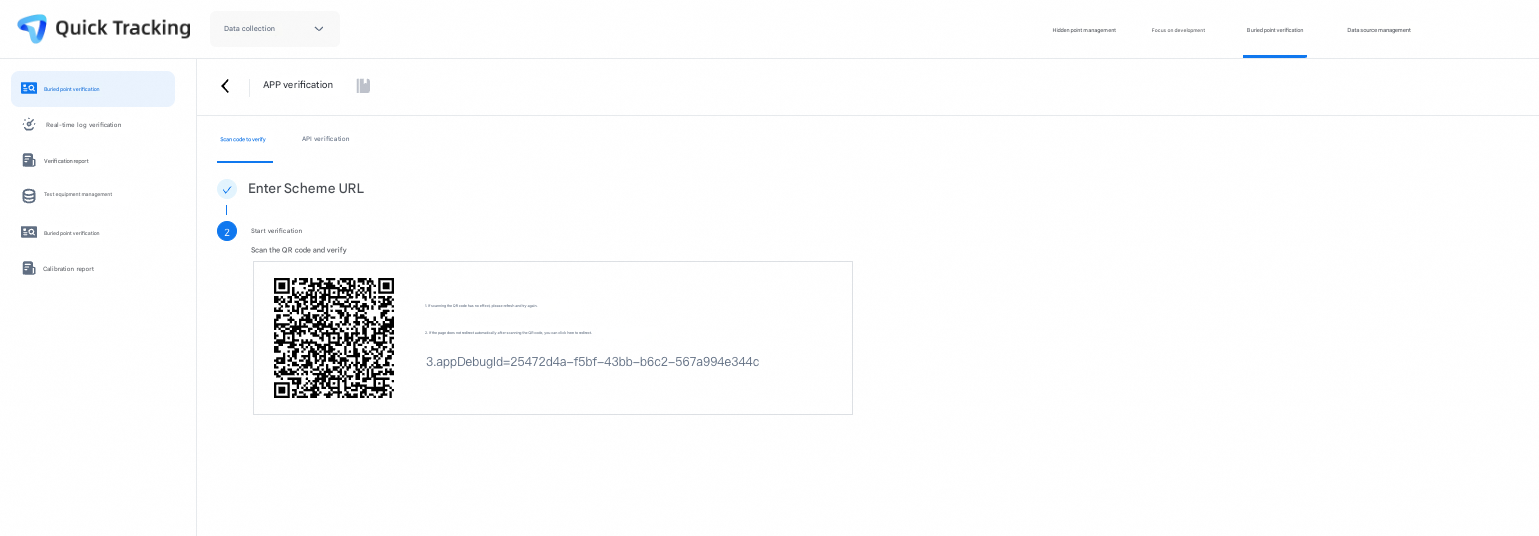
After scanning the code with the browser, a web page will be opened and click "Start Burial Test (Intranet Valid)"
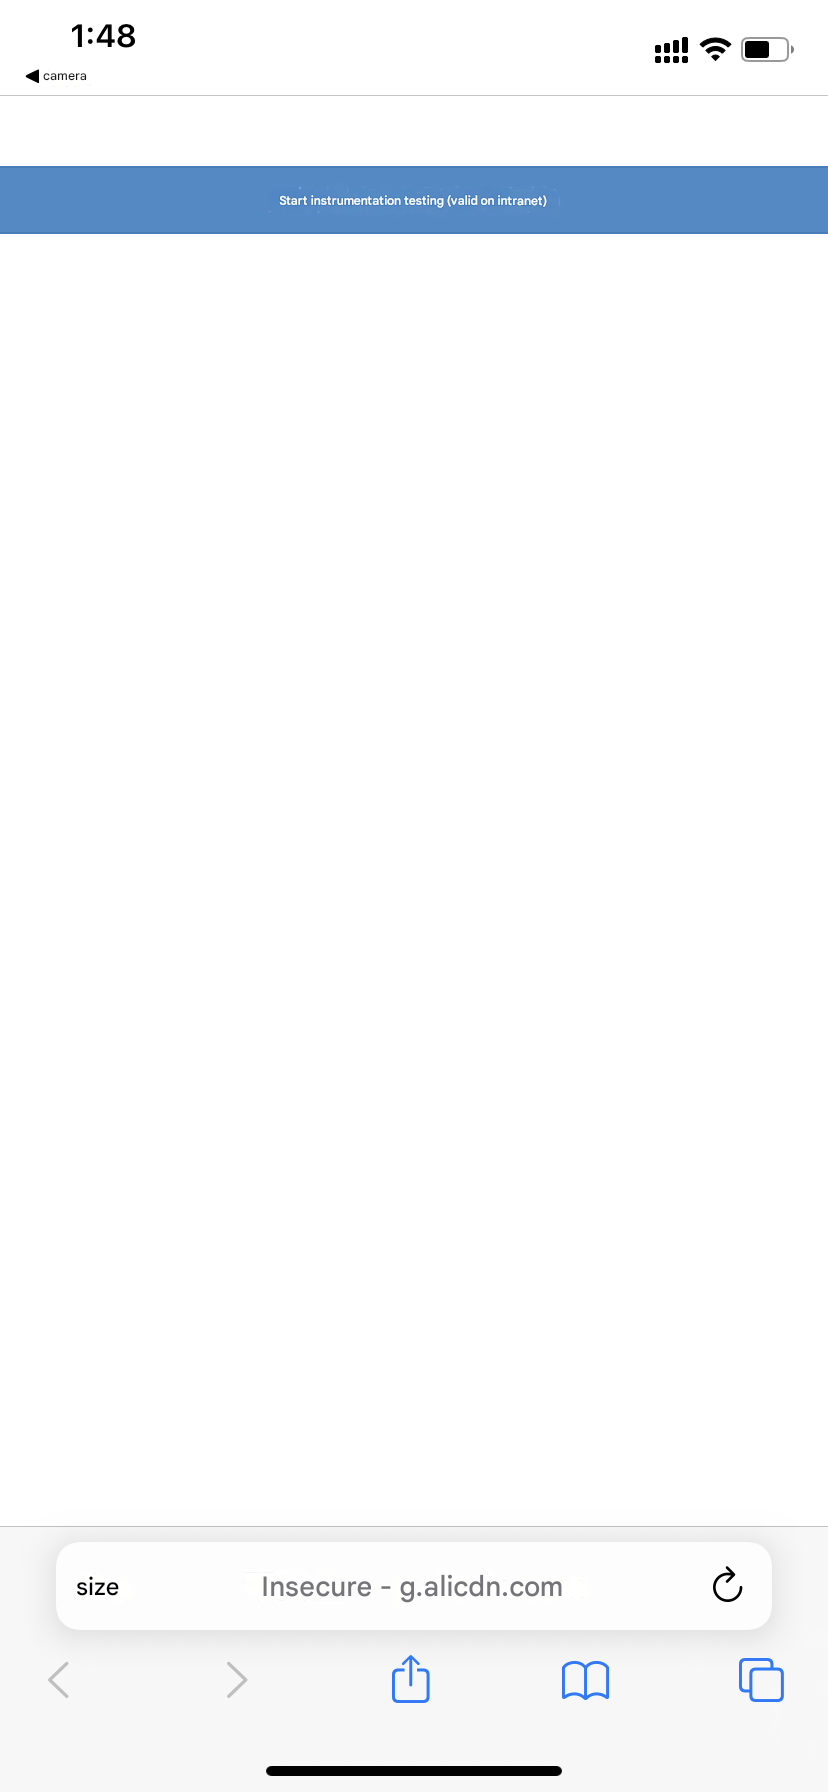
-
After clicking, the tracking verification module will automatically jump to the following page
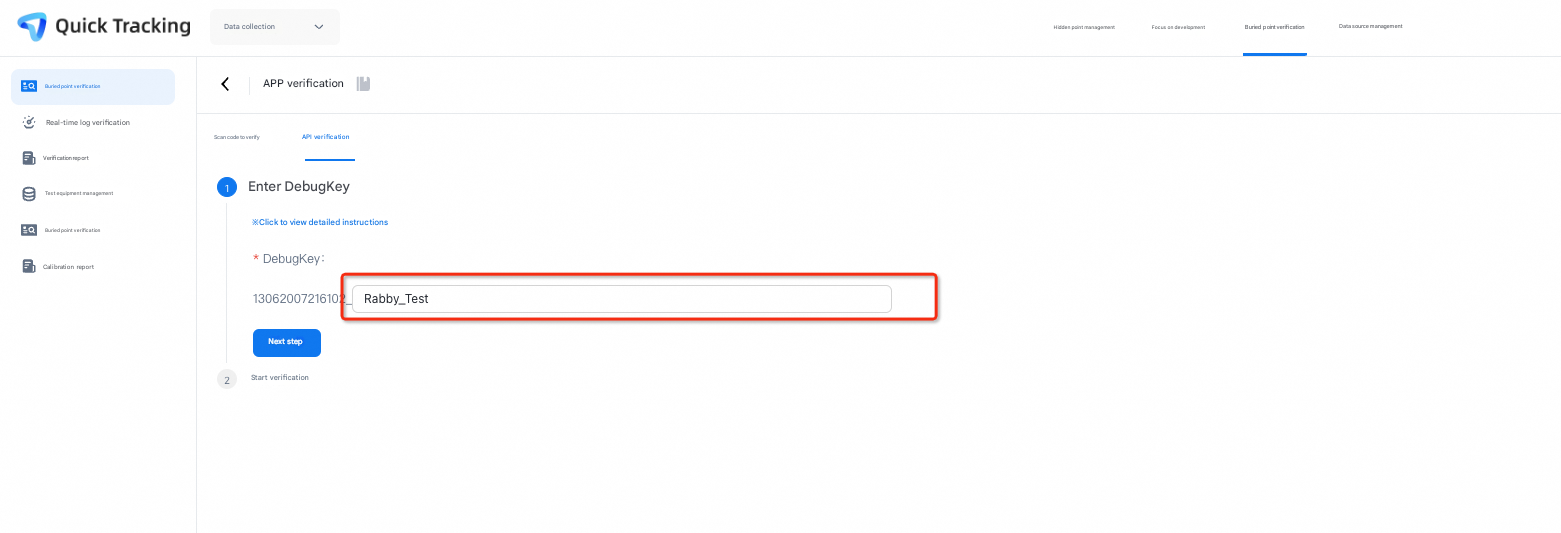
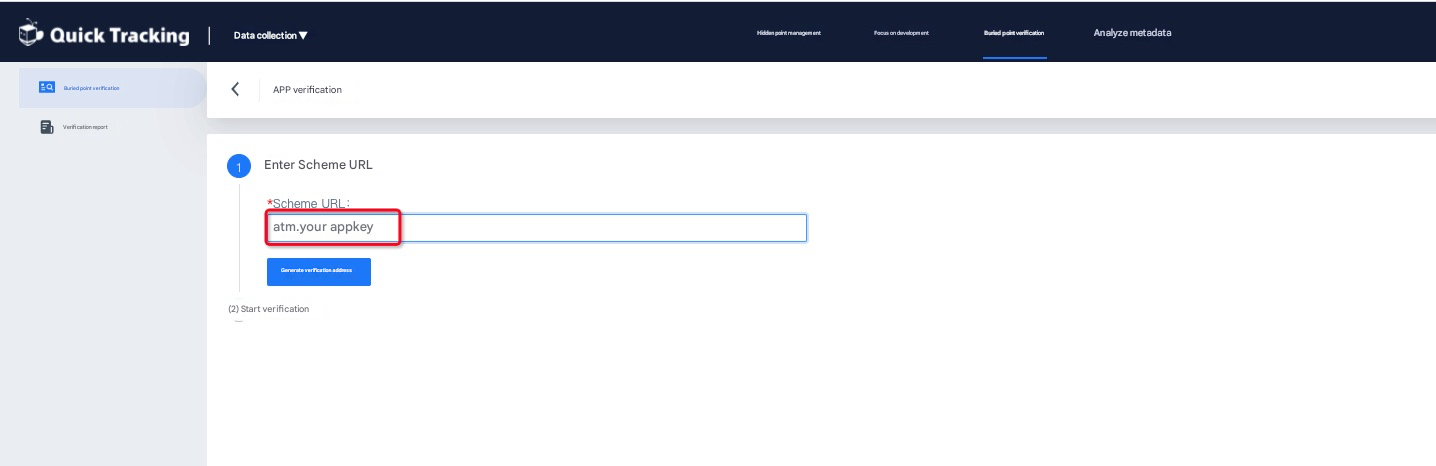
1.2 API verification
Click the API verification option, enter your custom DebugKey in the red box, and click Next
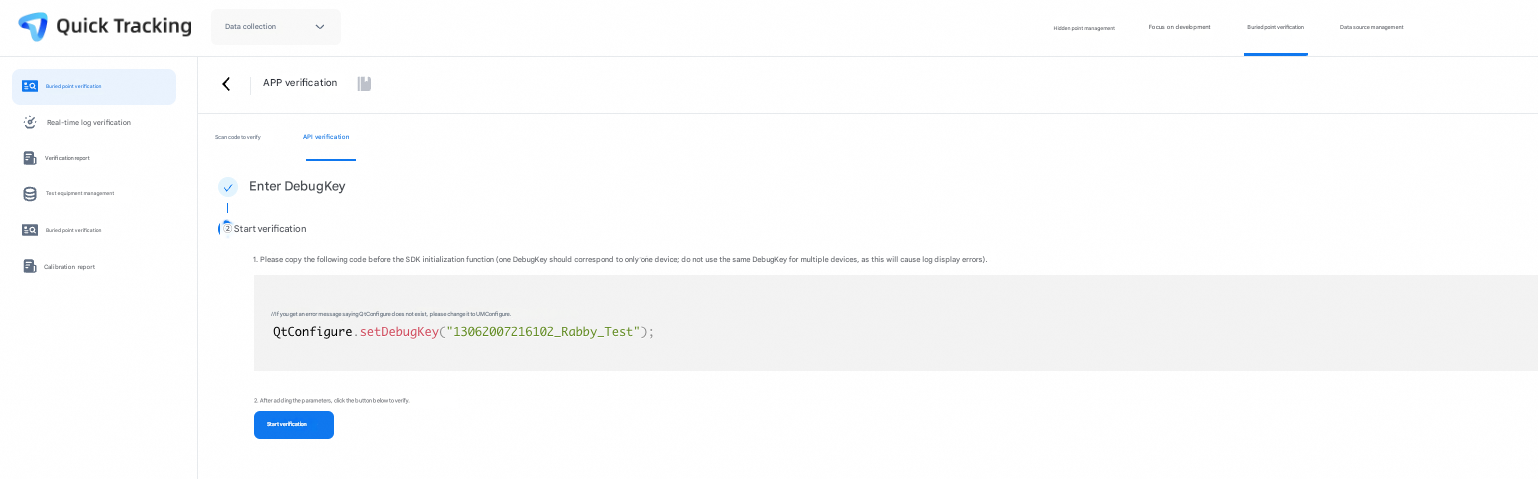
After clicking Next, relevant code fragments will be generated and pasted into the project initialization method.
        ...
        QtConfigure.preInit(this, Constant.DEFAULT_APPKEY, Constant.DEFAULT_CHANNEL);

         // If QtConfigure does not exist, change it to UMConfigure.
        QtConfigure.setDebugKey("13062007216102_Rabby_Test");
        ...
Recompile and run applications
Click the Start Verification button of the web page to jump to the APP verification page to verify the tracking.
-
iOS
-
Configure evocation codes
Add your URL Scheme to the project. The URL Scheme is located in the project settings target - > tab Info - > URL Types. The filled scheme:atm. Your appkey. Call function [MobClick handleUrl:url] in AppDelegate to receive URL
- (BOOL)application:(UIApplication *)application openURL:(nonnull NSURL *)url options:(nonnull NSDictionary<UIApplicationOpenURLOptionsKey,id> *)options
{
    if ([MobClick handleUrl:url]) {
        return YES;
    }

    return YES;
}-
In the module, enter "atm. Your appkey", generate a QR code and scan it using a browser

-
After scanning the code with the browser, a web page will be opened and click "Start Tracking Test (Intranet Valid)"

-
After clicking, the tracking verification module will automatically jump to the following page
-
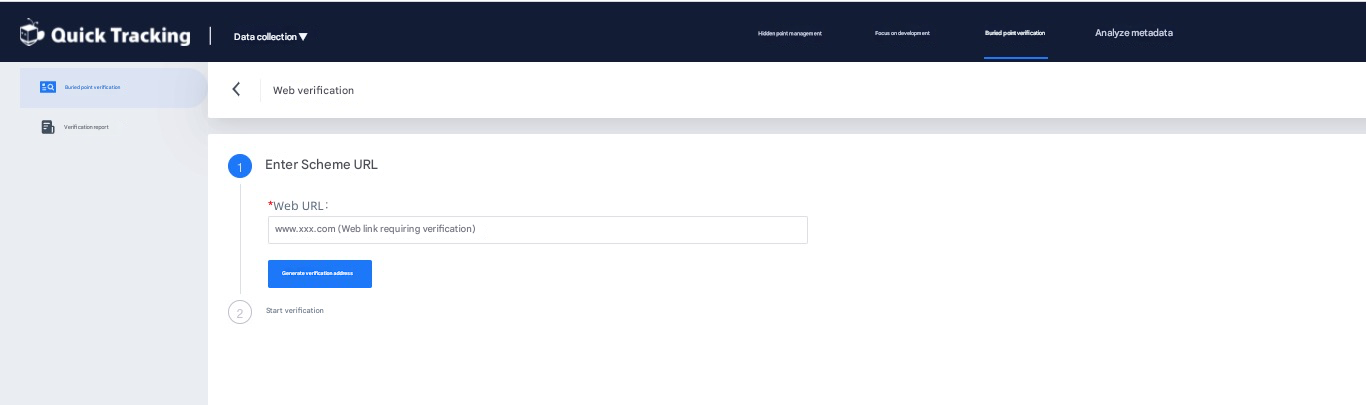
Web
-
Fill in the web page link to be verified into the input box and click "Generate Verification Address"
-
Scan code /click link as required
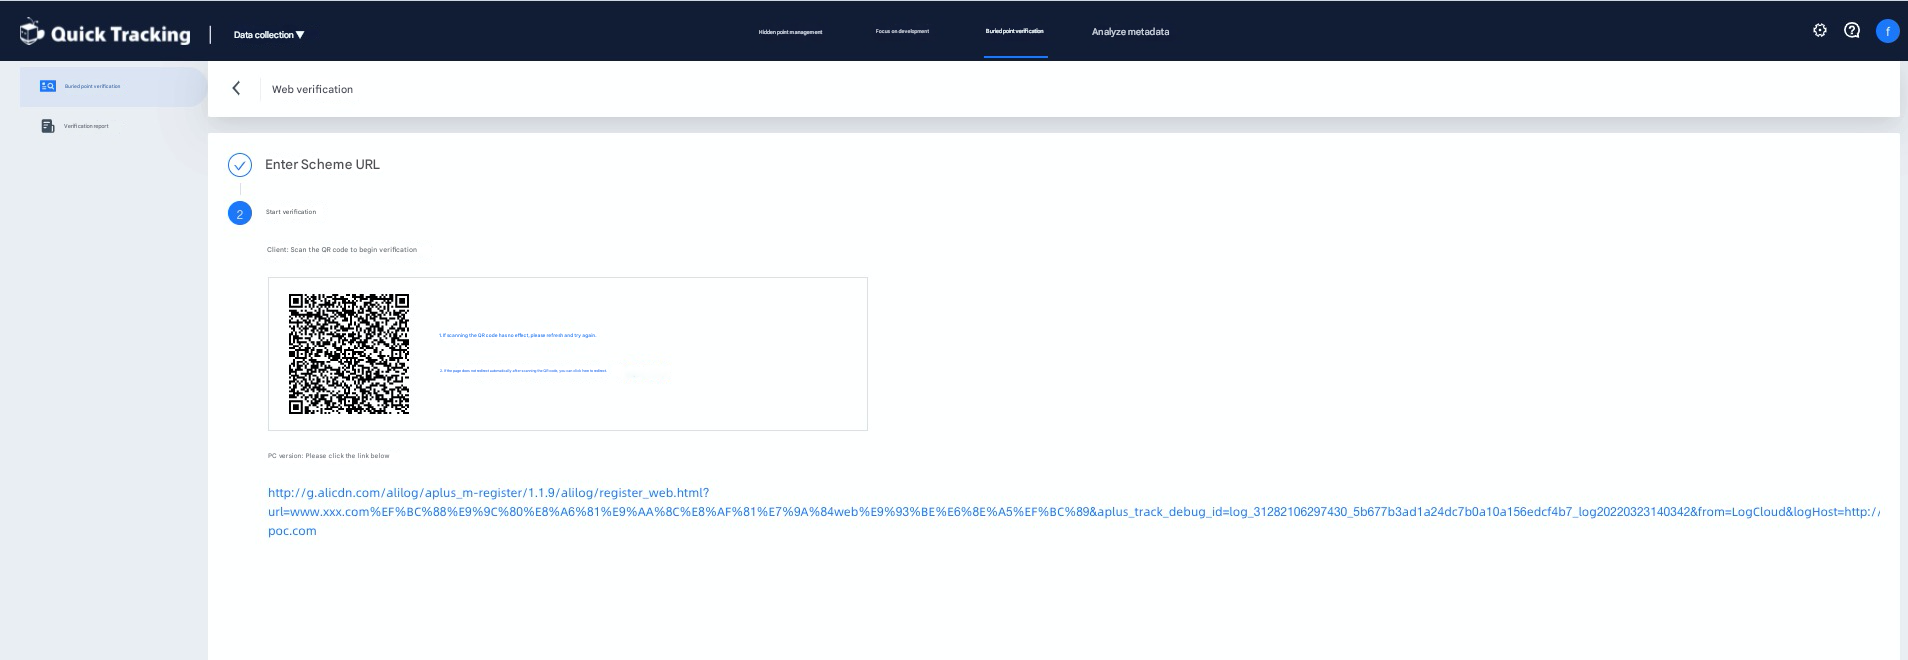
-
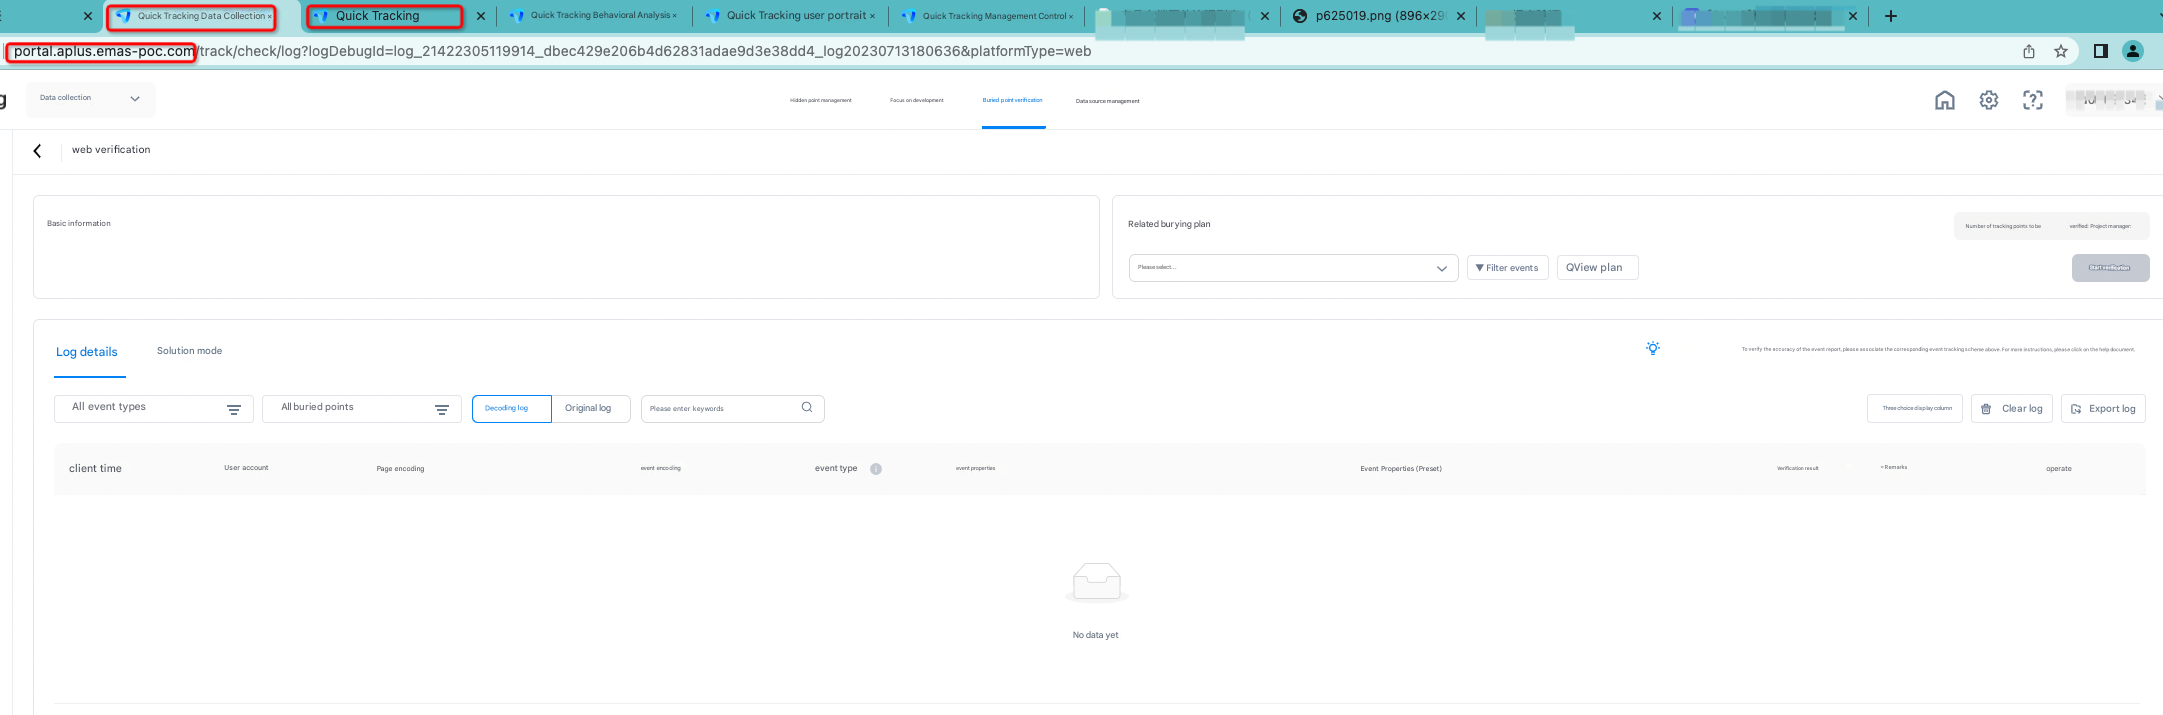
After clicking the link on the pc side, the browser will open a new tab to display the content of the URL link you entered. You can "track the trigger point" here and return to "track verification" to view real-time logs.
-
Mini Program
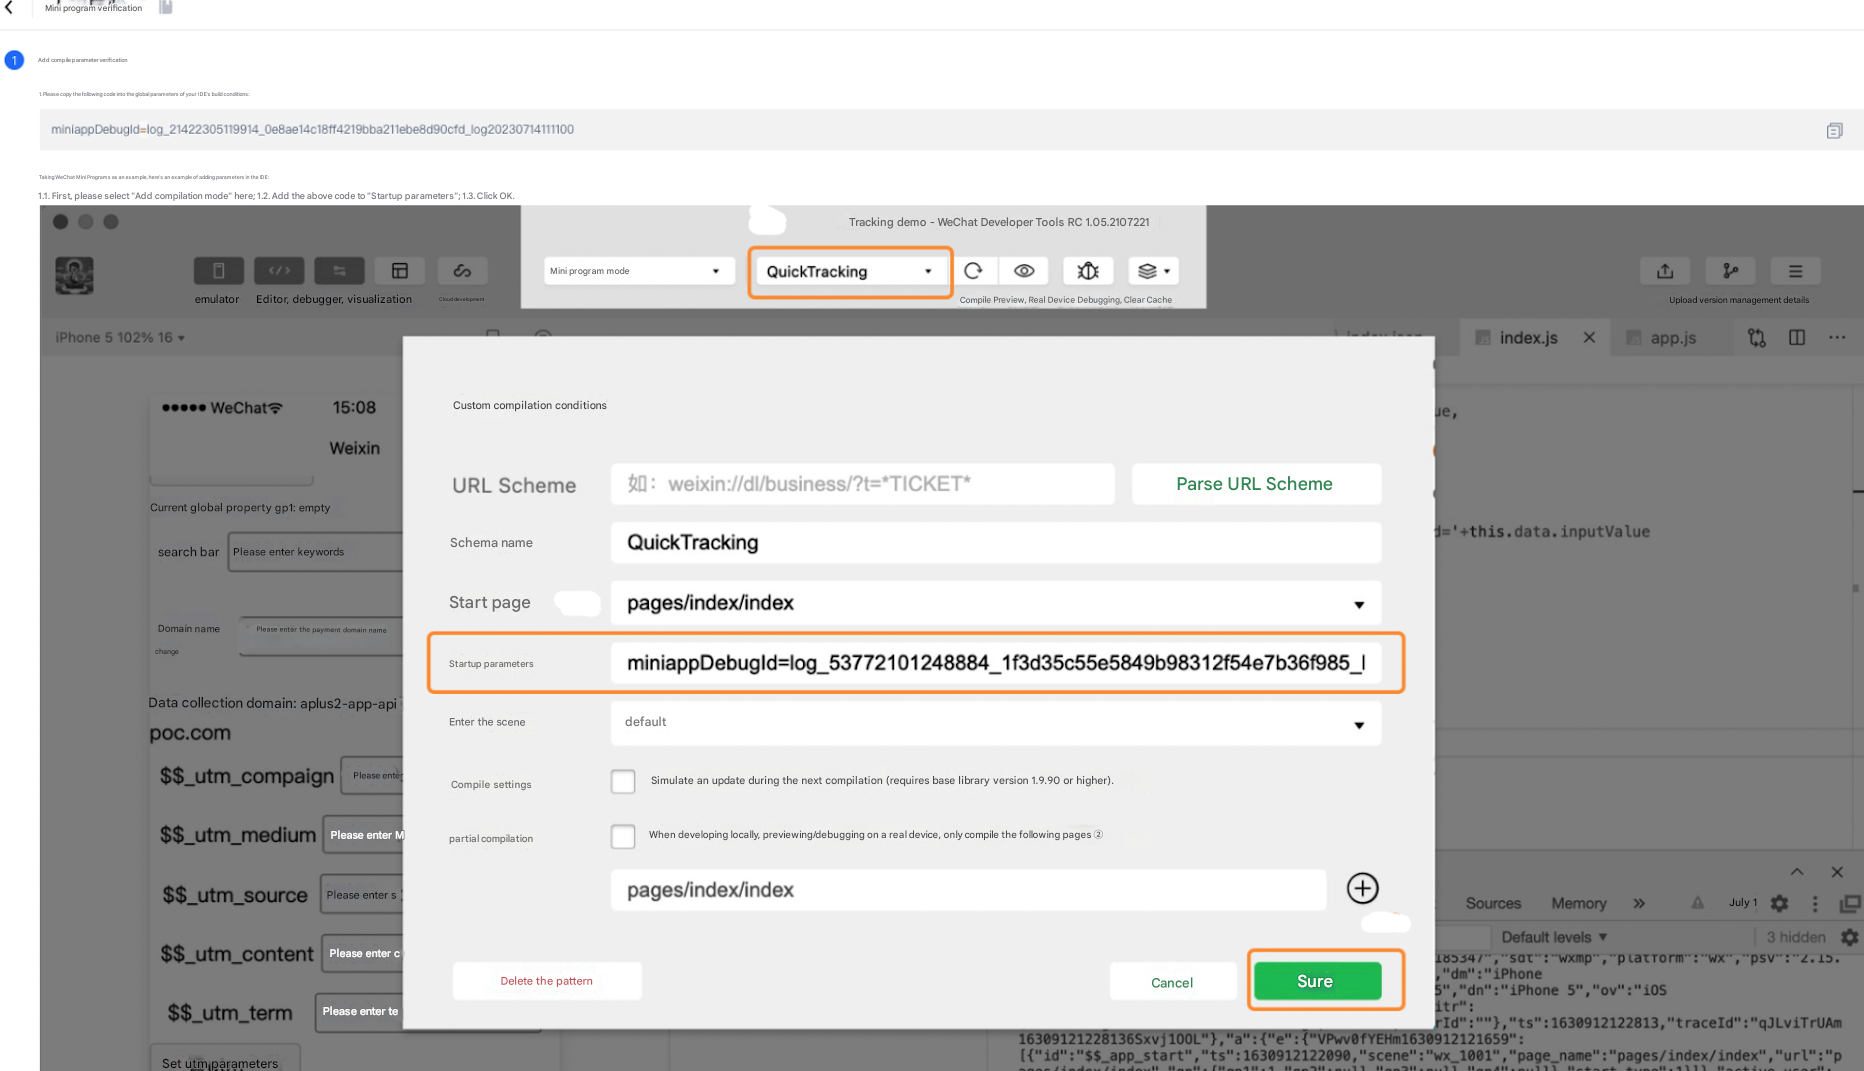
Enter "miniappDebugId" on the page into "Startup Parameters"
Take the WeChat mini program as an example. Example:
1.1. First, please select "add compilation mode" here; 1.2. Add the above code to "startup parameters"; 1.3. Click OK. 
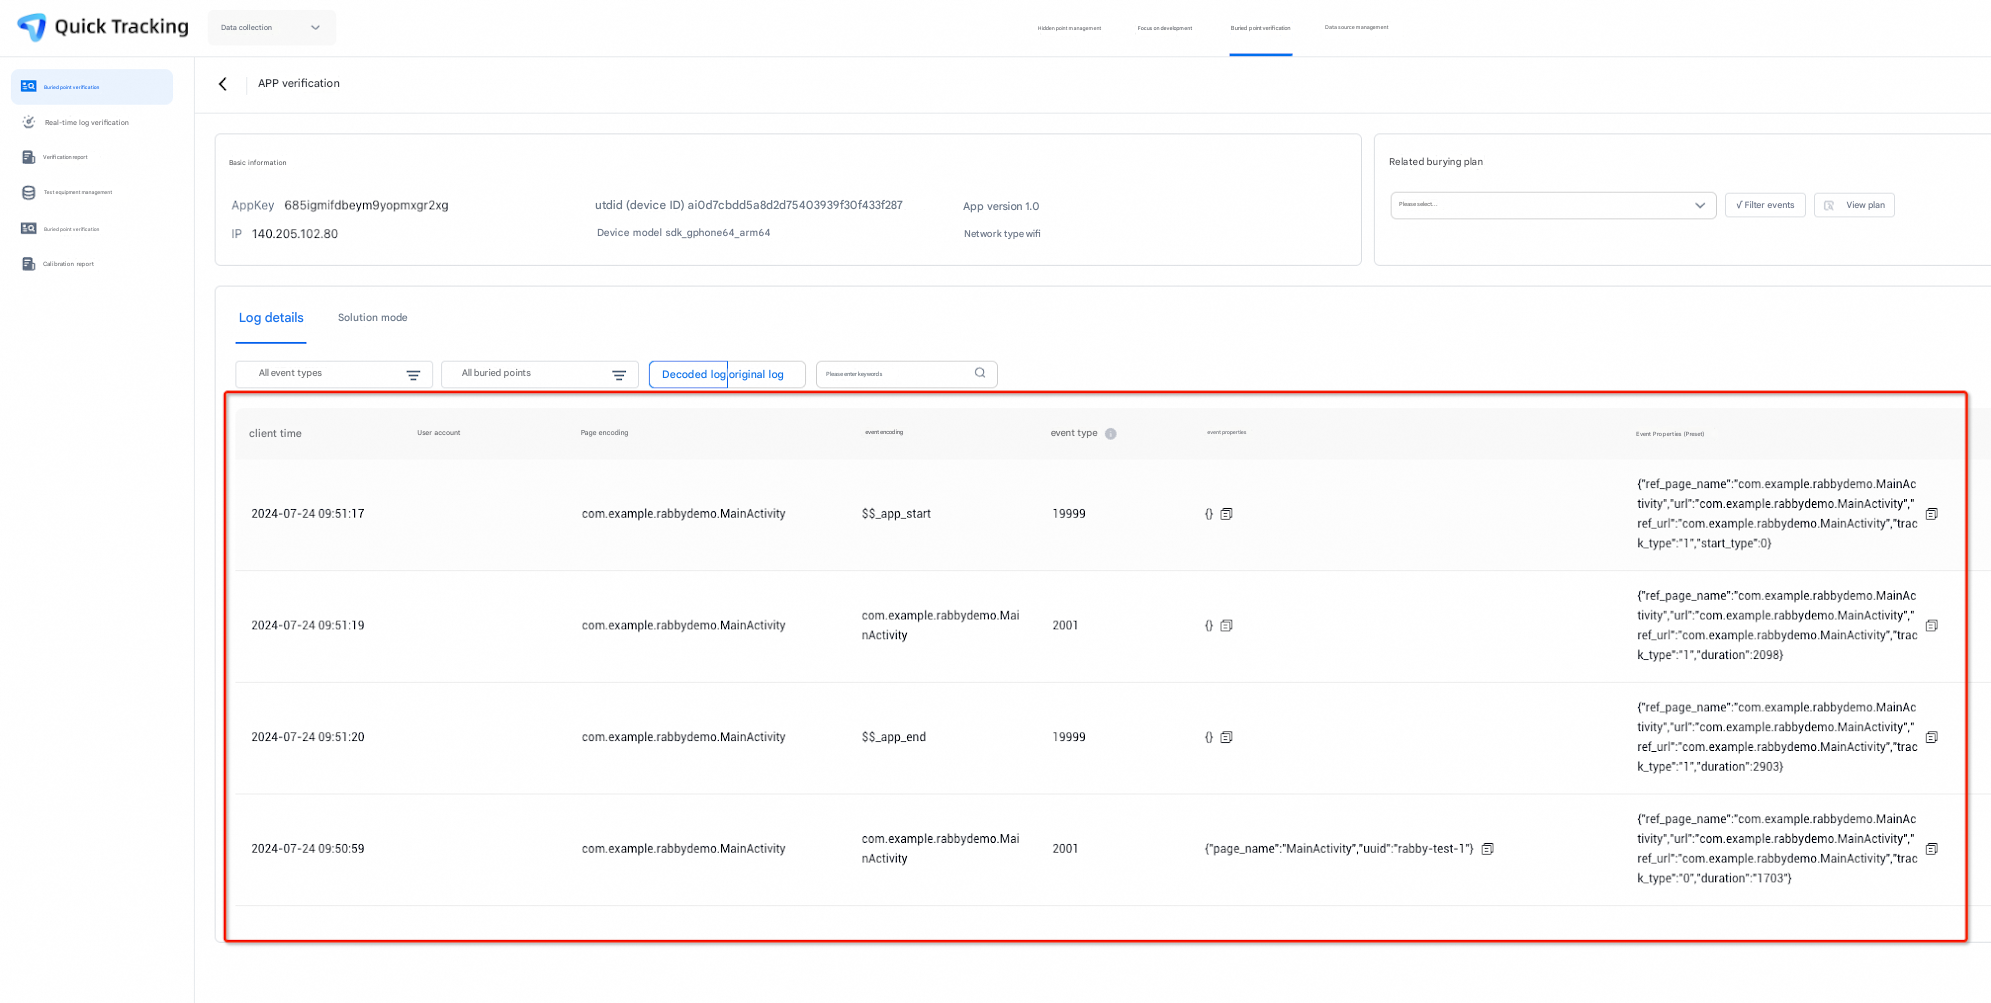
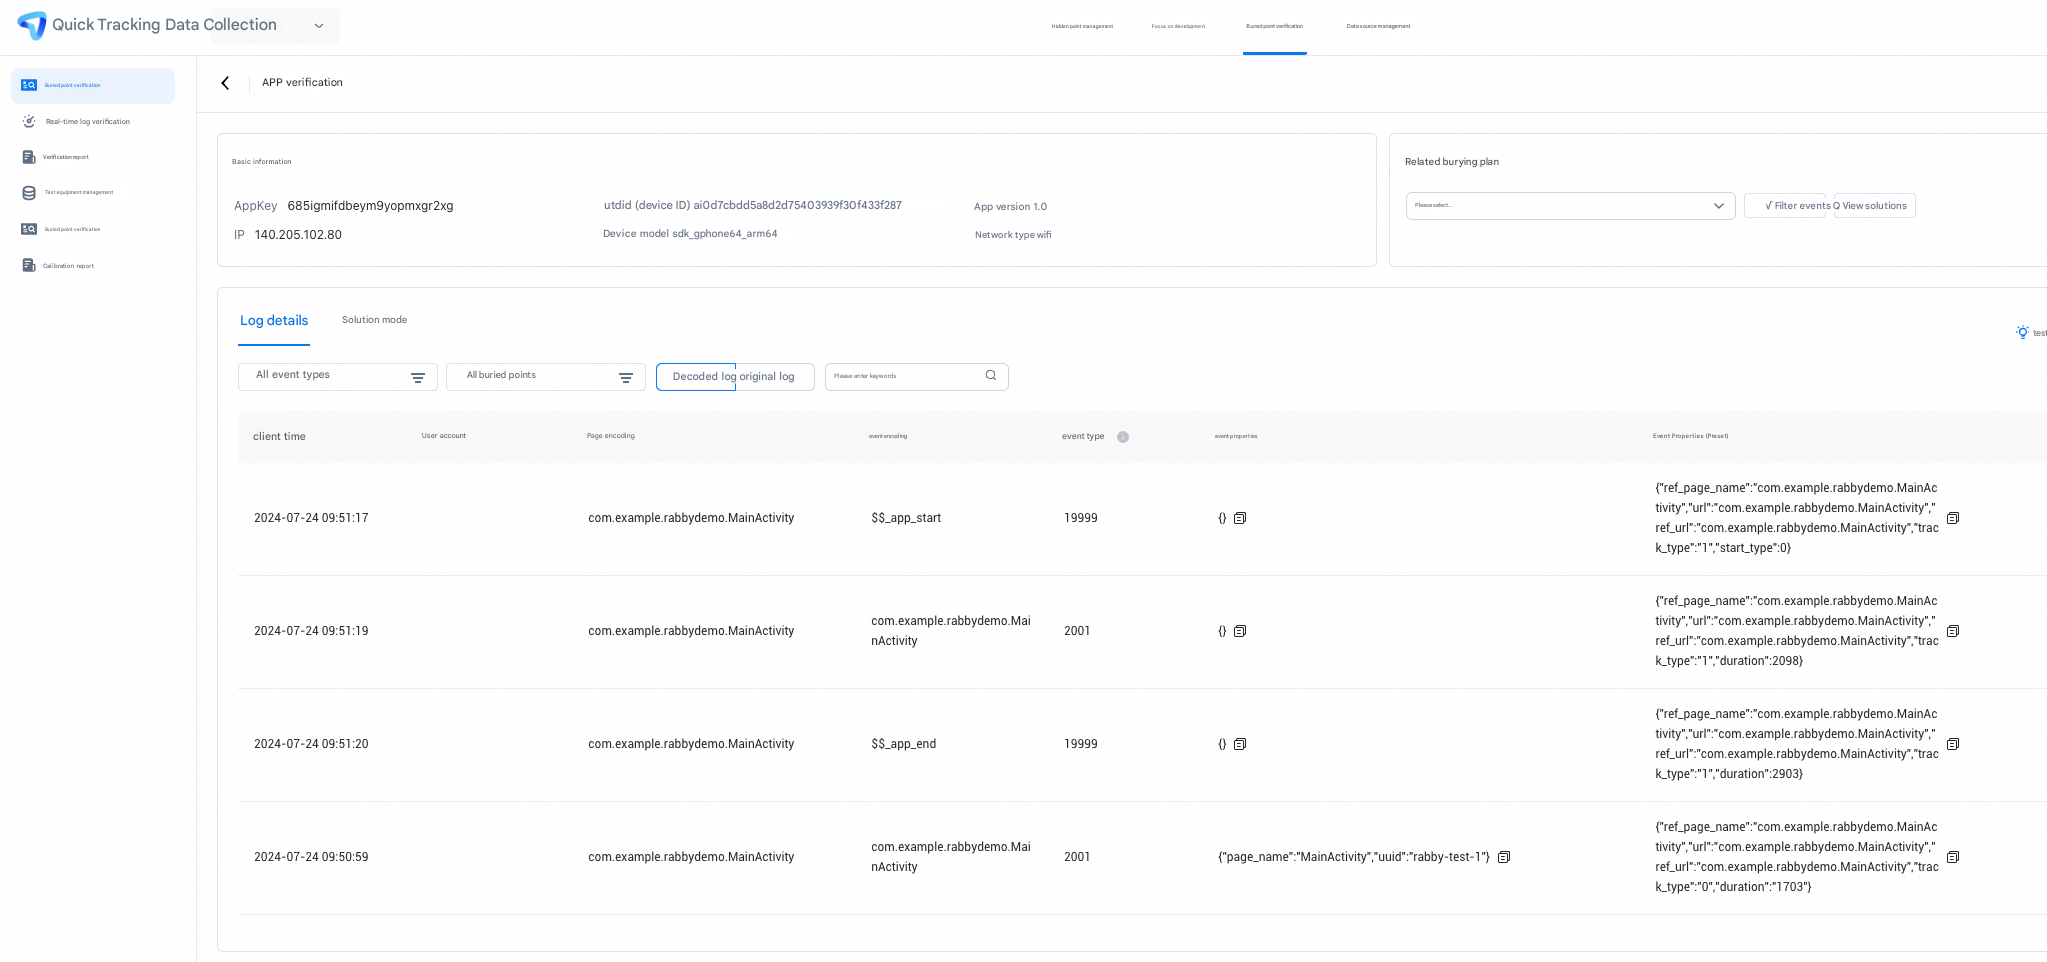
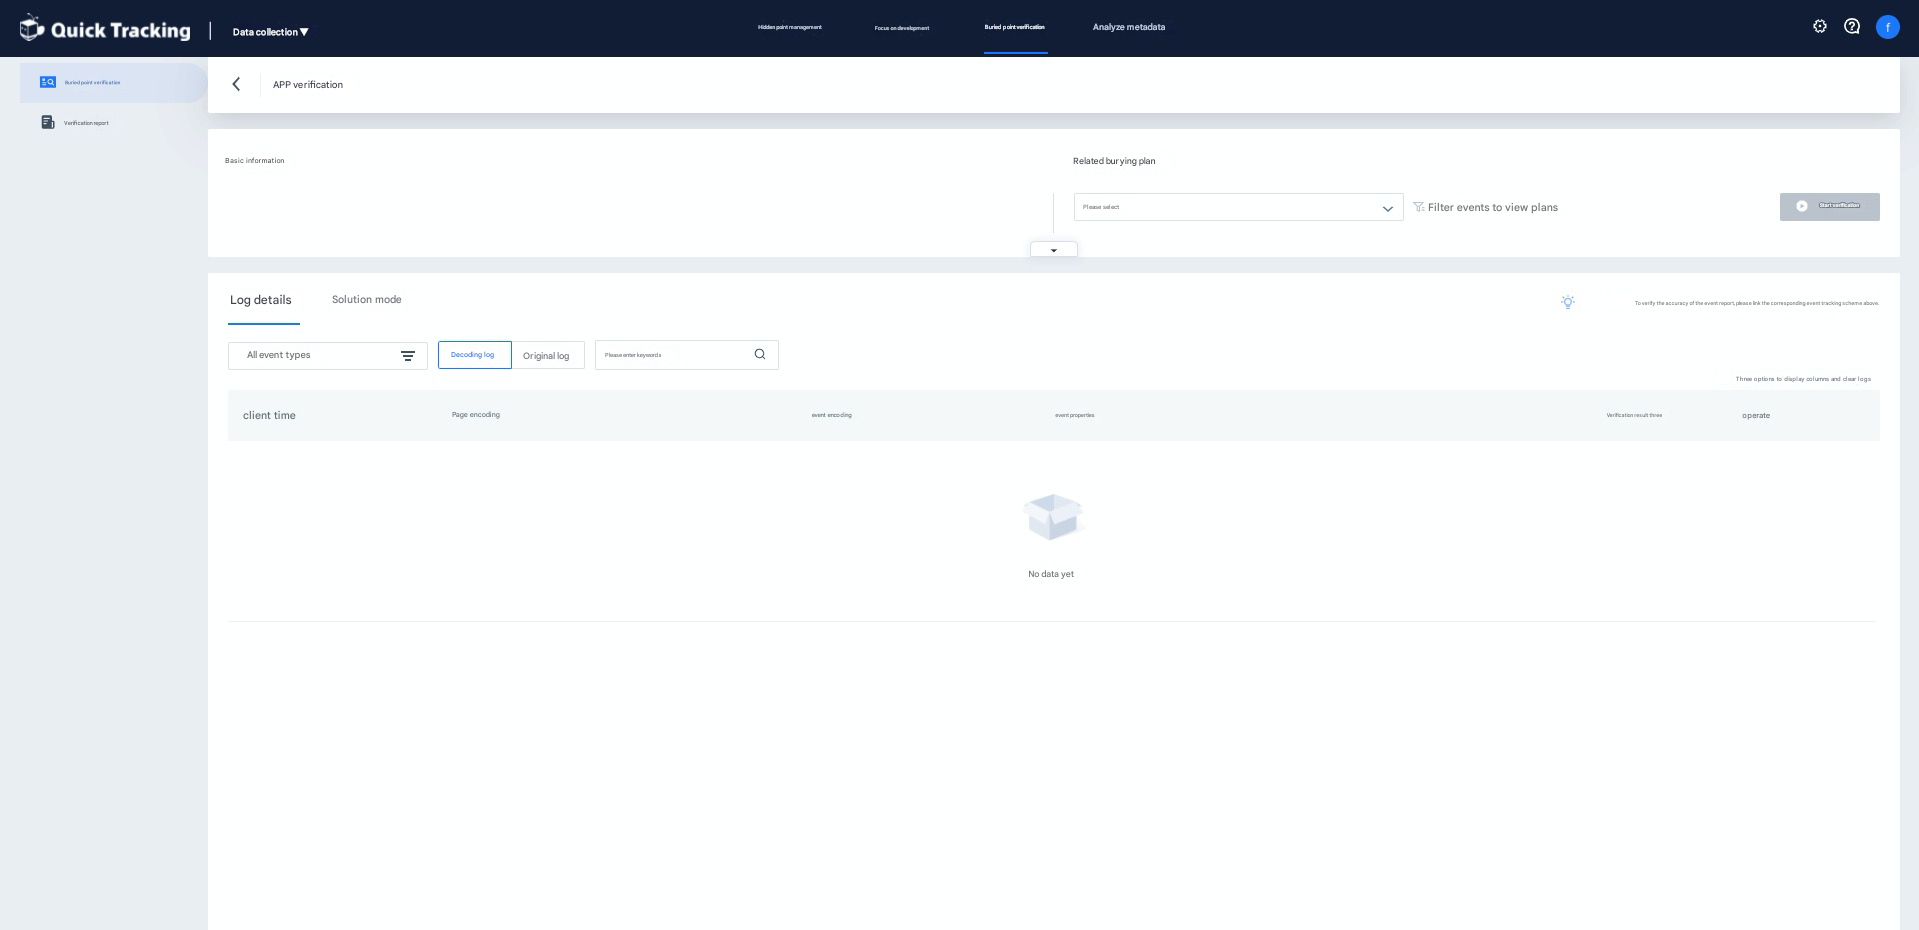
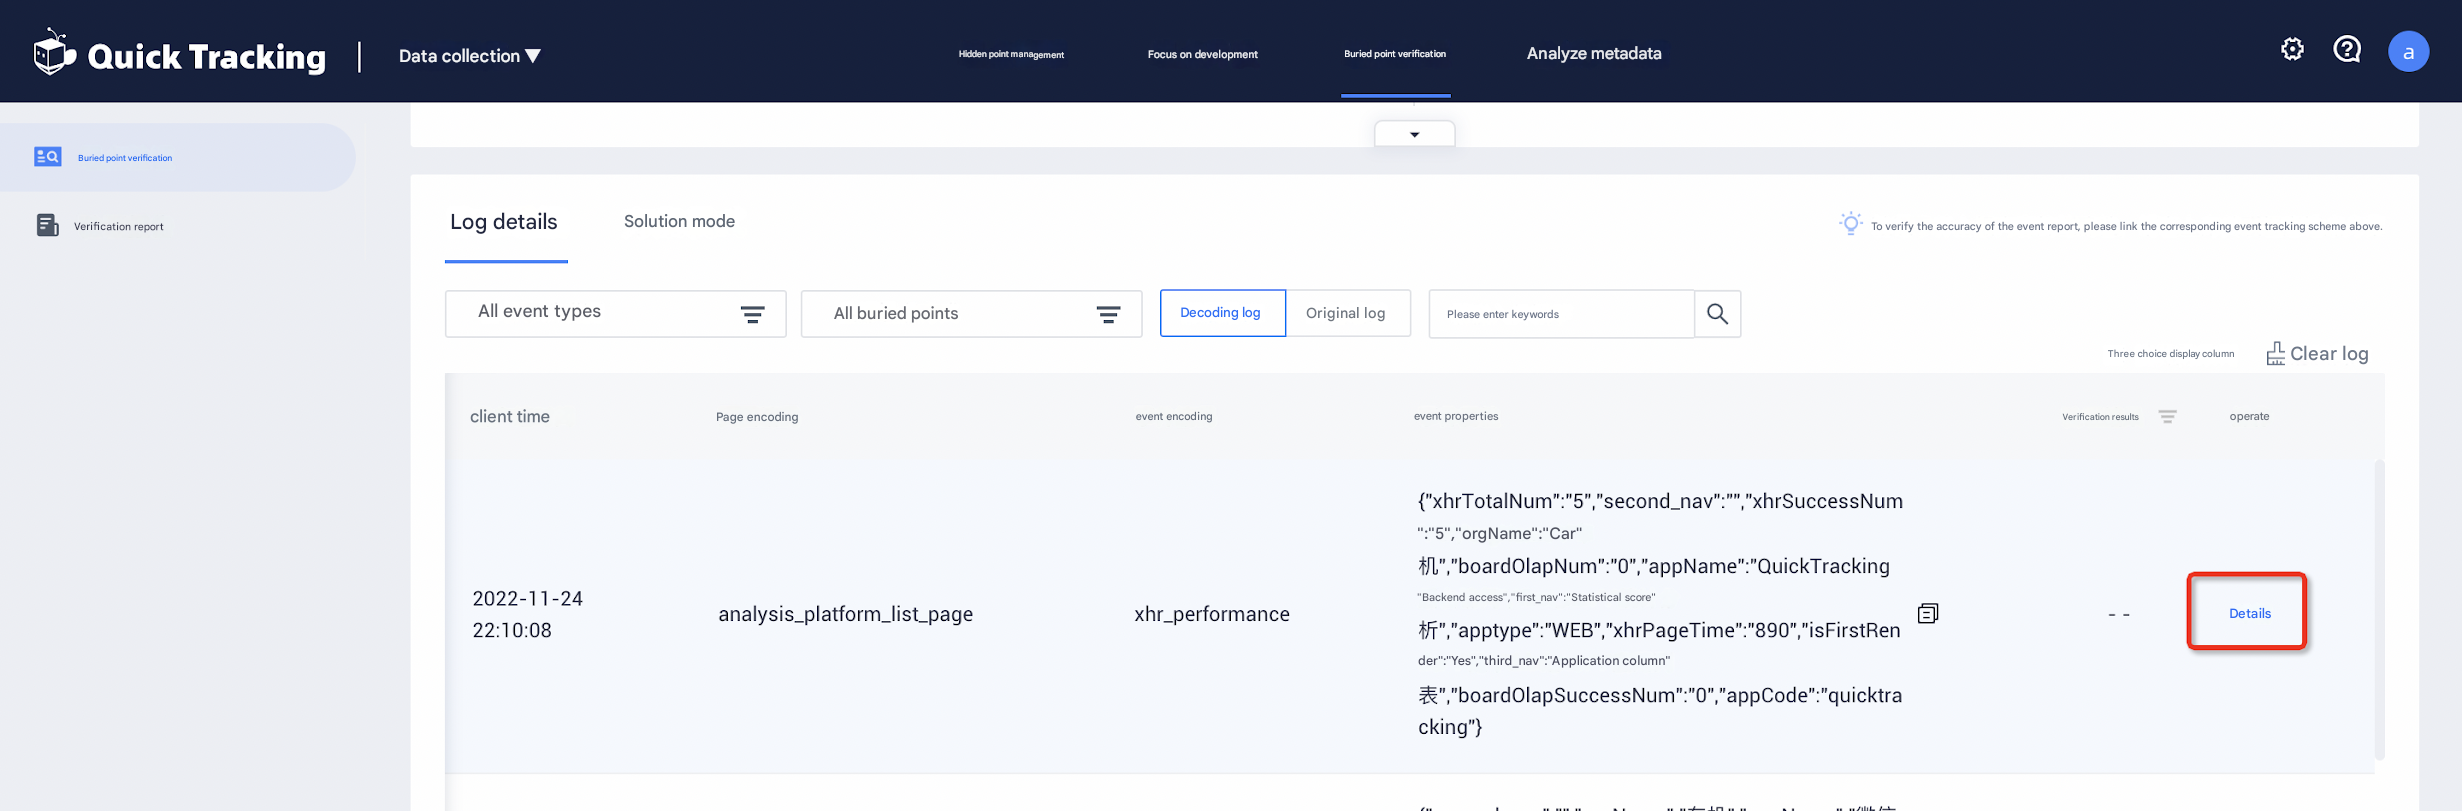
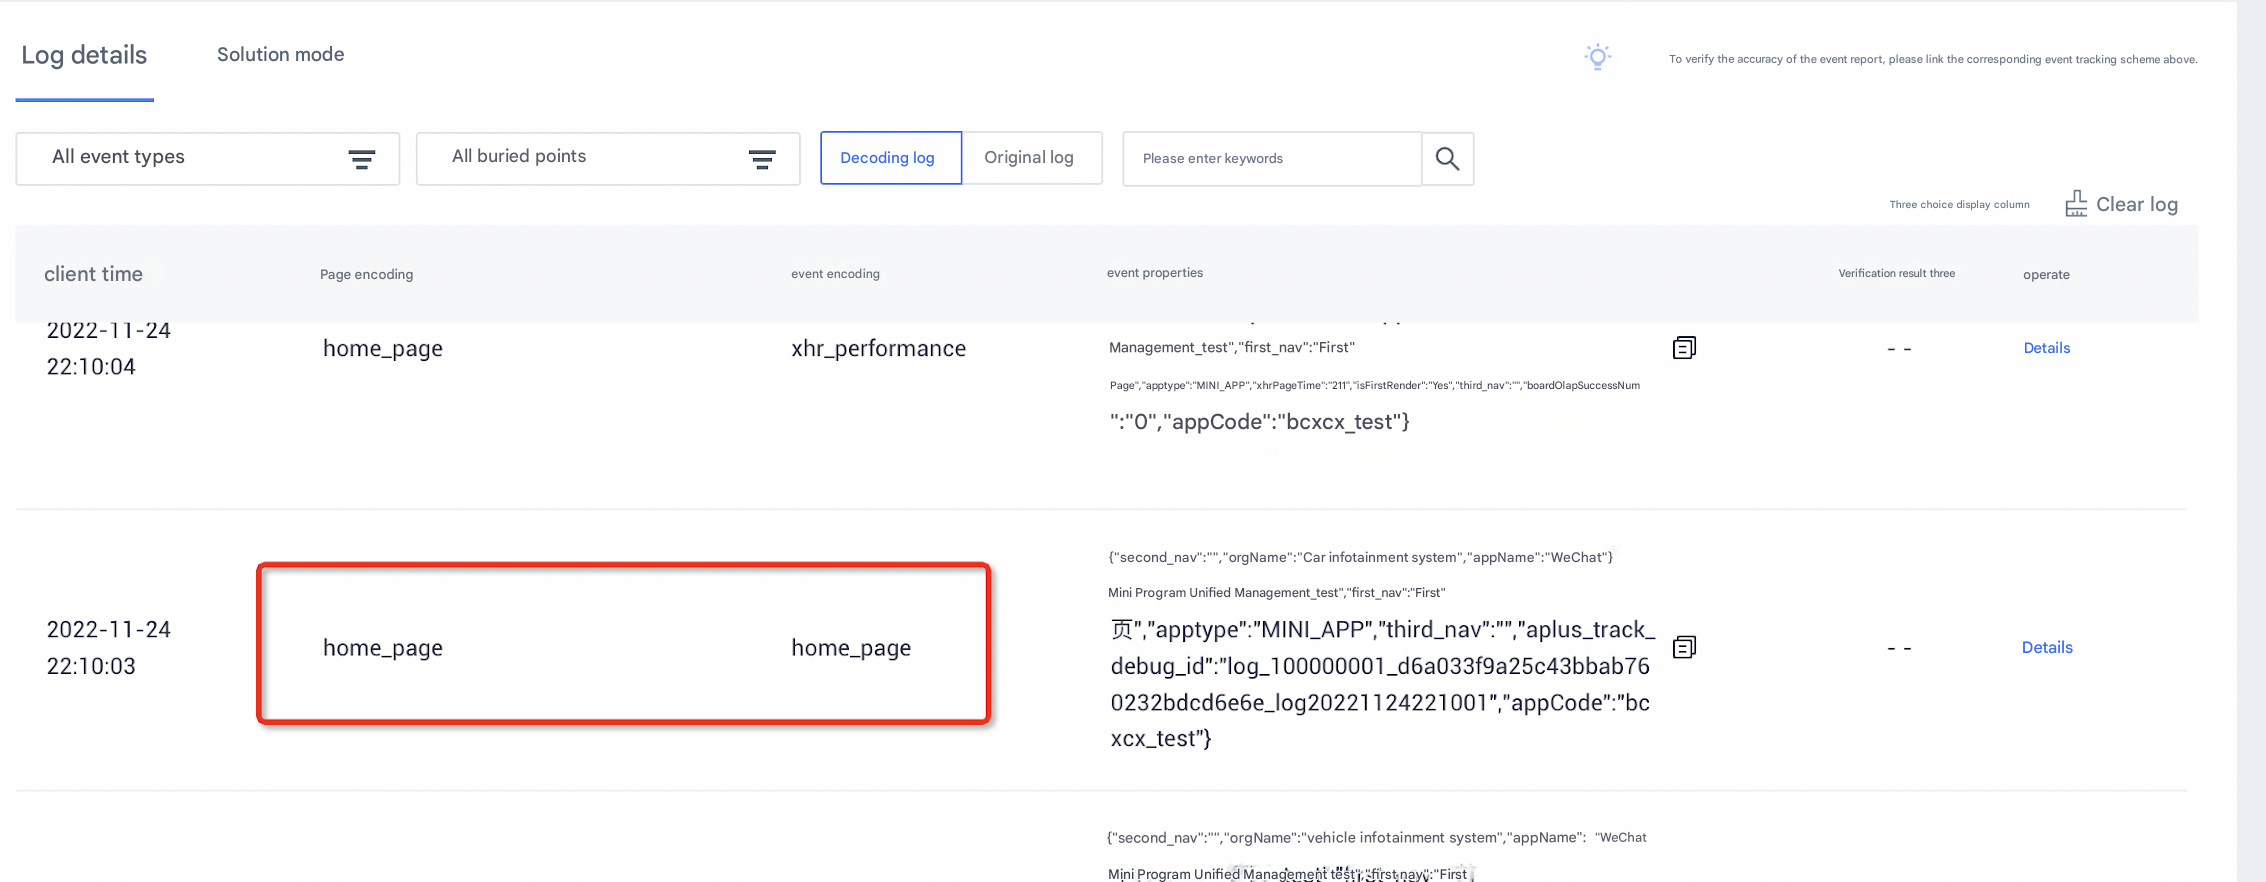
1.2.2 Log verification
Logs appear here when tracking is triggered on an app, mini program, or QT-generated web page. For details, see "2 Tracking Verification Contents".
2 Tracking Verification Contents
2.1 Tracking triggering reporting logs guide
The tracking plan is as follows:
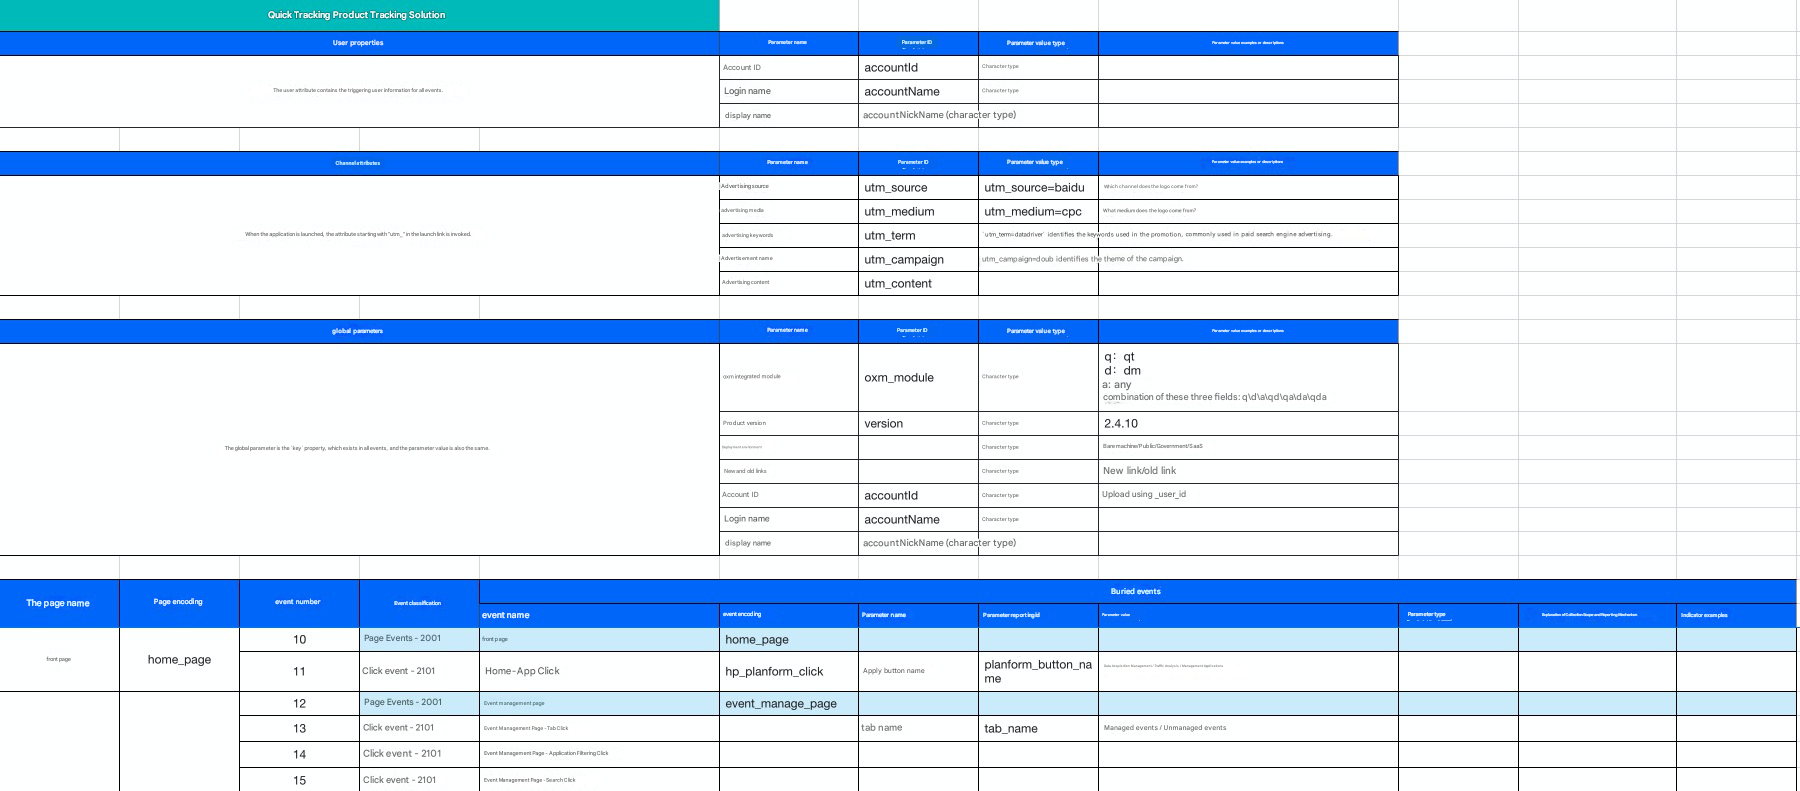
After the tracking is developed, the following log is triggered when the event type is Click, Expose, or Custom:
{
    User accounts;
    Device ID;
    System properties;
    Global attributes;
    Events:
    {
        Event coding;
        Event properties;
        The timestamp of the client.
        The page where it is located;
        Application usage duration; // Only the application exit event
    }
}
A log that triggers an event of the type "page browsing" is as follows:
{
    User accounts;
    Device ID;
    System properties;
    Global attributes;
    Events:
    {
        Event code="$$_ page_start" or "$$_ page_end"
        Event properties;
        The timestamp of the client.
        Page=Page Encoding
        Page access duration; // Only page exit events
    }
}
Reporting of user properties is reported using a log with an event type of "Custom" event:
{
    User accounts;
    Device ID;
    System properties;
    Global attributes;
    Events:
    {
        Event code =$$_ user_profile
        Event Attributes=User Attributes
        The timestamp of the client.
    }
}
2.2 User account&device ID verification 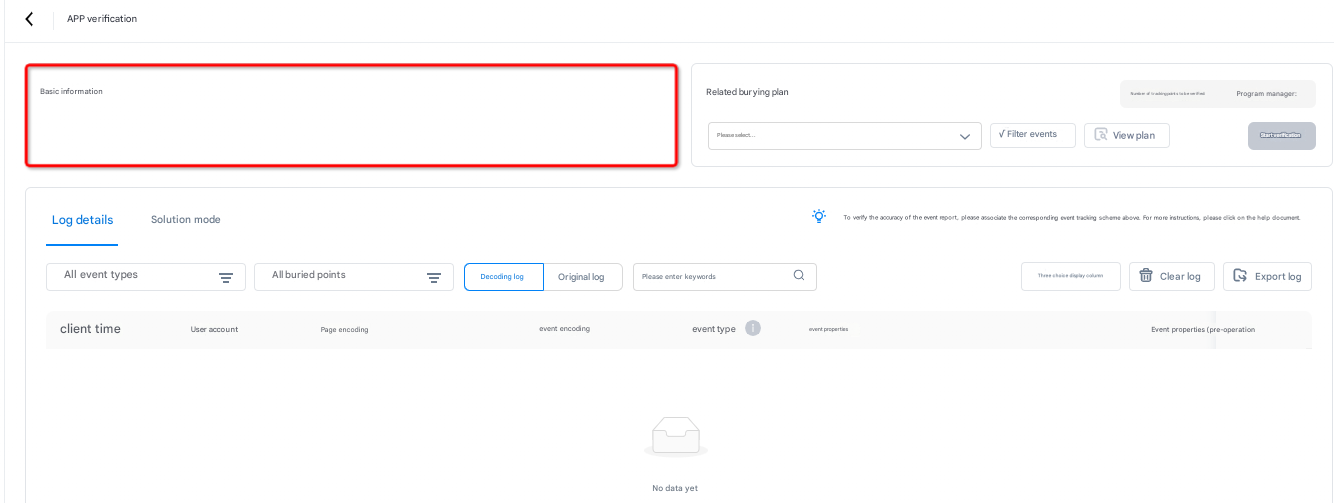
This section displays the user account and device ID carried in the log.
2.3 User Attribute verification 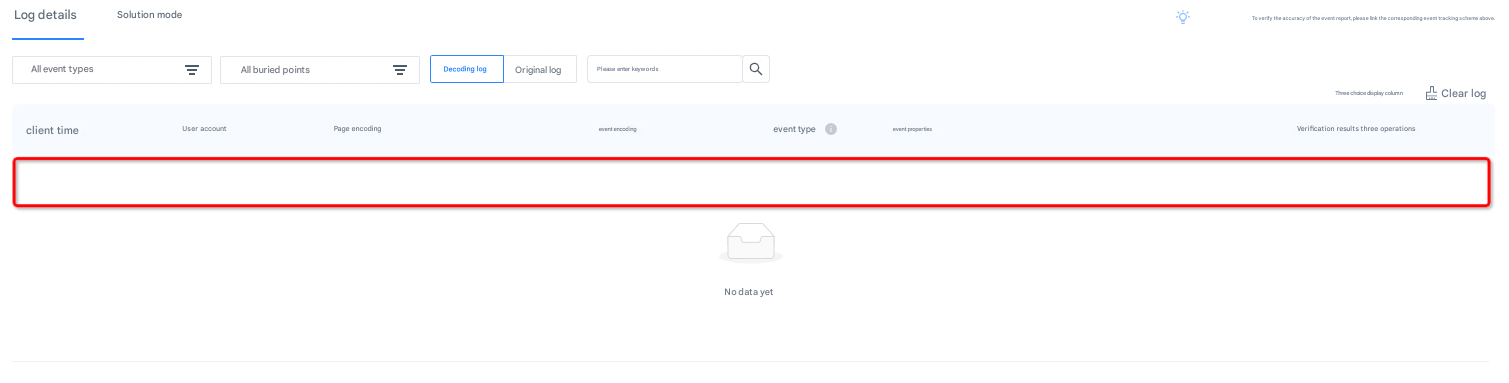
Reports an event with the event code "$$_ user_profile", where event attributes correspond to user attributes.
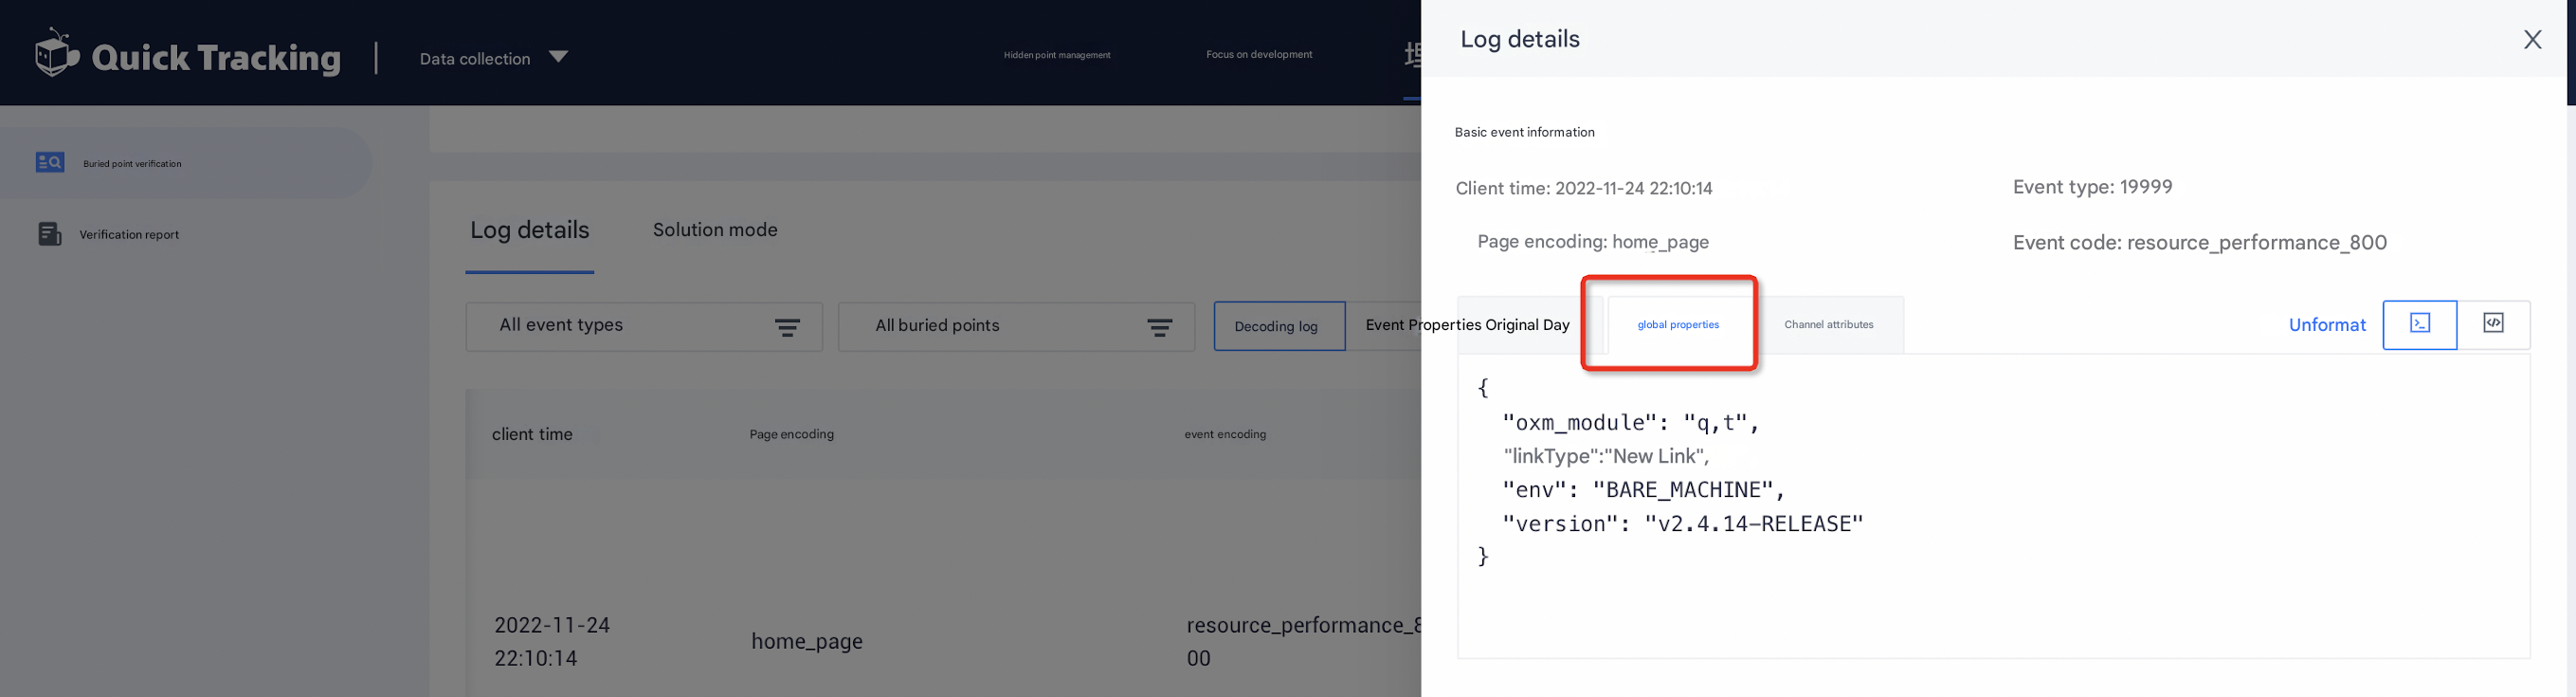
2.5 Global Attribute verification
Once set, global attributes are included in every event until the clear API is called.
2.5 Page Event verification
A page event occurs when the page encoding matches the event encoding defined in the tracking plan. Valid values: 1 to 9.
-
Page events on the app side are reported when the page exits.
-
If the page event of the mini program is automatically tracked, it is reported when the page exits. If it is a manual tracking point, it is reported when the page event is called.
-
The event codes for Web page events are reported when the page event is called.
2.6 Other Events verification
Verify that the event code matches the page code and tracking plan.
2.7 Out-of-box event verification
Preset events use fixed event codes. For details, see the preset event list.