Verify event instrumentation data and debug SDK integration issues in your iOS app before release.
1. Feature overview
The iOS SDK integration inspection plugin lets you verify event (instrumentation) data before publishing your application. It supports checking the SDK (Statistical Analysis SDK) integration status, viewing events in real time, inspecting debug logs, and monitoring network requests.
1.1 Import the SDK
1.1.1 Integration steps:
To use the SDK integration inspection plugin, first fully integrate the Statistical Analysis SDK. For details, see
Add the analytics SDK and its dependencies to your project’s Podfile:
// QuickTracking Statistical Analysis SDK
pod 'QTCommon', '1.6.4.PX' // Specify a version number. Versions 1.6.4.PX and later support the inspection plugin.

// Optionally add QTCommonLog from the "Base Libraries - Logstore" for development debugging.
pod 'QTCommonLog'

pod 'QTSDKMonitor'
1.1.2 Enable the inspection plugin
The SDK inspection plugin is disabled by default. Enable it by calling [QTConfigure setSDKMonitorEnable:YES]; before the initWithAppkey method. Example:
[QTConfigure setSDKMonitorEnable:YES];

// Explicitly call this function so the logging system works.
[UMCommonLogManager setUpUMCommonLogManager];
[QTConfigure setLogEnabled:YES]; // Enable logging.
[QTConfigure setCustomDomain:@"Your data collection service domain name" standbyDomain:nil]; // Set domain name.
[QTConfigure initWithAppkey:@"Your appkey" channel:@"App Store"];
2. Floating button
After completing integration, launch your app to access the following features.
2.1 Entry point
After launching the app, a floating button appears. Below the button, the total number of events generated since launch and the upload completion percentage (uploaded events ÷ total collected events) are displayed. Tap the floating button to open the panel.

2.1.1 Floating entry configuration
We recommend adding a new button on your app’s Debug page (or developer tools page) to show or hide the floating button. You can drag the floating button to reposition it.
#import <QTSDKMonitor/QTSDKMonitor.h>

// Show the floating button. Call this after initialization completes.
[QTSDKMonitorManager showToolEntry];
2.1.2 Manually show the panel
To hide the floating button, disable it as follows:
[QTSDKMonitorManager closeToolEntry];2.1.3 Show floating event list
The floating event list displays the names of the most recently collected events. It is disabled by default. Enable it in the sdkMonitor module (only effective when the floating entry is visible):
3. Panel sections
3.1 Event list
Search and filter module:
-
Filter events by keyword (supports Regex Match)
-
Event type
-
Upload status
-
Entry Status Search
You can sort events by time in ascending or descending order, manually pull metadata from Data Management, clear the search box, and view historical instrumentation searches.
Event list:
-
Event timestamp
-
Event type
-
Event status
Tap an event to view its details. Long-press an event to copy its content to the clipboard.

3.2 Console
The console is the central panel of the integration inspection plugin. It provides core debugging features, including log display for the Growth Statistical Analysis SDK, packet capture, event statistics, and basic configuration.

3.3 Integration bar
The integration bar shows your current SDK feature version, AppKey, and feature usage status.

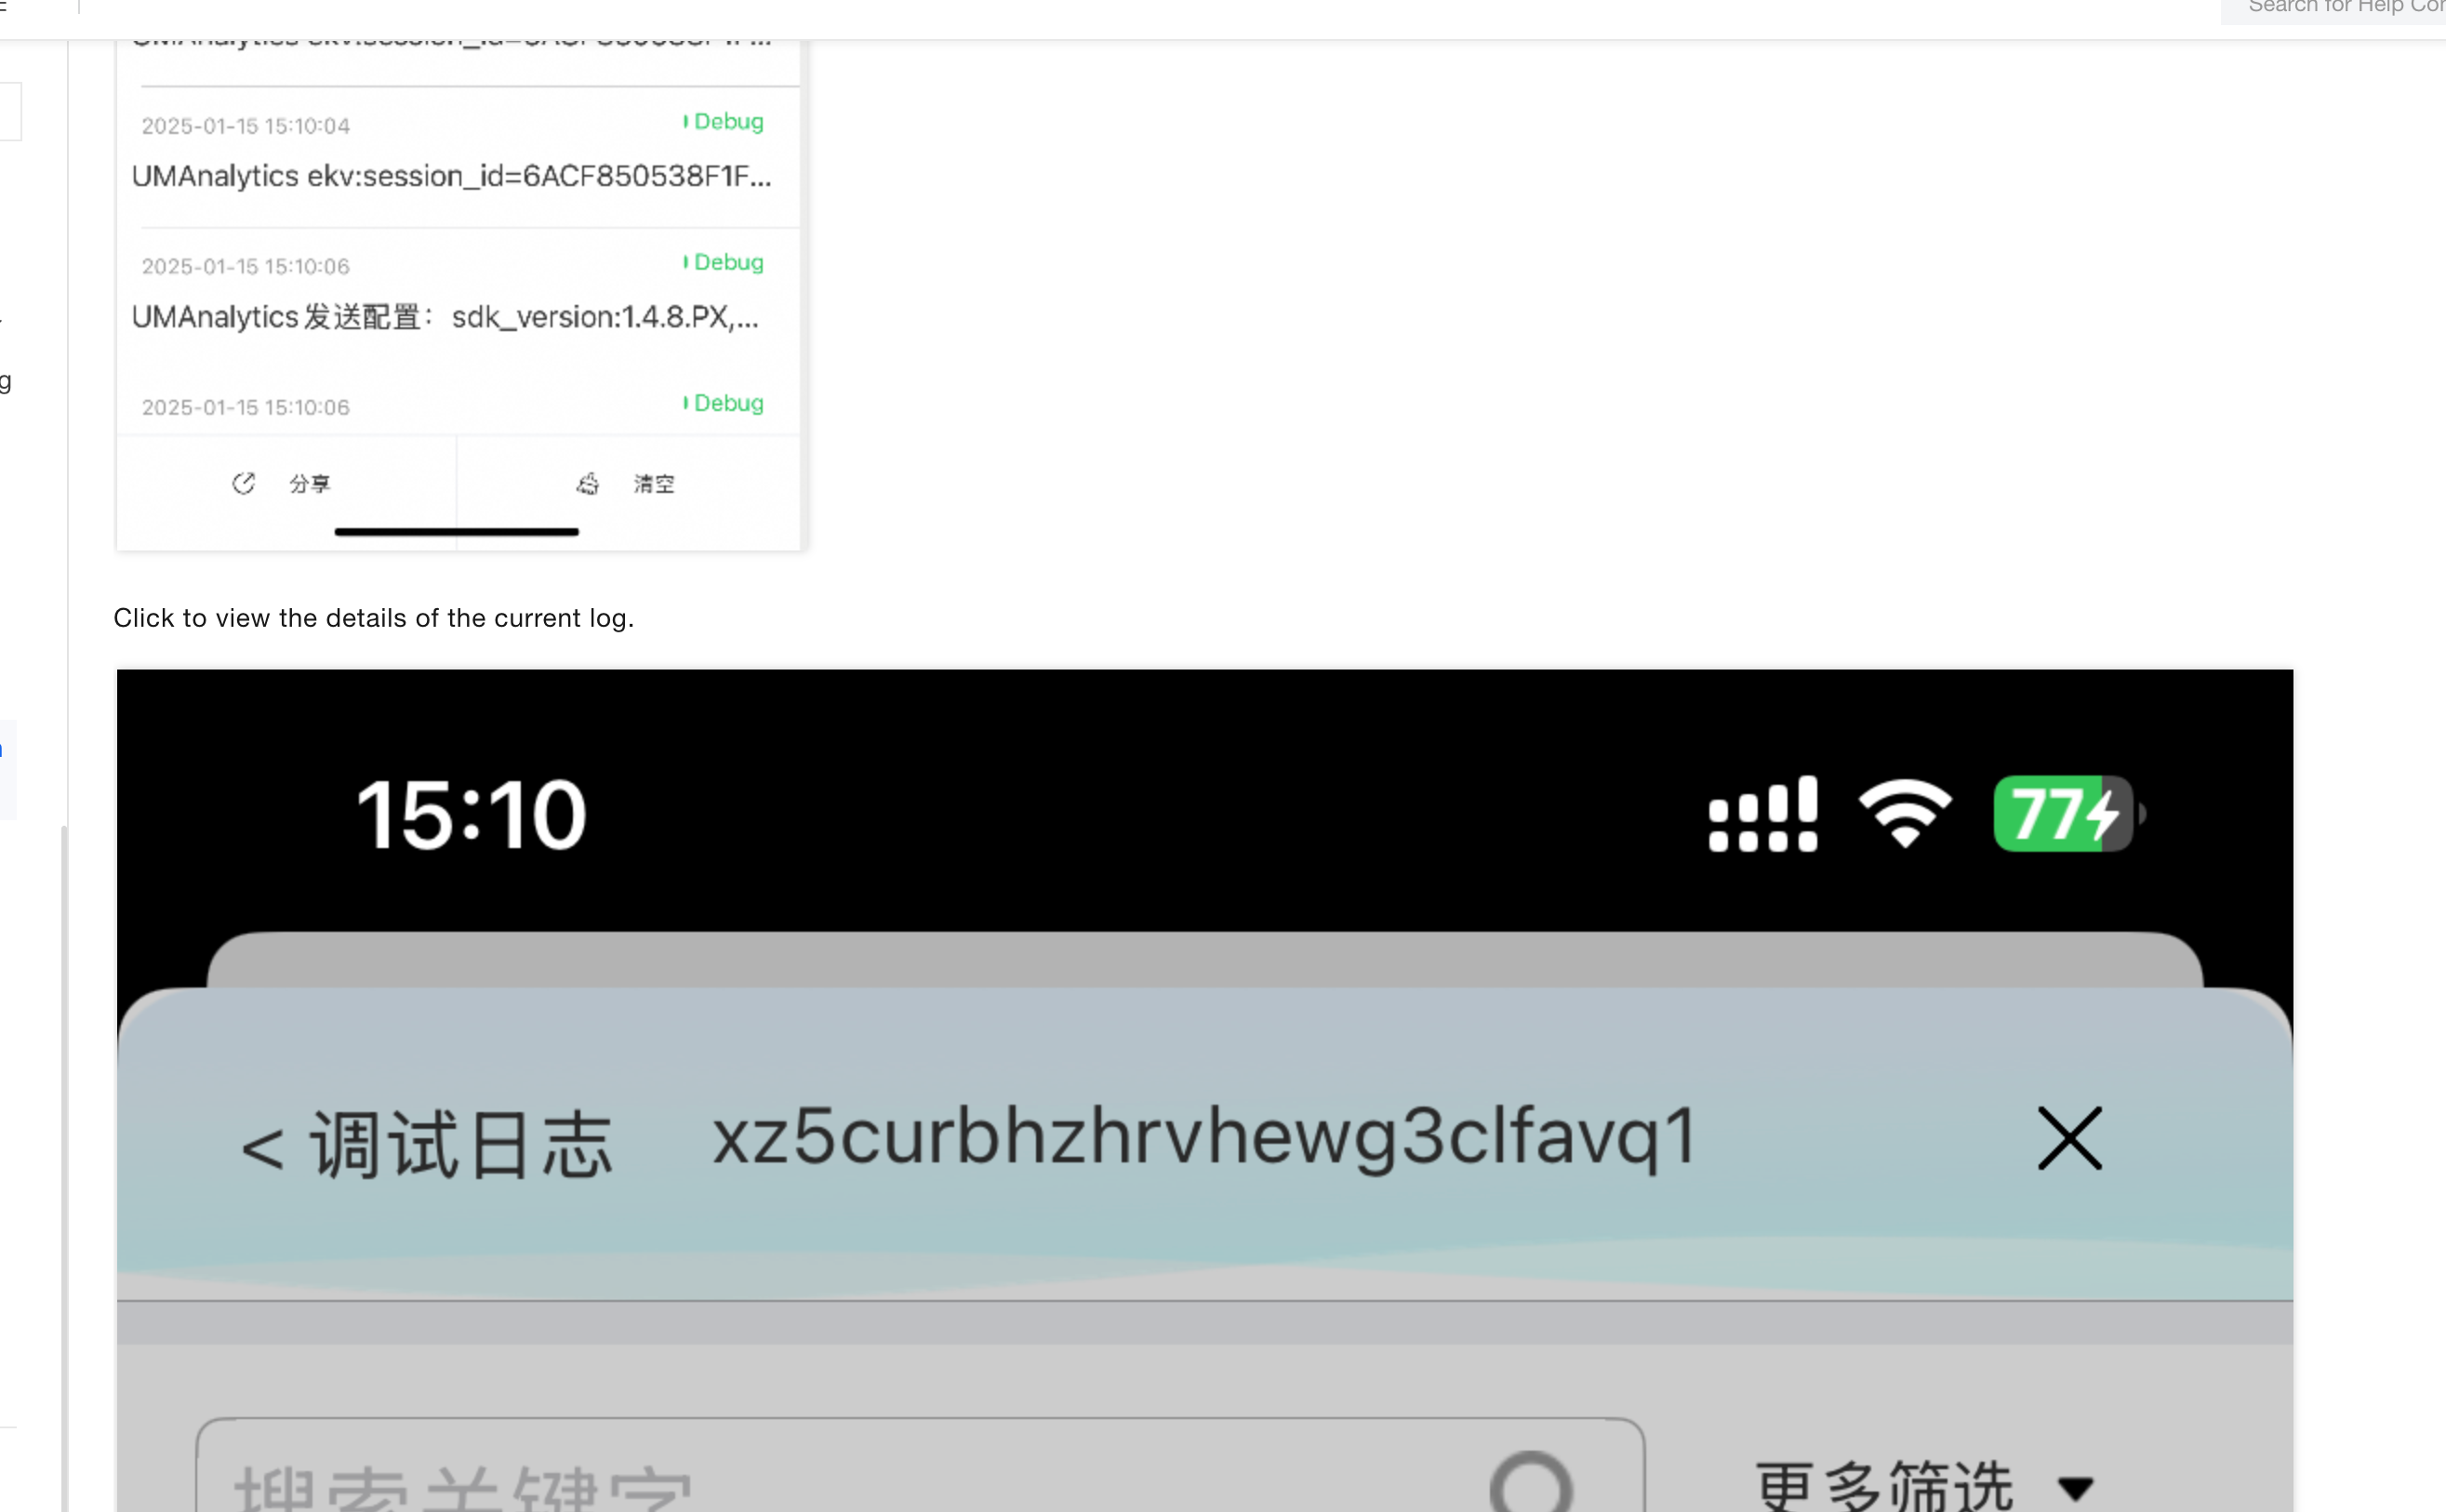
3.4 Debug logs
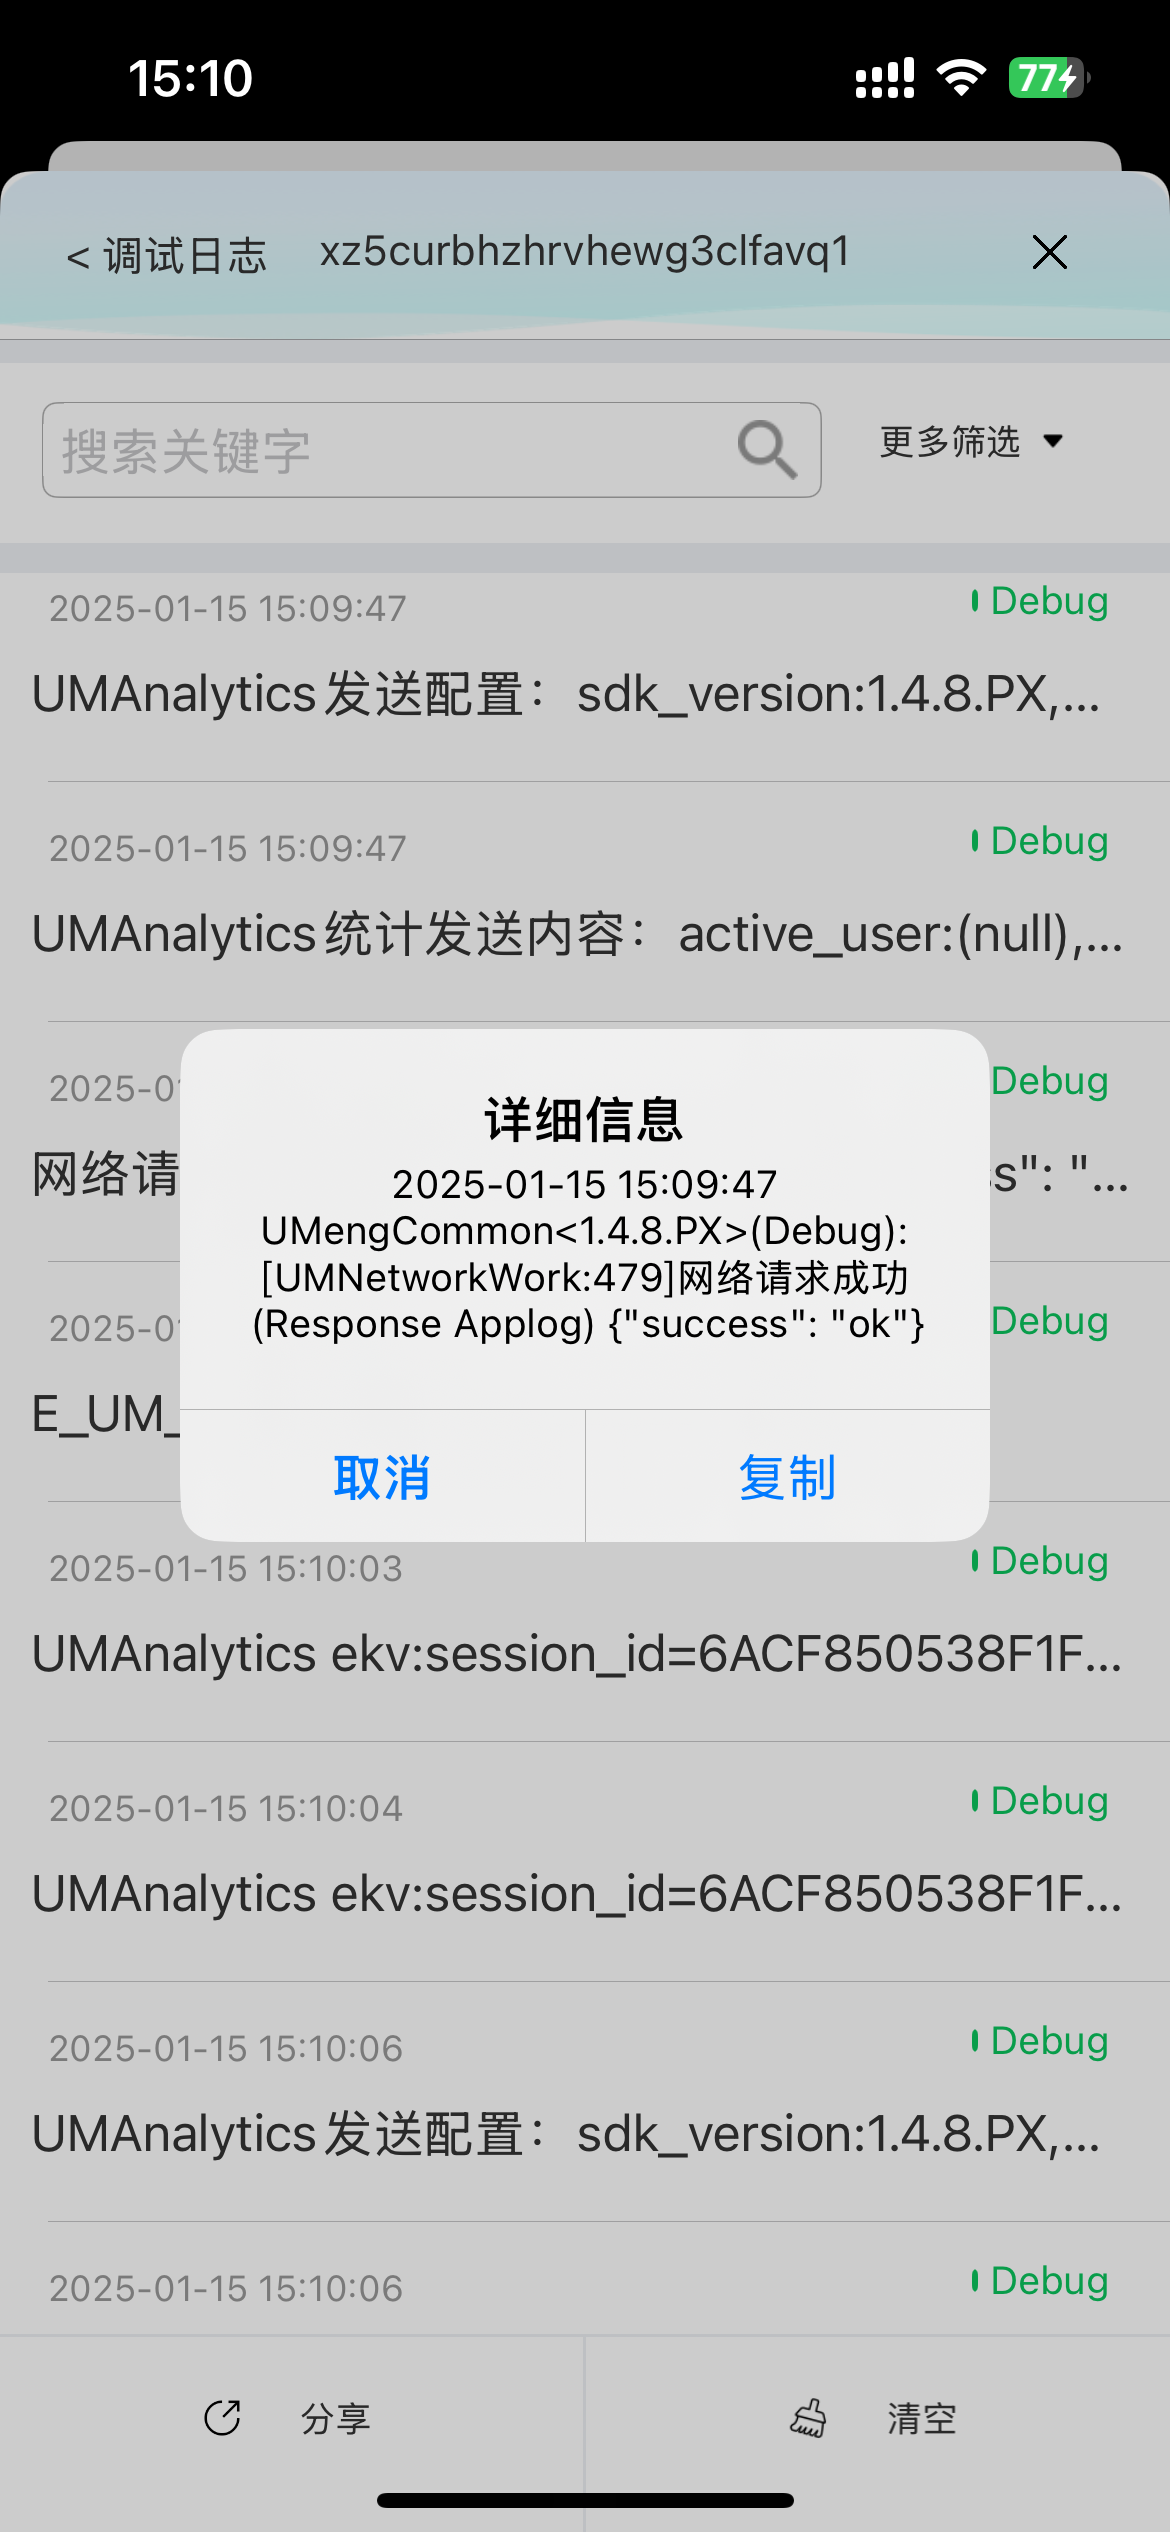
Tap “Debug logs” in the console to open the debug log page. Use error logs to quickly troubleshoot integration issues.

Tap a log entry to view its full details.
3.5 Packet capture
Packet capture prints detailed information about current uploads.

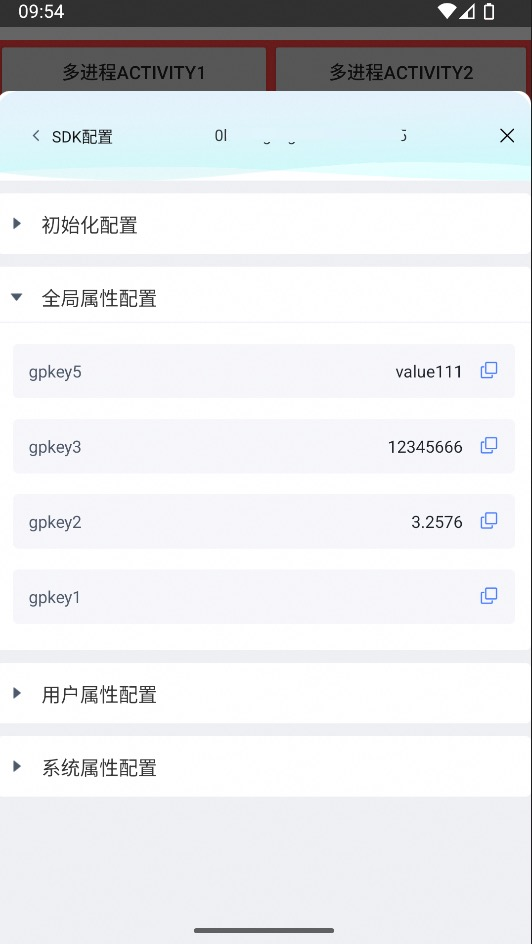
3.6 SDK configuration
The SDK configuration section shows your current settings.
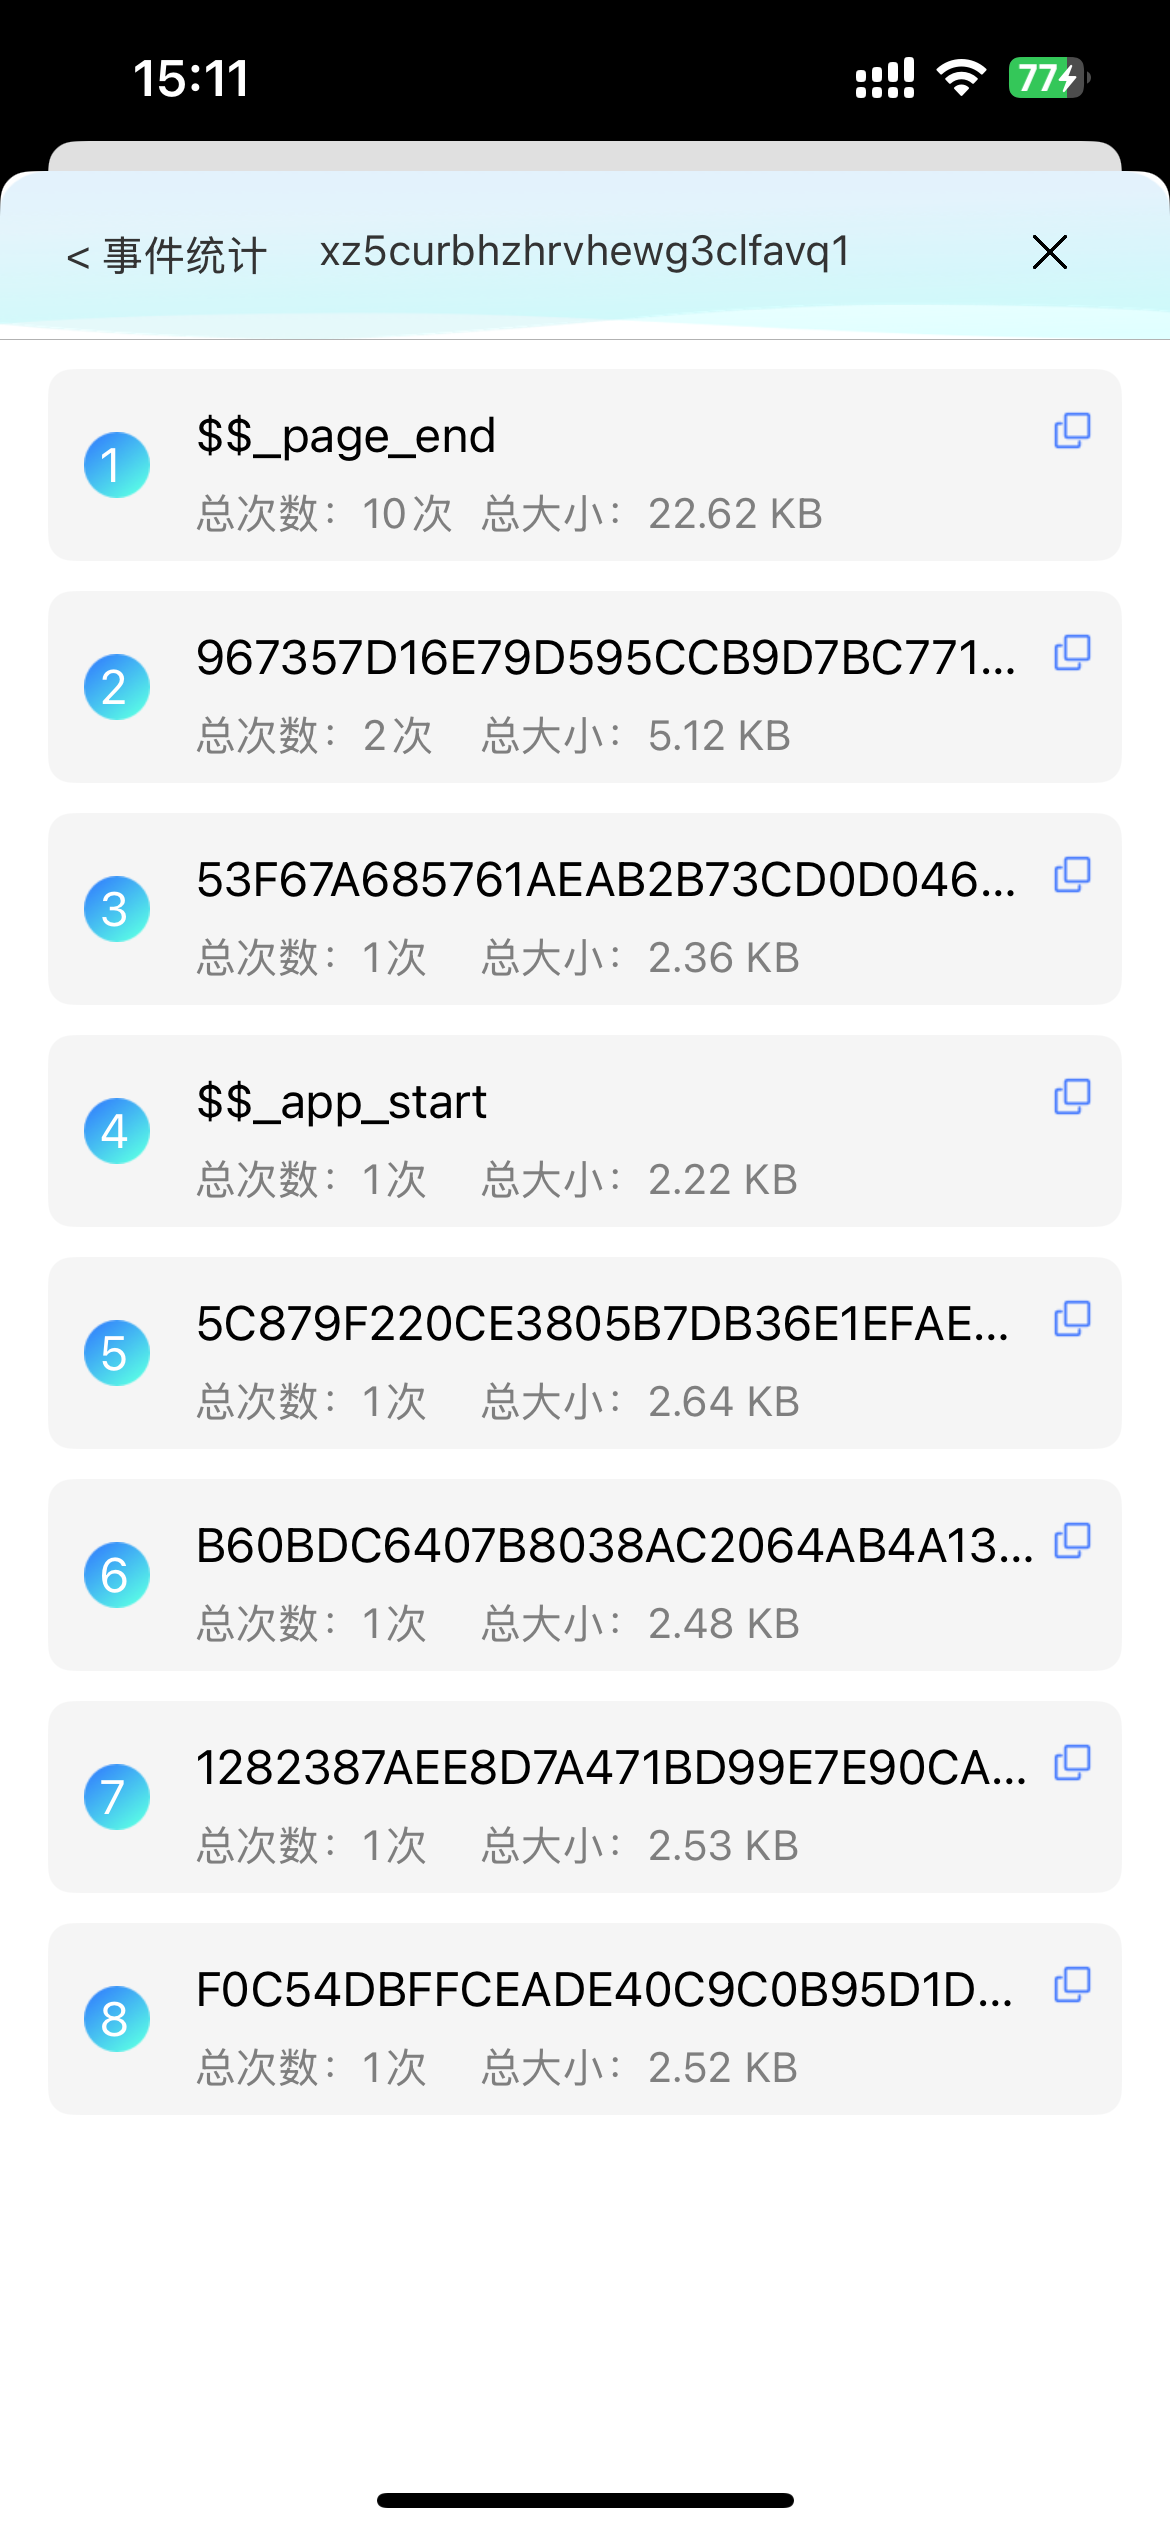
3.7 Event statistics
Event statistics groups and summarizes all current events.
3.8 SDKMonitor configuration
SDKMonitor configuration lets you adjust tool-related settings for the integration inspection plugin.
