Workbooks are designed for analysts and business users who are proficient in Excel, offering the same operations and effects as Excel. Workbooks can consolidate data from different sheets into a single table that contains various business summary metrics. Workbooks are only available in workspaces of Premium Edition and Professional Edition.
Limits
The workbook module is automatically available in Professional Edition.
For Premium Edition, the workbook module must be purchased separately.
Because Internet Explorer (IE) browser can no longer meet the functional requirements of the product, workbooks will no longer be specially adapted for IE browser starting from public cloud version 5.4.1. Thank you for your understanding and support.
Feature overview
To meet the visualization needs of enterprise customers, Quick BI not only provides a rich variety of chart components but also offers an efficient tool for creating Chinese-style reports - workbooks. Quick BI workbooks support free and complex report styles such as multi-level headers, merged headers, multi-level floating, grouping, diagonal headers, and multiple table bodies, allowing business users to easily create regulatory reports with complex formats and large amounts of information . You can create various types of tables including but not limited to business detail tables, grouped reports, cross-tabulation reports, master-detail reports, multi-column reports, query reports, and data entry reports, helping improve your efficiency in viewing and using data.
UI
Quick BI workbooks use an interaction similar to Excel online designer, which has a low learning curve and is quick to master. They support online import and export of Excel files, provide quick custom function calculation capabilities, support connections to multiple data sources, and offer free-form table capabilities. Through permission control of report editing, preview, and export, workbooks help you reduce report maintenance costs while ensuring data security.
The main interface of workbooks is divided into three functional areas: ① toolbar, ② design area, and ③ data panel. 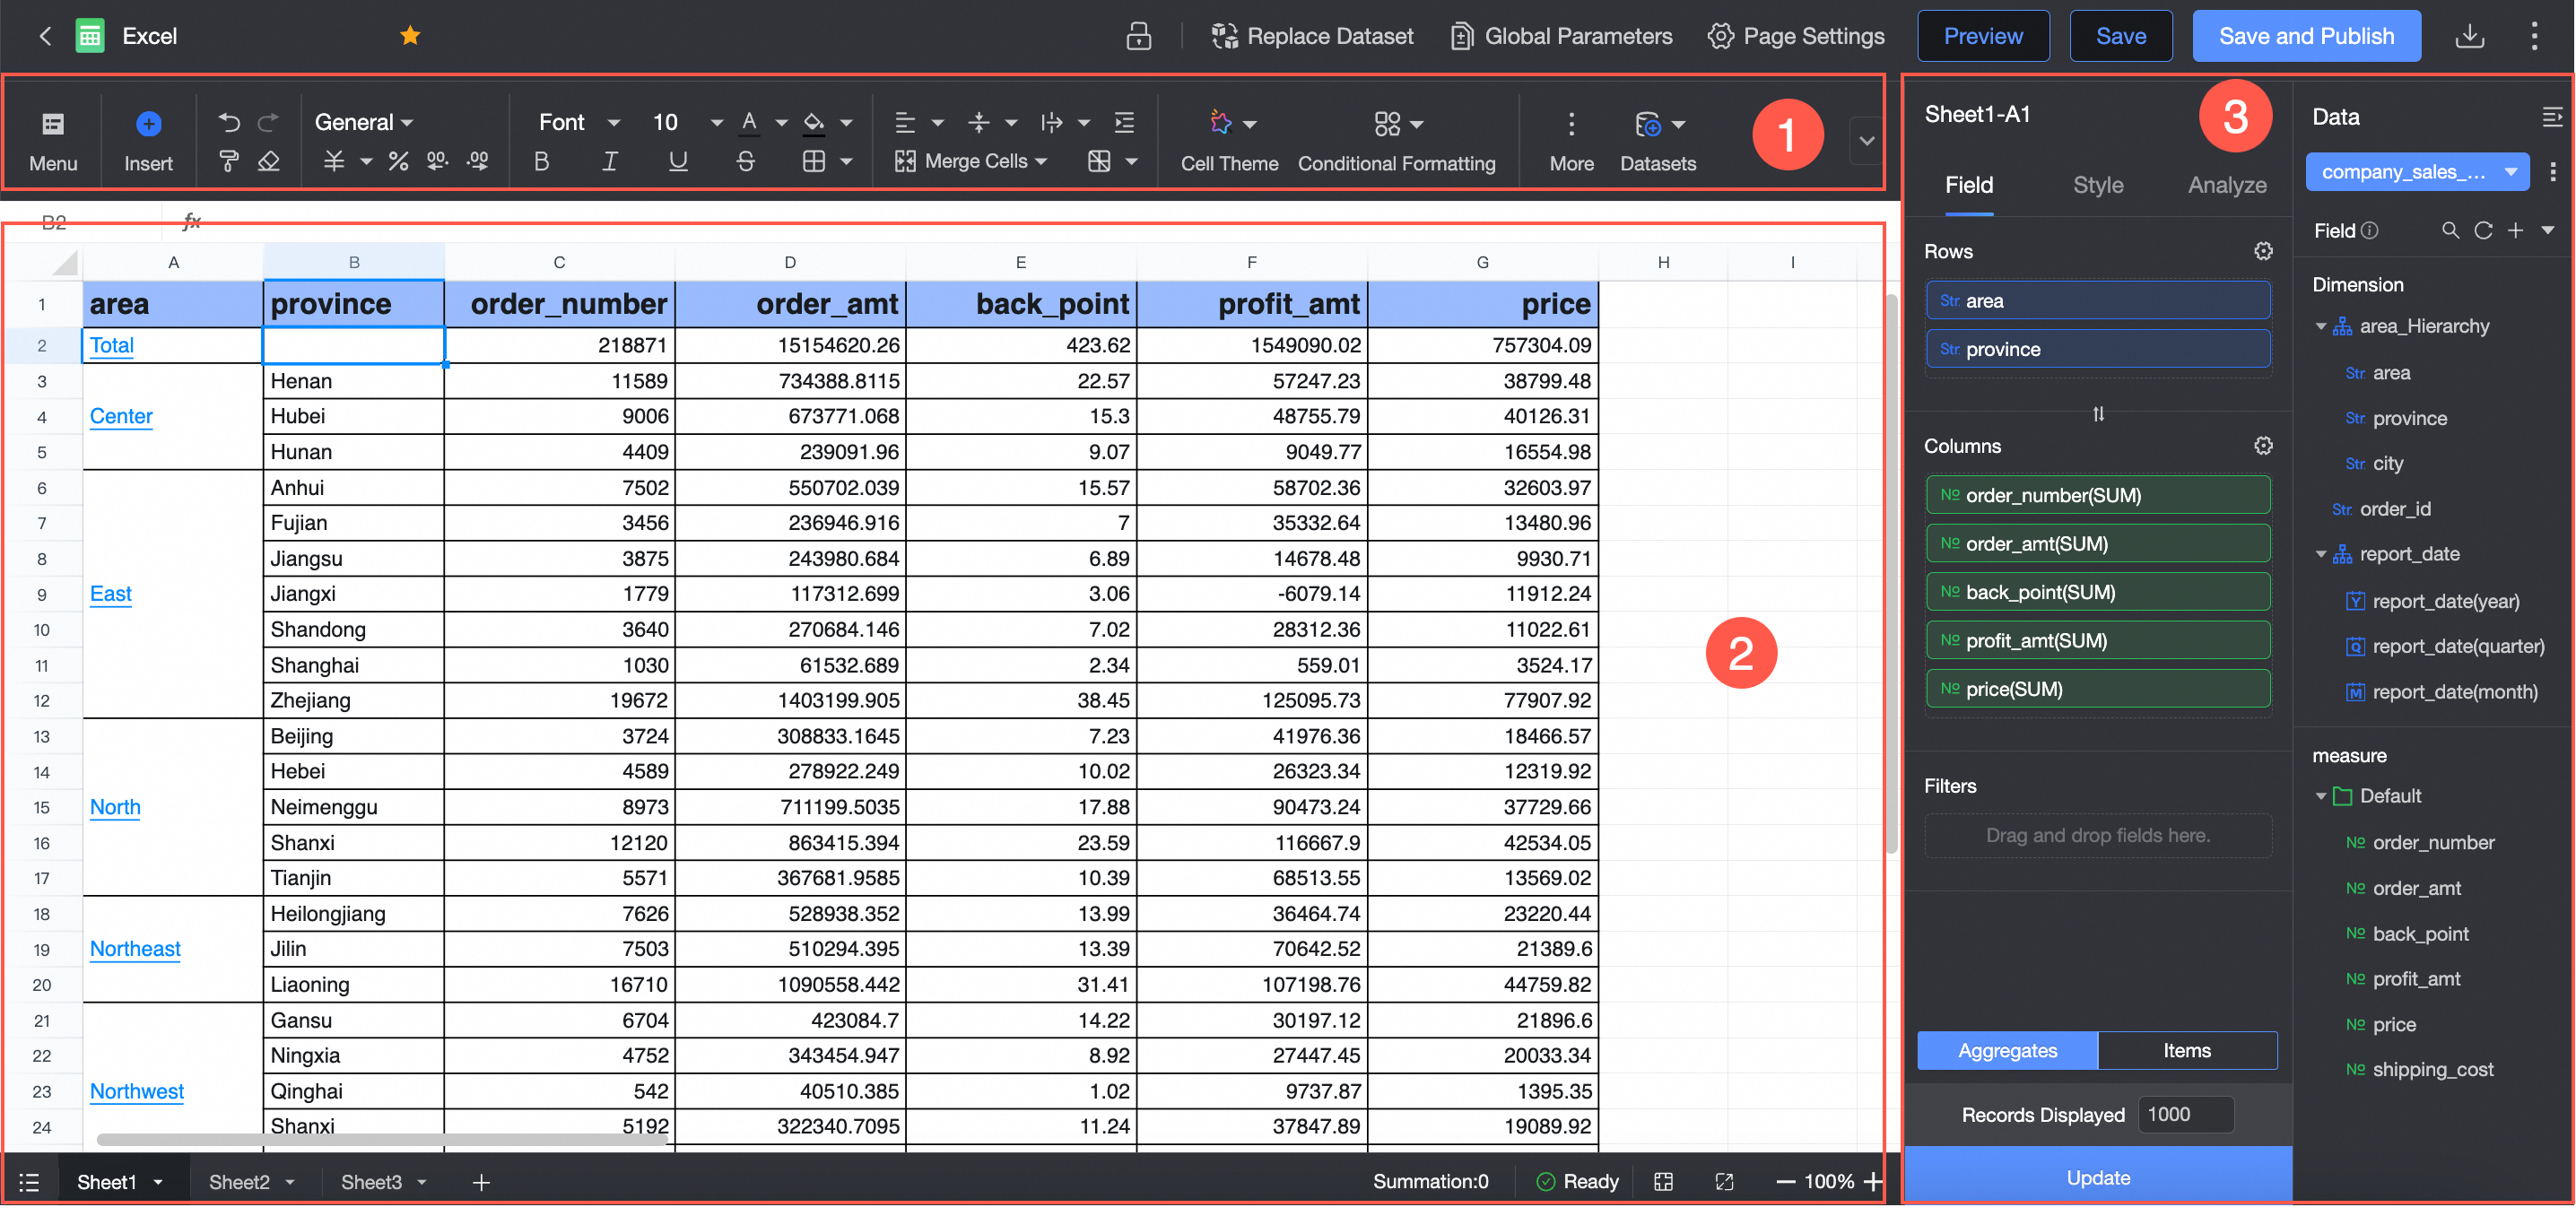
As shown in the figure above:
① Toolbar: Select the data chart you want to create and set various operations such as file, edit, format, data, view, and query controls based on display requirements.
② Design area: Display and reference data according to cells to complete data reprocessing.
③ Data panel: Supports switching between existing datasets. The data types of each dataset are listed in the dimension and measure lists according to the system's preset. You can select the required dimension and measure fields from the list based on the data elements provided by the data chart.