The multi-field combination feature lets you create a new calculated field based on multiple fields and a custom formula. This feature is primarily used in the following two scenarios.
Recalculate advanced calculated fields: Perform addition, subtraction, multiplication, or division on two or more fields that already have advanced calculations applied, such as cumulative value or year-over-year comparisons. For a detailed example, see Example 1: Cumulative profit margin.
Calculate across datasets: When using a dataset combination in a chart, you can reference fields from different datasets in the formula. For a detailed example, see Example 2: Target completion rate.
This topic describes how to configure a multi-field combination.
Prerequisites
You have created a dashboard. For more information, see Create a dashboard.
You have selected a target dataset and configured the chart fields. For more information, see Configure chart fields.
Limitations
Multi-field combination is supported for the following chart types.
Chart type | Chart name |
Tables | Cross table, details table, heatmap. |
Metrics | Metric card, metric trend chart. |
Line/Area charts | Line chart, area chart, stacked chart, 100% stacked area chart, combination chart. |
Column/Bar charts | Column chart, stacked column chart, 100% stacked column chart, radial column chart, leaderboard, bar chart, stacked bar chart, 100% stacked bar chart, waterfall chart, bullet chart, box plot. |
Pie/Doughnut charts | Pie chart, rose chart, sunburst chart, radar chart, treemap chart. |
Bubble/Scatter charts | Bubble chart, scatter chart, faceted scatter plot. |
Funnel/Conversion charts | Funnel chart, comparison funnel chart. |
Geographic maps | Colored map, bubble map, heat map, building heat map, fly line map, symbol map. |
Others | Word cloud chart. |
Configuration
In the chart's Fields panel, locate the measure that you want to use for the multi-field combination. Click the  icon next to it and select Advanced Calculation > Combine multiple fields to open the Combine multiple fields dialog box. The current measure is added to the formula by default. You can configure the settings as needed.
Configuration | Description | |
Multi-field combination area | Operators | Select the operators for your formula. Supported operators include addition (+), subtraction (-), multiplication (×), division (÷), and parentheses (()). |
Add field | Click the | |
Clear content | Click the Note
| |
Single-field configuration area | Aggregation method | Click a field in the panel to select it, and then configure its aggregation method. |
Advanced Calculation | Click a field in the panel to select it, and then configure its advanced calculation method. | |
 icon and select a field for the calculation from the drop-down list. You can select other fields from the same dataset. If you are using a
 Examples
The following examples use a cross table to show you how to use the multi-field combination feature.
Example 1: Cumulative profit margin
Scenario: A sales manager needs to view the cumulative profit margin for each region for the current month-to-date (for example, as of January 28, 2024) to assess the profitability of each region.
Formula: Cumulative profit margin = Cumulative profit amount / Cumulative order amount
Based on this information, you first need to use Date Accumulation > Accumulate by Month to obtain the monthly cumulative profit amount and monthly cumulative order amount for each region. Then, you can divide the monthly cumulative profit by the monthly cumulative order amount to obtain the cumulative profit margin. The following steps describe the detailed configuration.
Configure the cross table data: In the dashboard editor, add a blank cross table and configure its data as described below.
On the Fields tab of the cross table's data panel, configure the fields for the cross table.
In the Dimensions list, locate Region and double-click it or drag it to the Rows area.
In the Measures list, locate Order amount and Profit amount, and double-click them or drag them to the Columns area. You need to drag two Profit amount fields.
NoteOf the two Profit amount fields in the Columns area, one is for calculating the monthly cumulative data, and the other is for configuring the multi-field combination.
If you place two identical fields in the Measures area, a "Duplicate measures exist" message appears. Do not update the data yet. Wait until the configuration is complete.
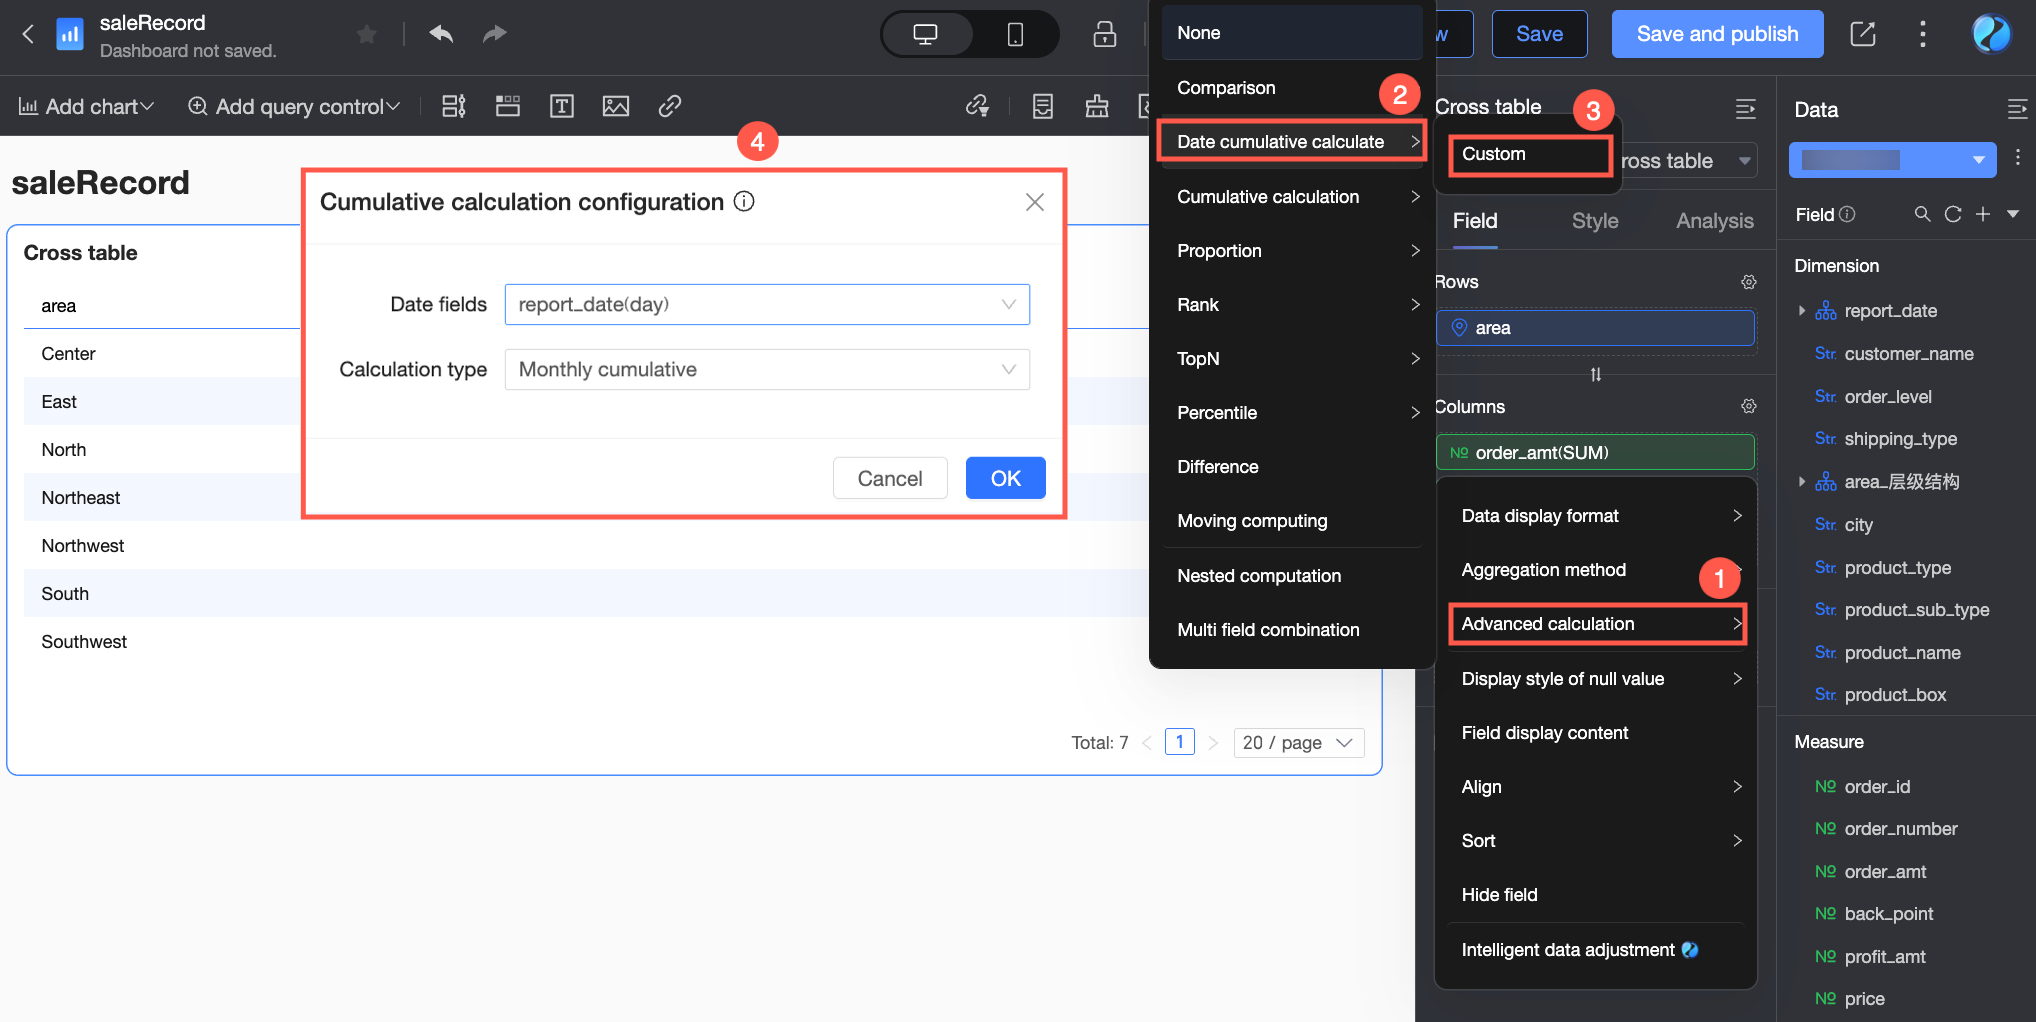
Apply the Accumulate by Month calculation to the Order amount and Profit amount fields as shown in the figure below. This action displays the cumulative order amount and cumulative profit amount by month in the chart. For more information about date accumulation, see Date accumulation.
Configure the date query control: Add a date query control with day-level granularity to filter data by date.
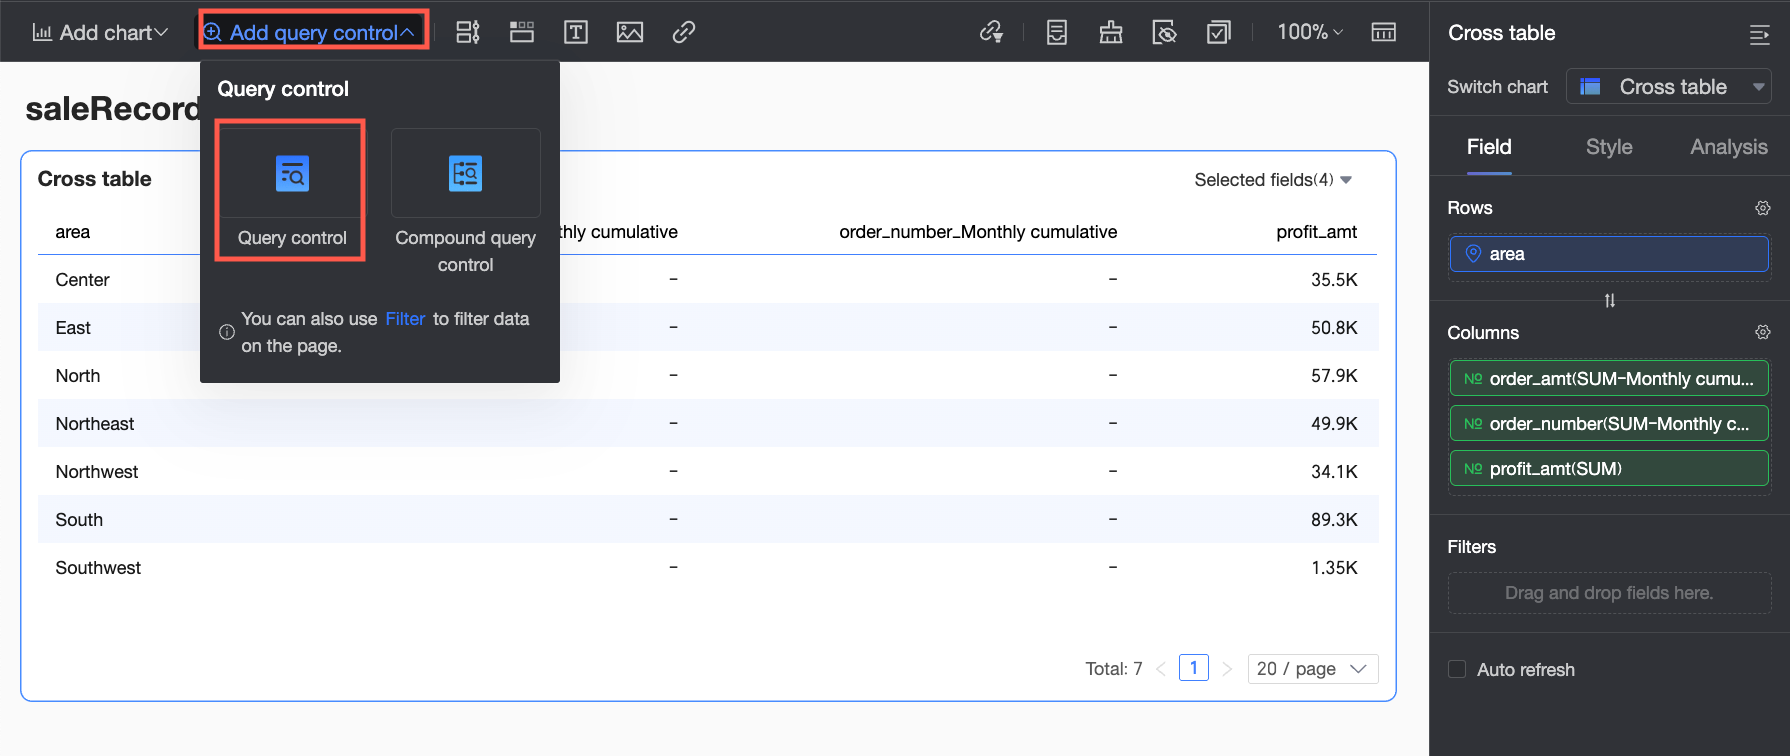
Click Add Query Control in the toolbar and select Query Control from the drop-down menu.
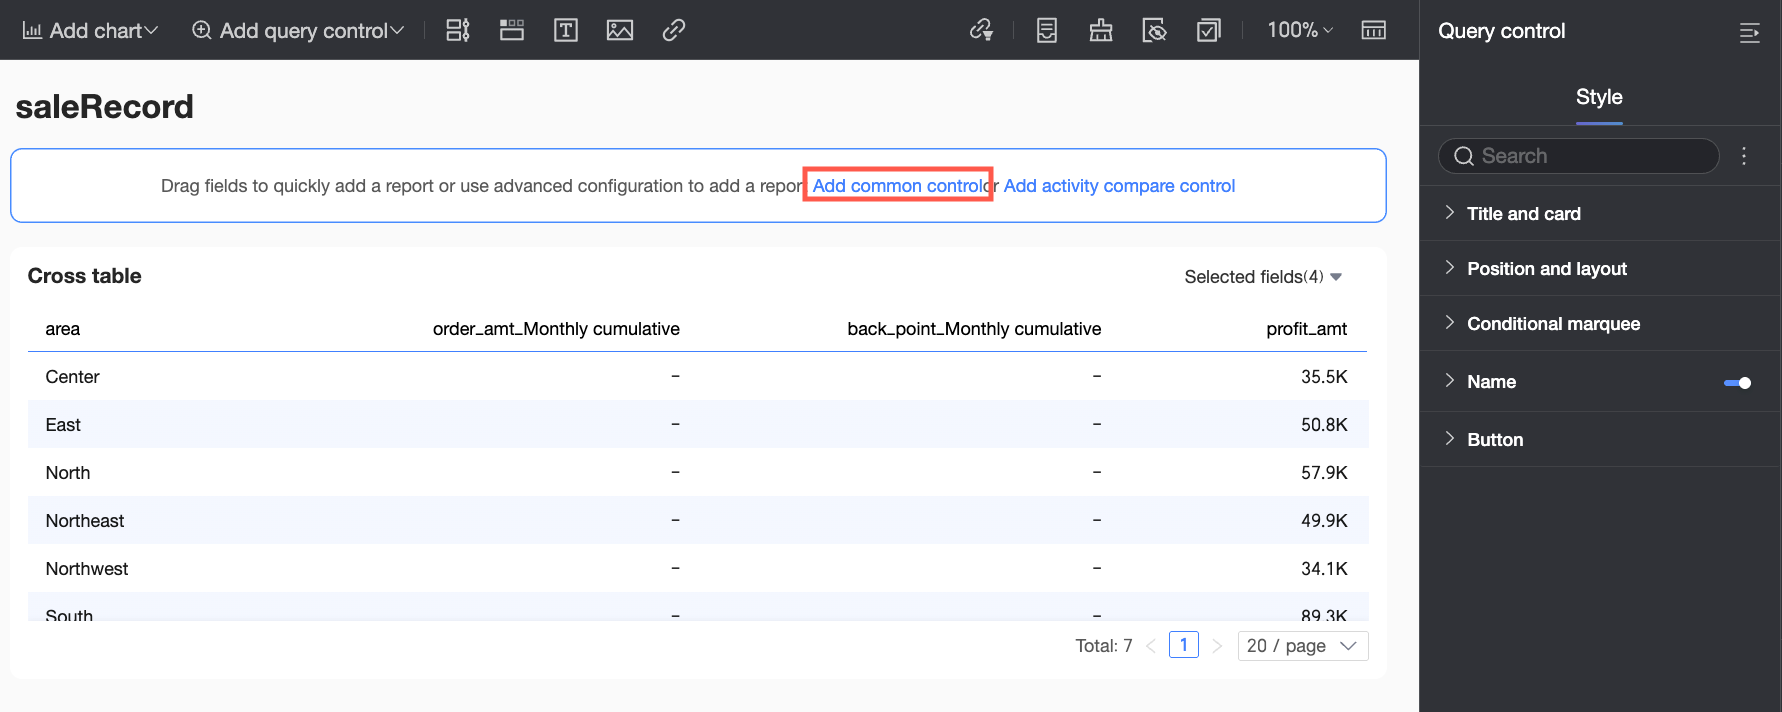
Click Add General Query Control.
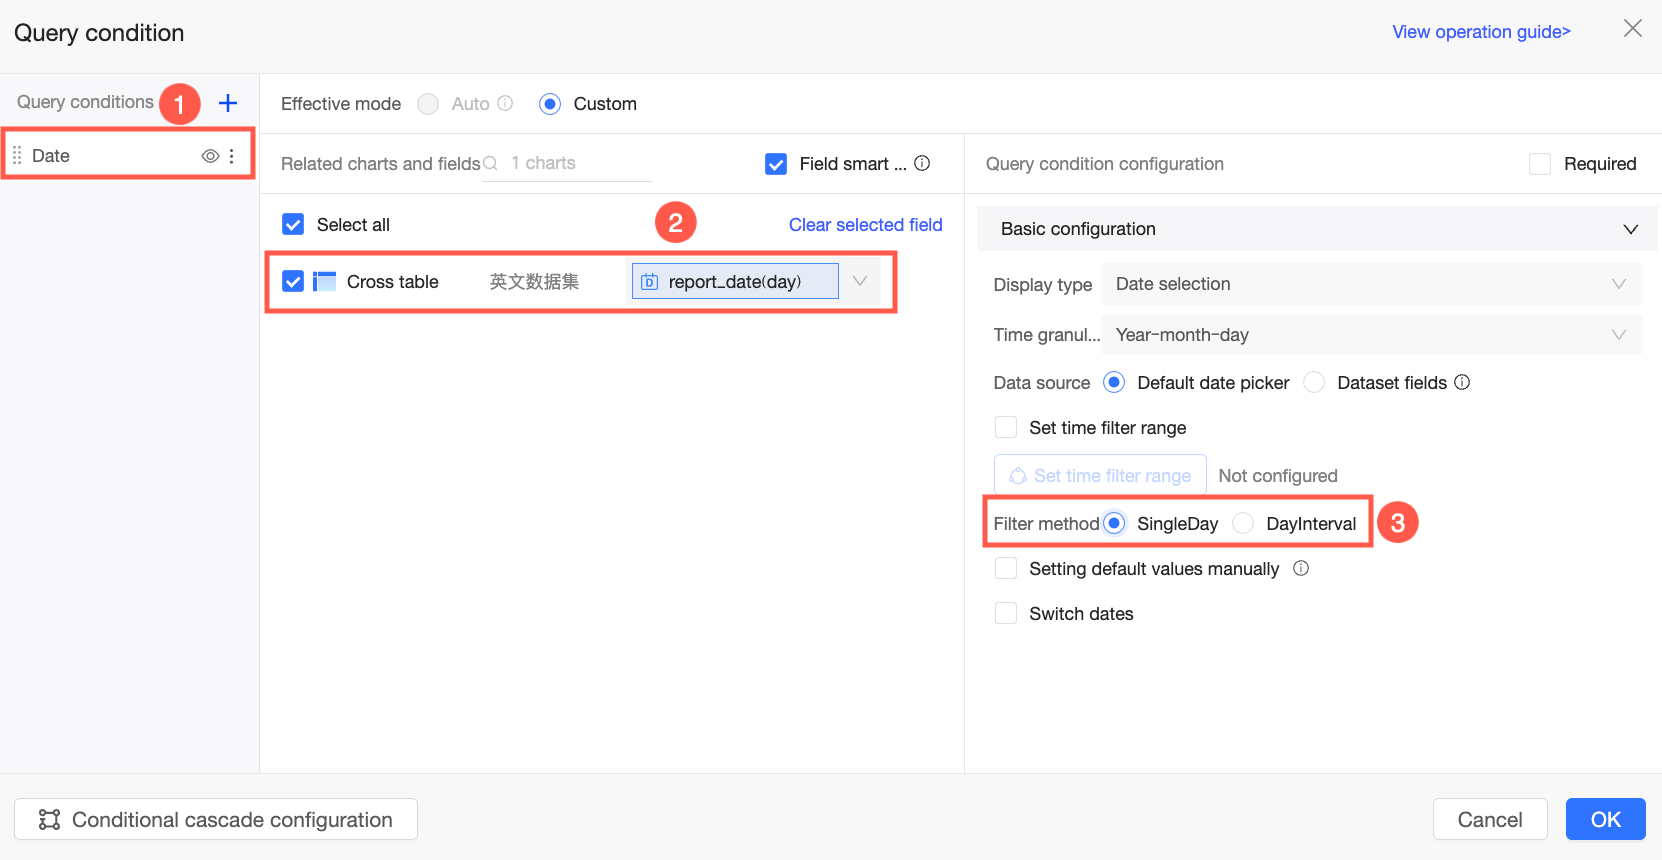
In the Query Condition Settings dialog box, configure the query control name, associated chart, and fields.
In this example, set the query control name to Time Range, associate it with the Cross Table and the Order Date (day) field, and set the filter method to Single Day. For more information about date query controls, see Date query.
Click OK to complete the time query control configuration.
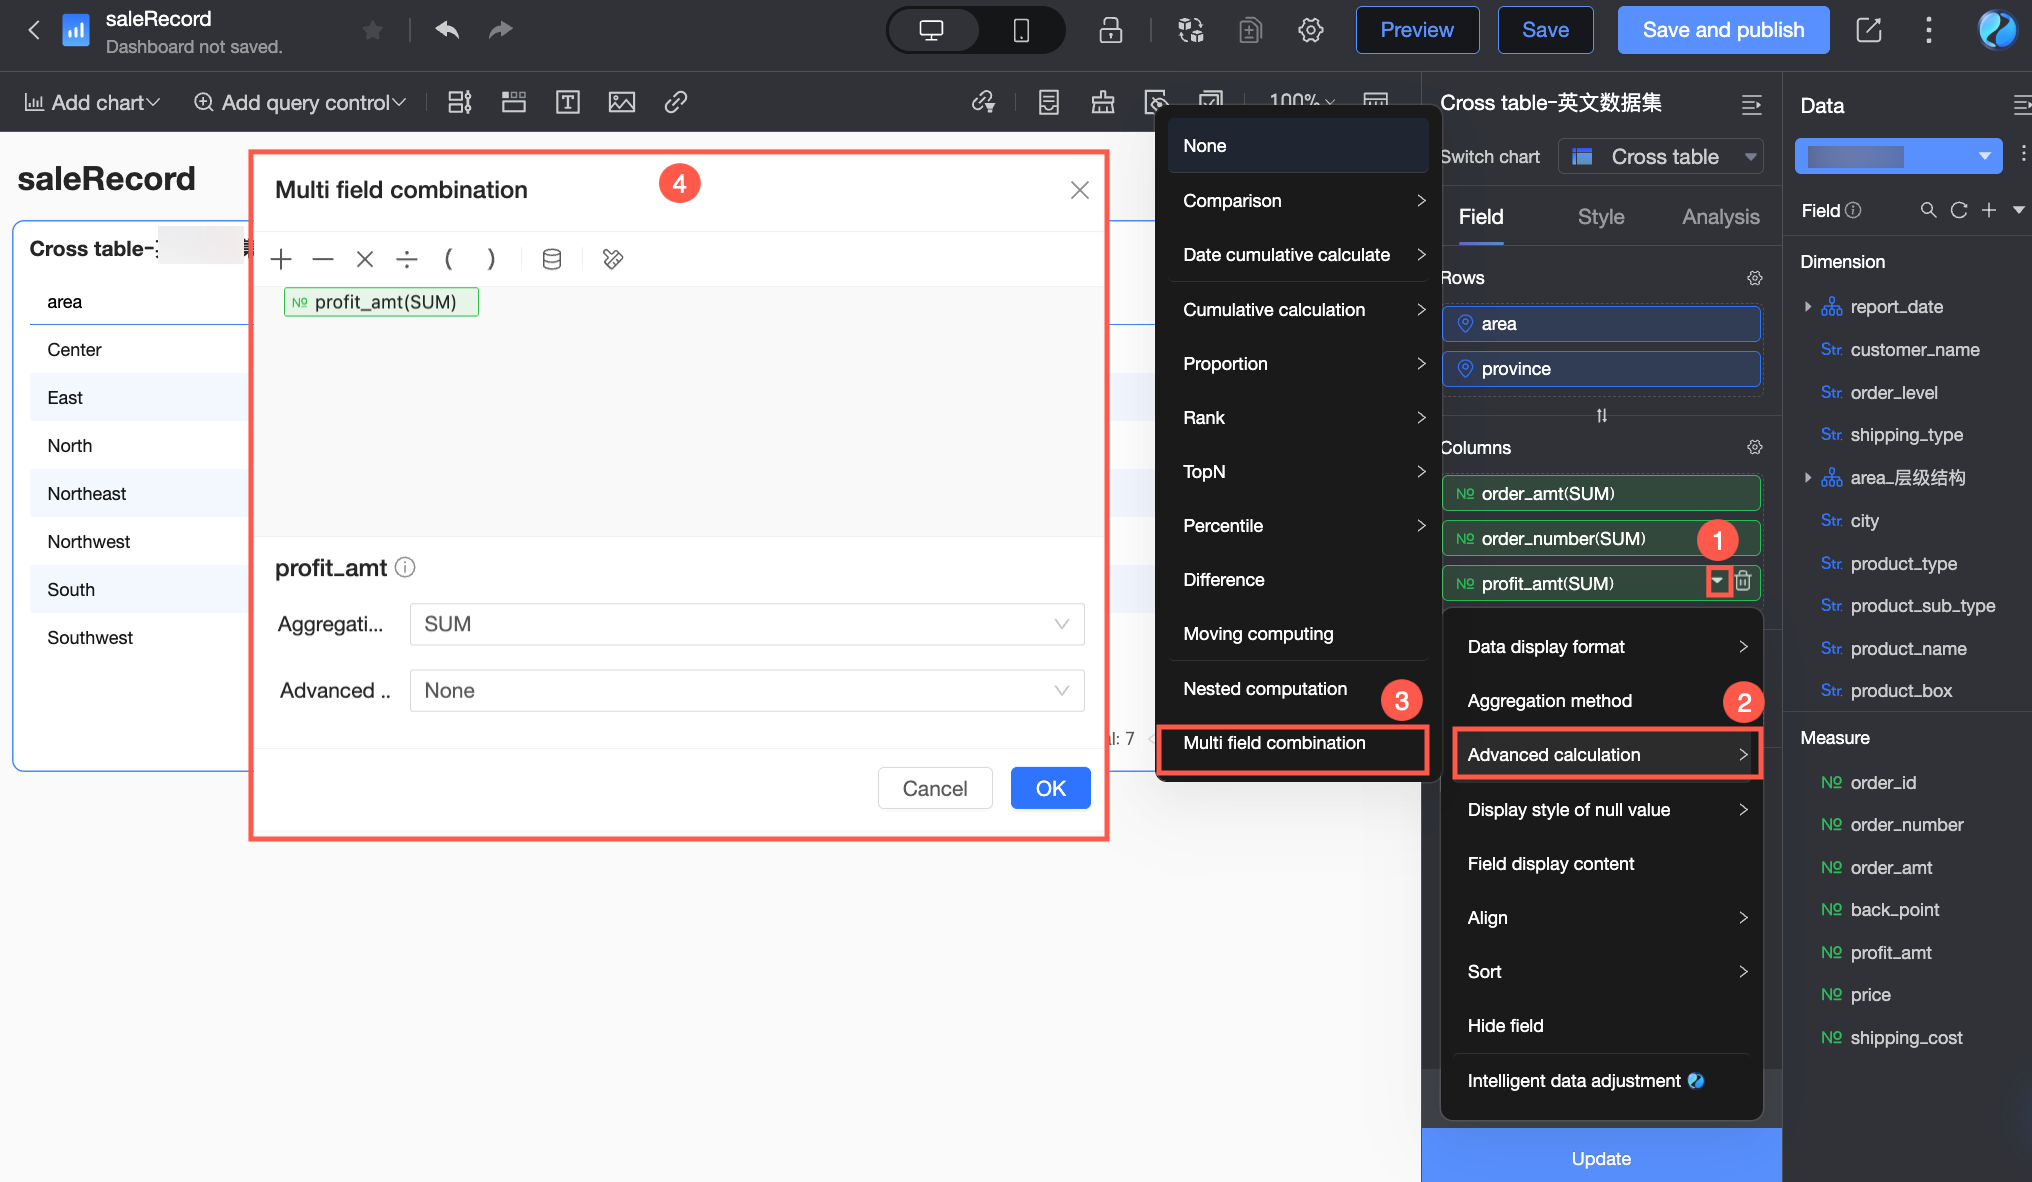
Configure the multi-field combination: Click the
 icon next to the second Profit amount field and select Advanced Calculation > Combine multiple fields. In the Combine multiple fields dialog box, configure the settings based on the formula.
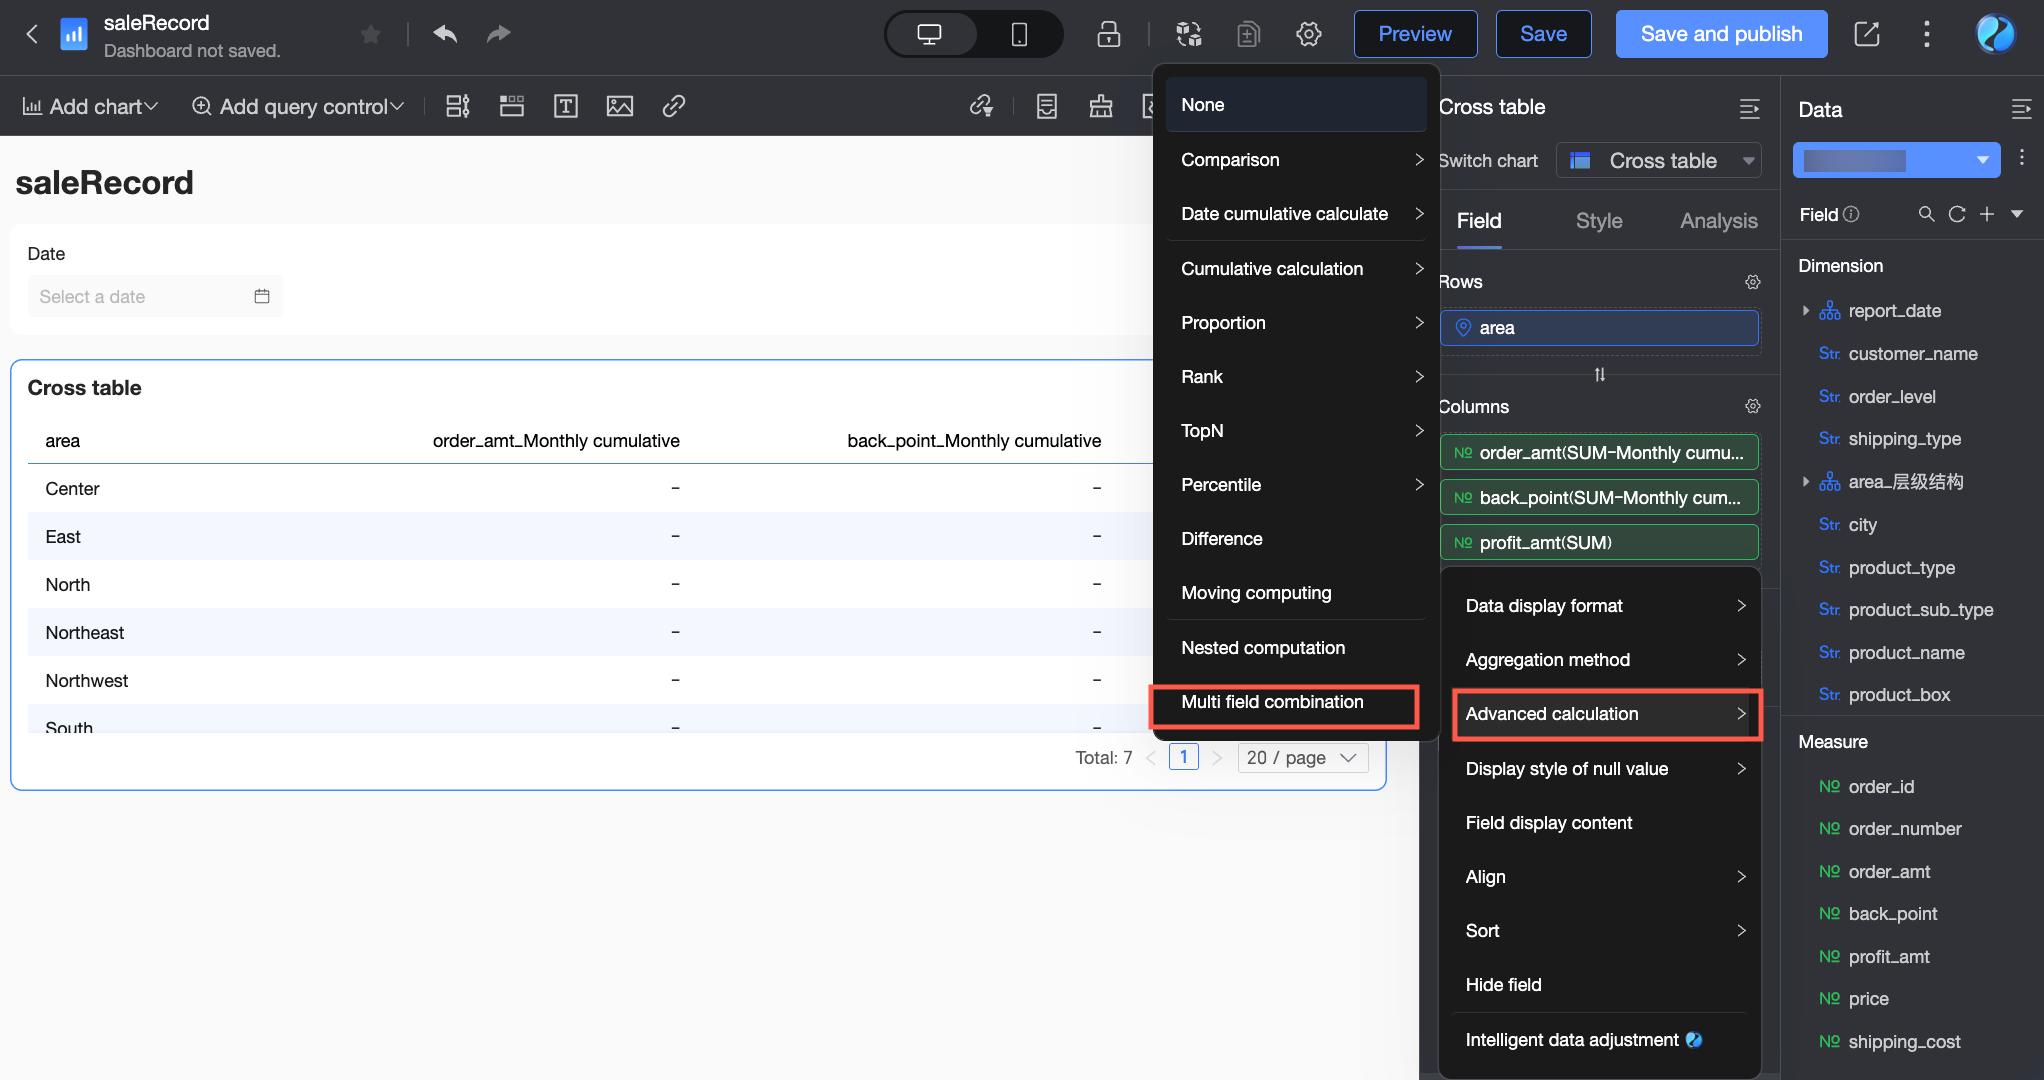
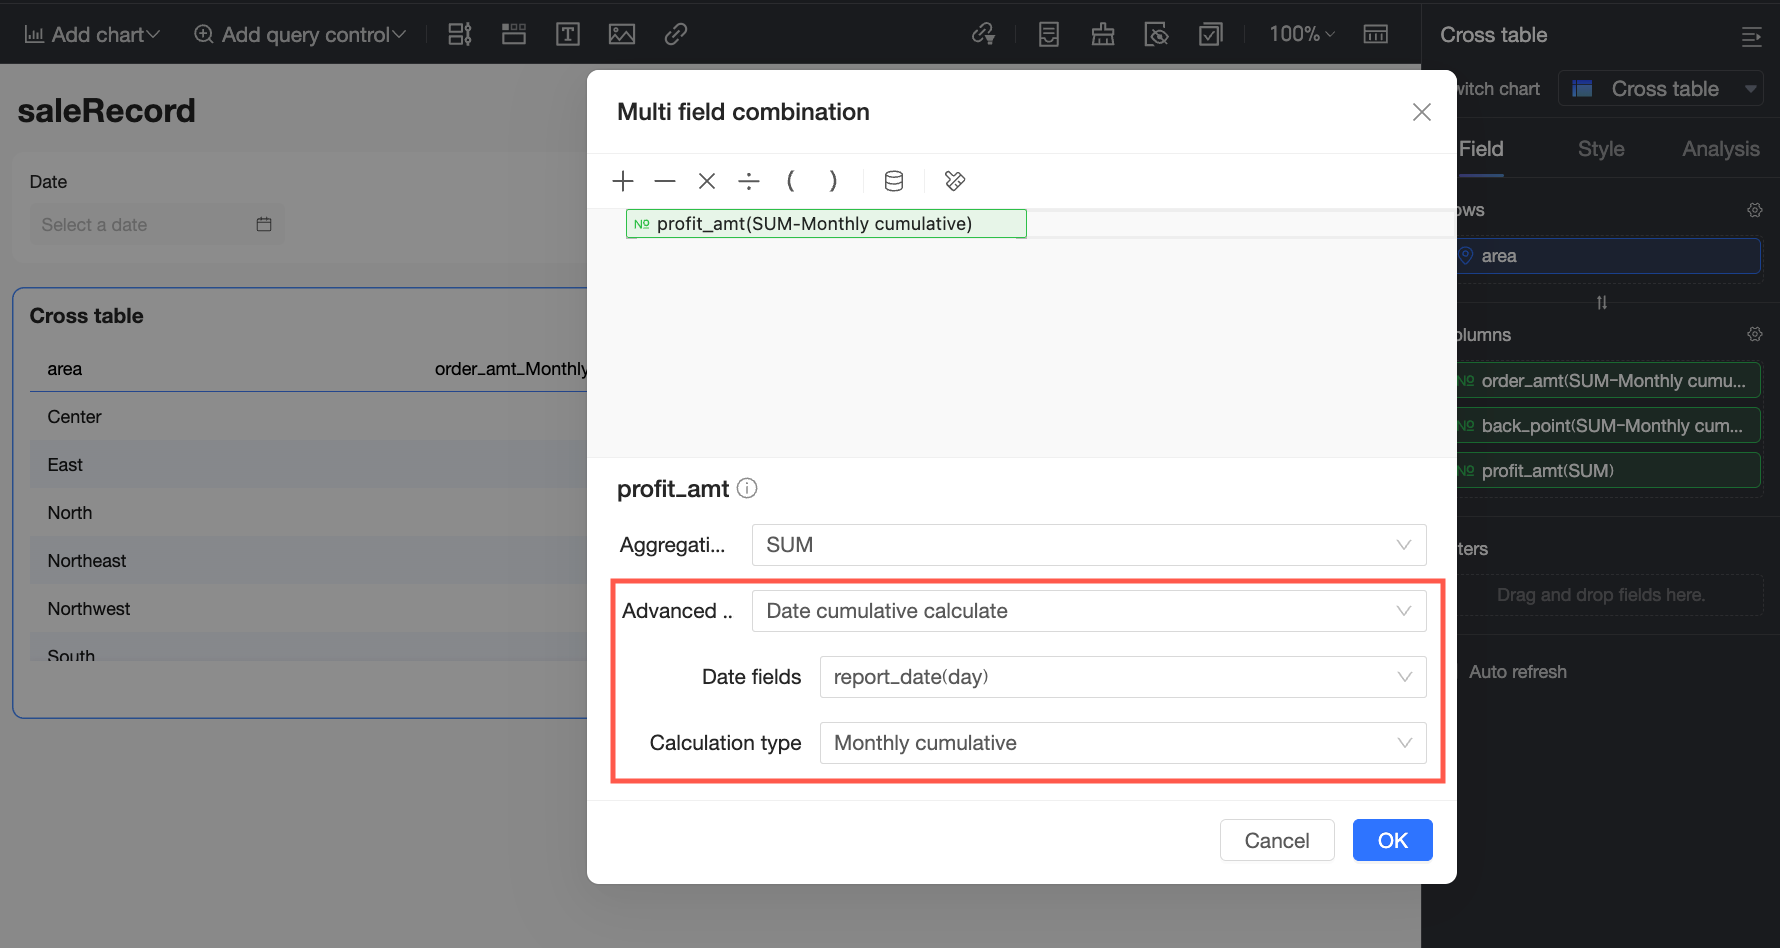
Configure Date Accumulation for the Profit amount field to obtain the monthly cumulative profit amount. Because the goal is to view the cumulative profit amount by month, set the date field to Order Date (day) and the calculation type to Accumulate by Month.
For more information about date accumulation, see Date accumulation.
Click the
 icon to insert a division operator.
Click the Add field icon (
 ) and select the Order amount field from the drop-down list.
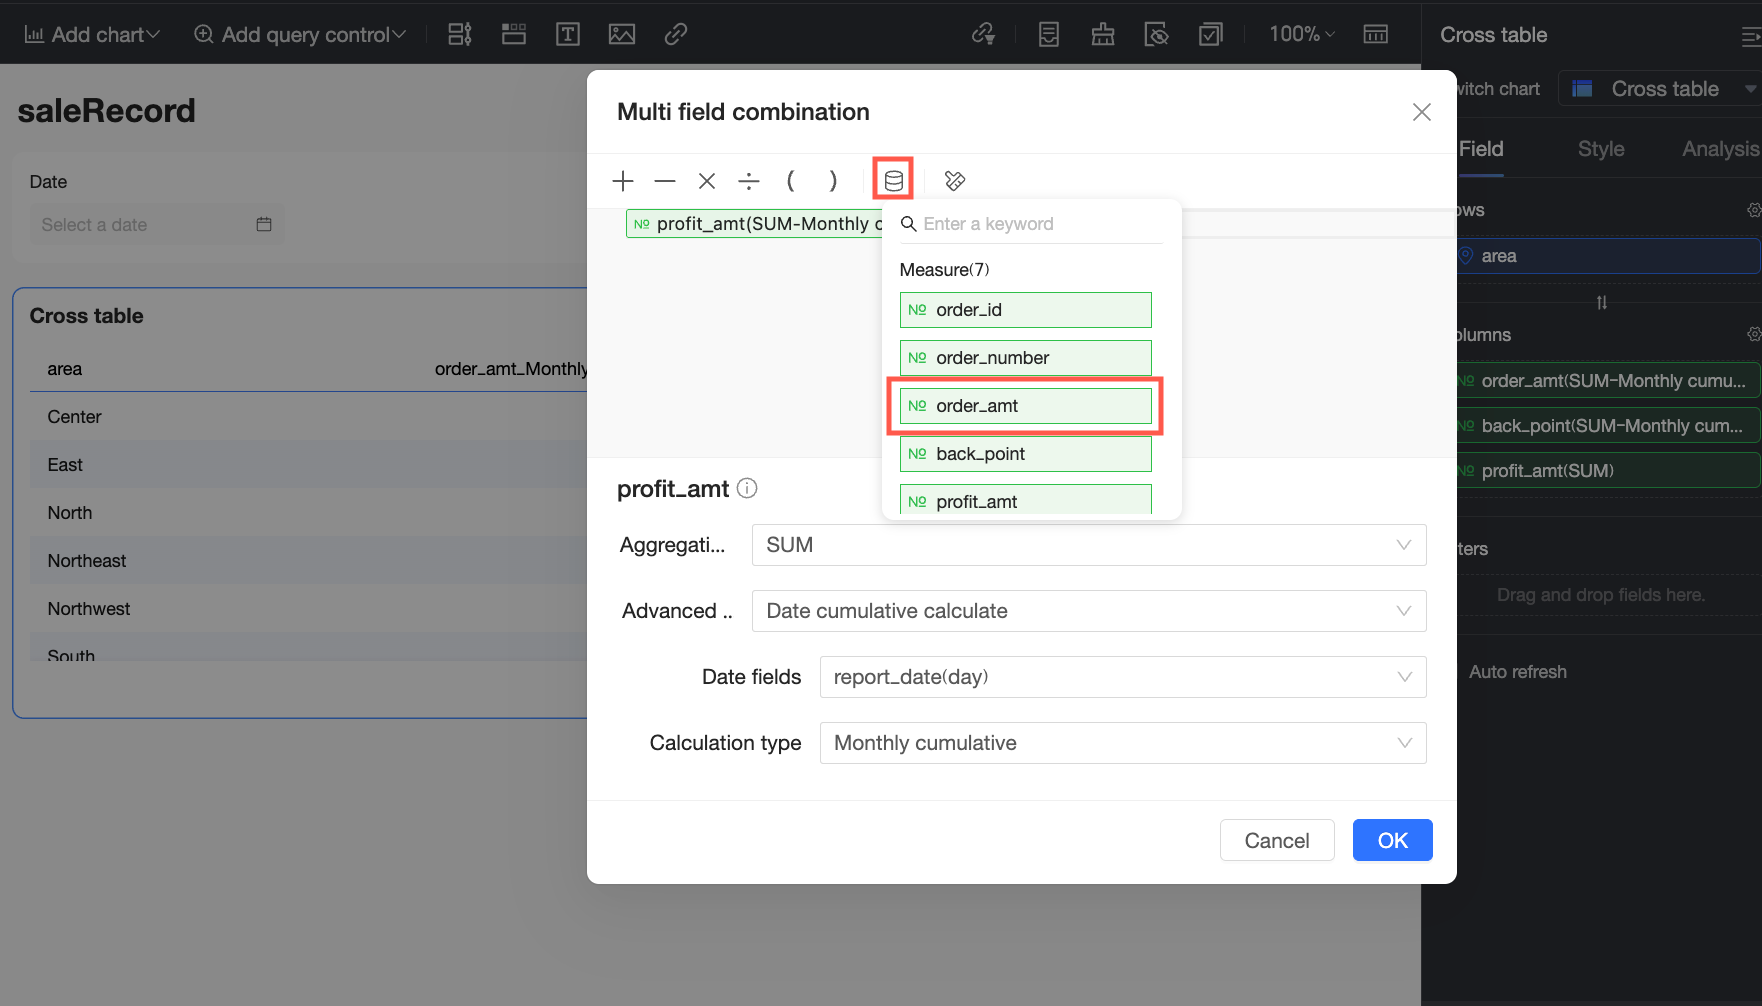
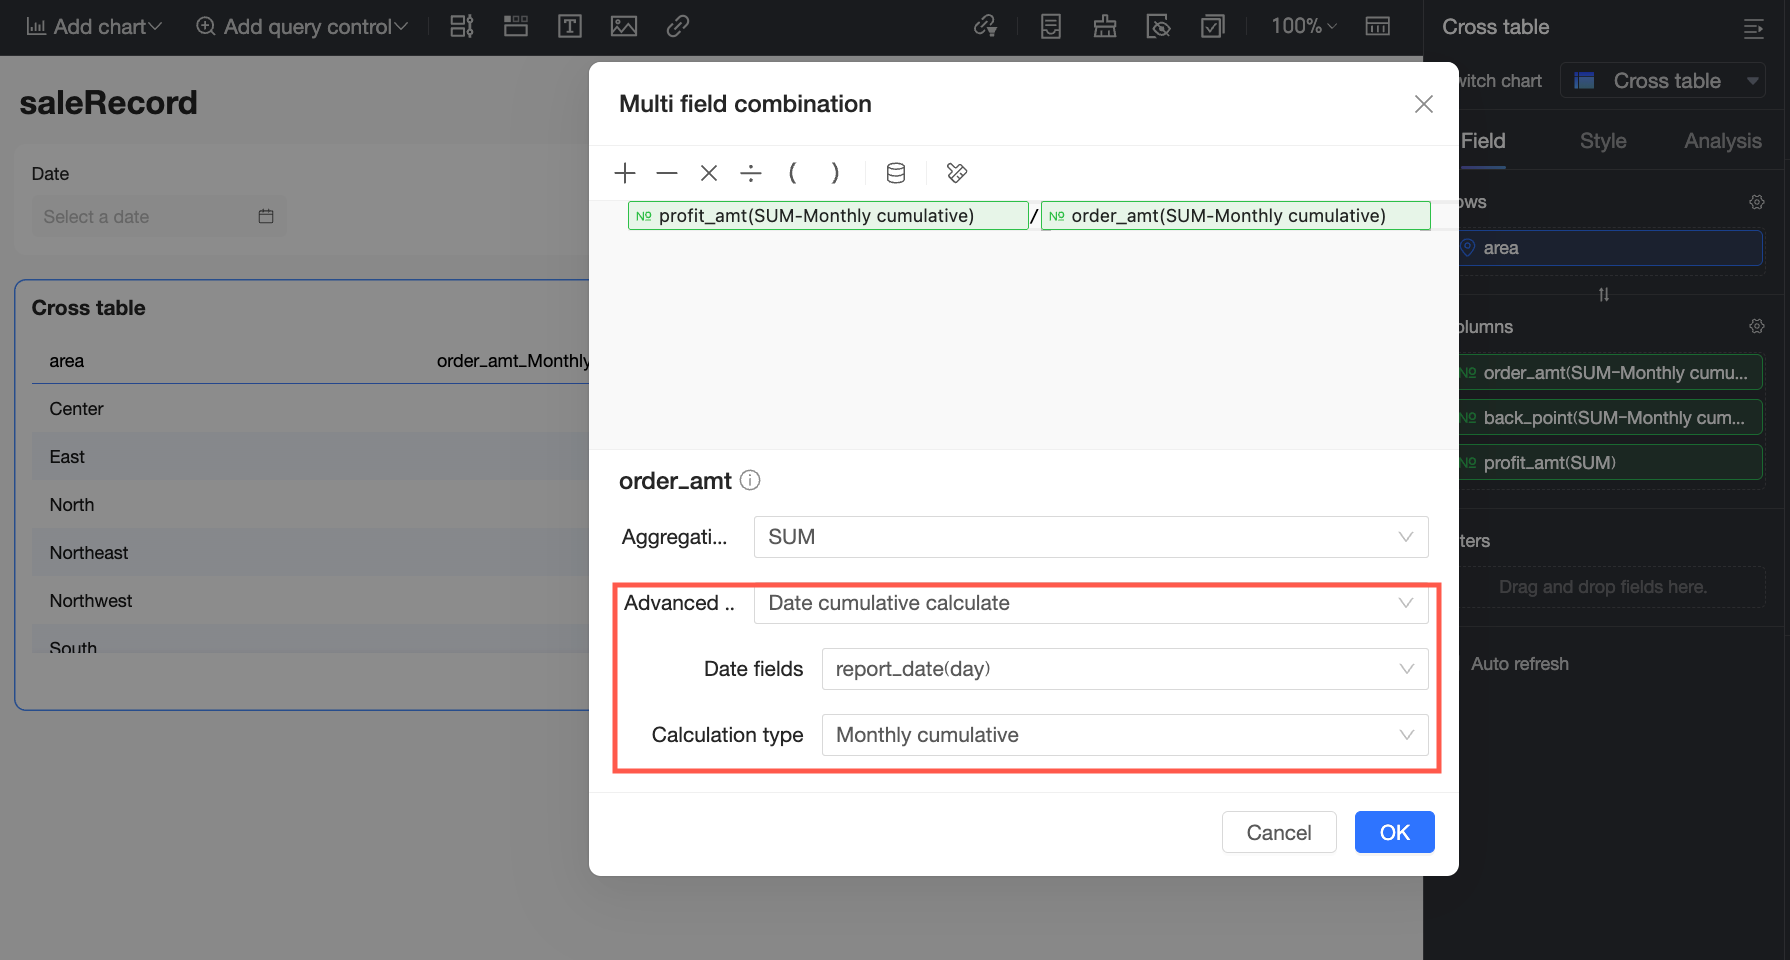
Configure Date Accumulation for the Order amount field to obtain the monthly cumulative order amount. Because the goal is to view the cumulative order amount by month, set the date field to Order Date (day) and the calculation type to Accumulate by Month.
For more information about date accumulation, see Date accumulation.
Click OK to complete the configuration.
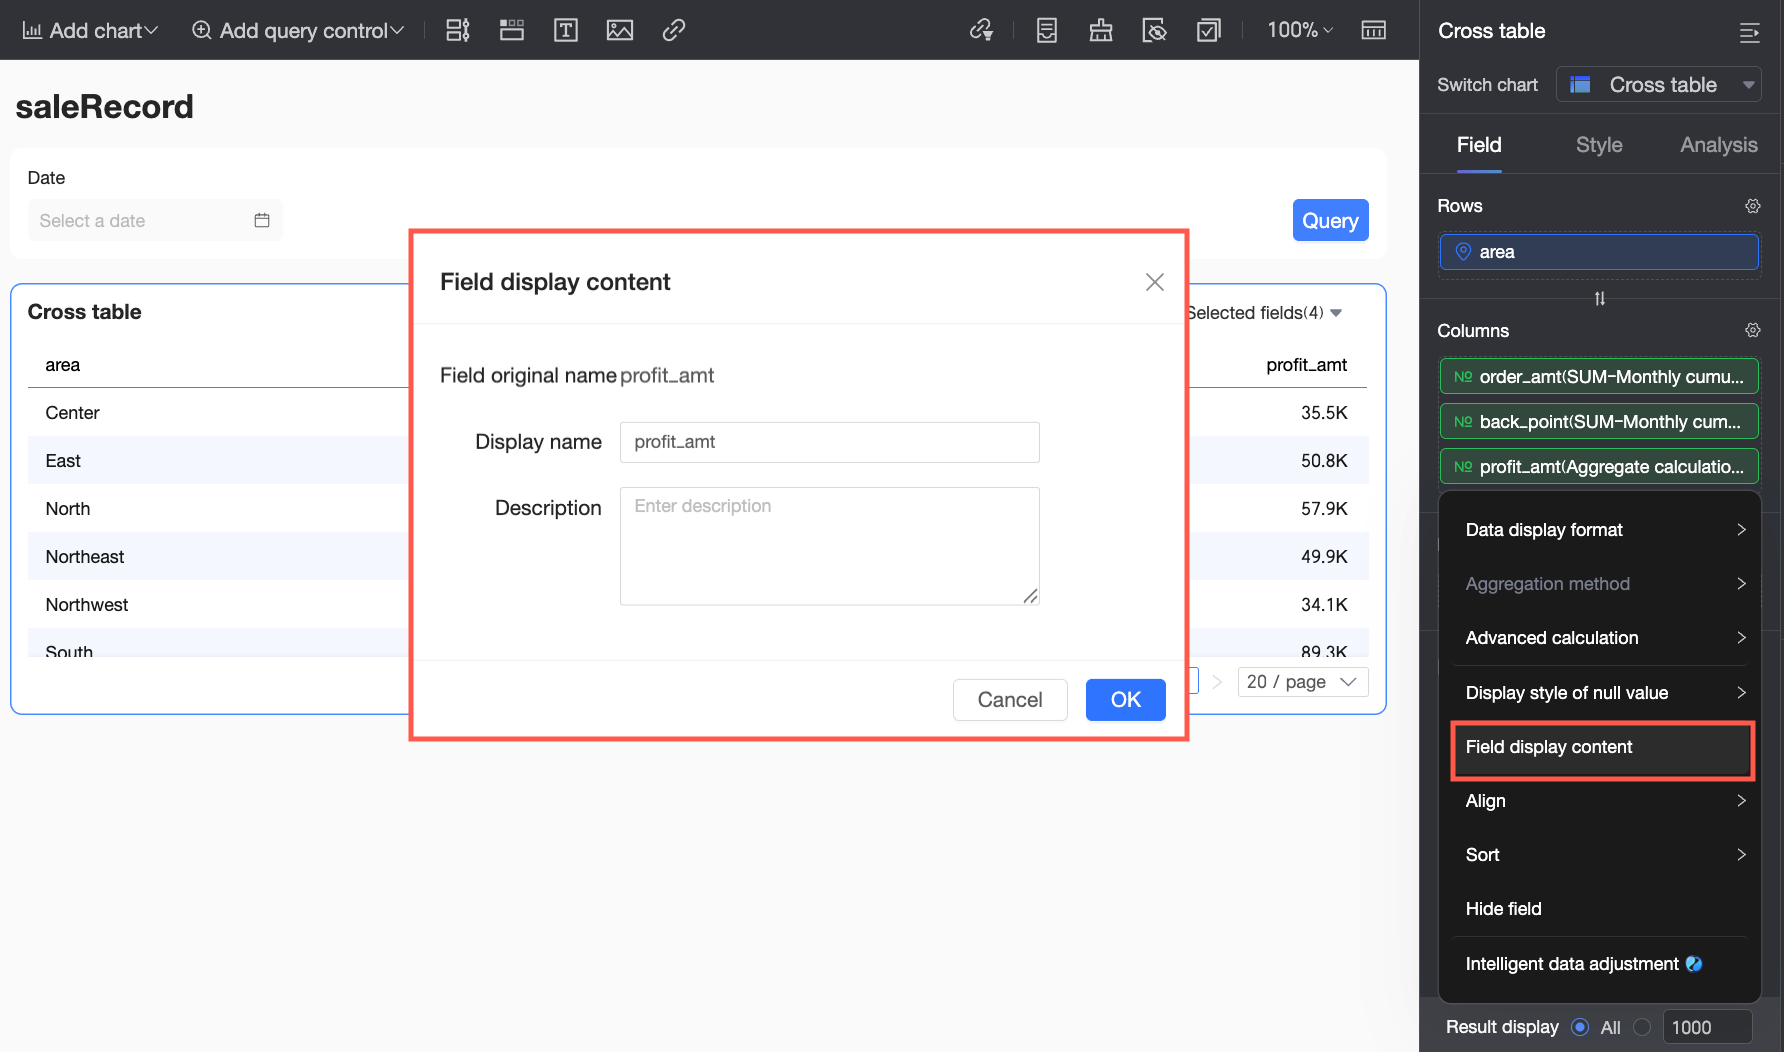
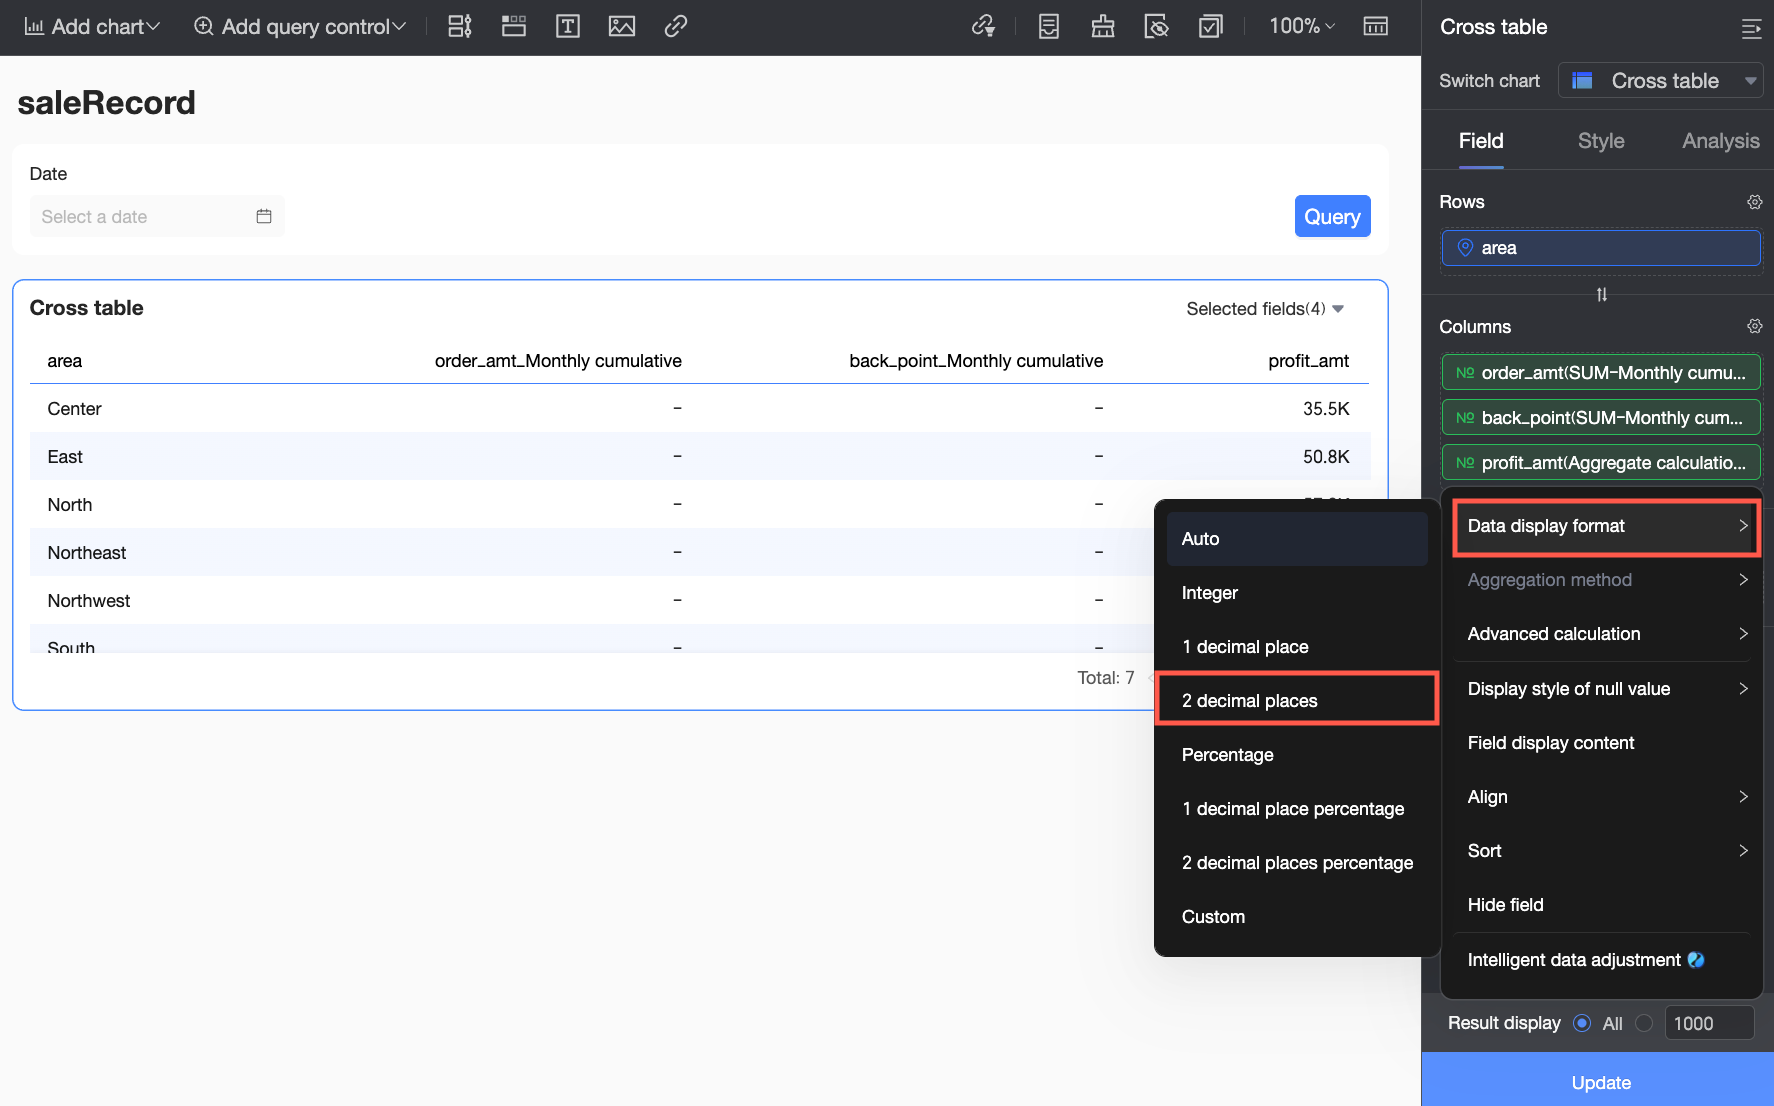
Configure the field and data display format
For the Profit amount field that uses the multi-field combination, set Display Name to Monthly cumulative profit margin and click OK.
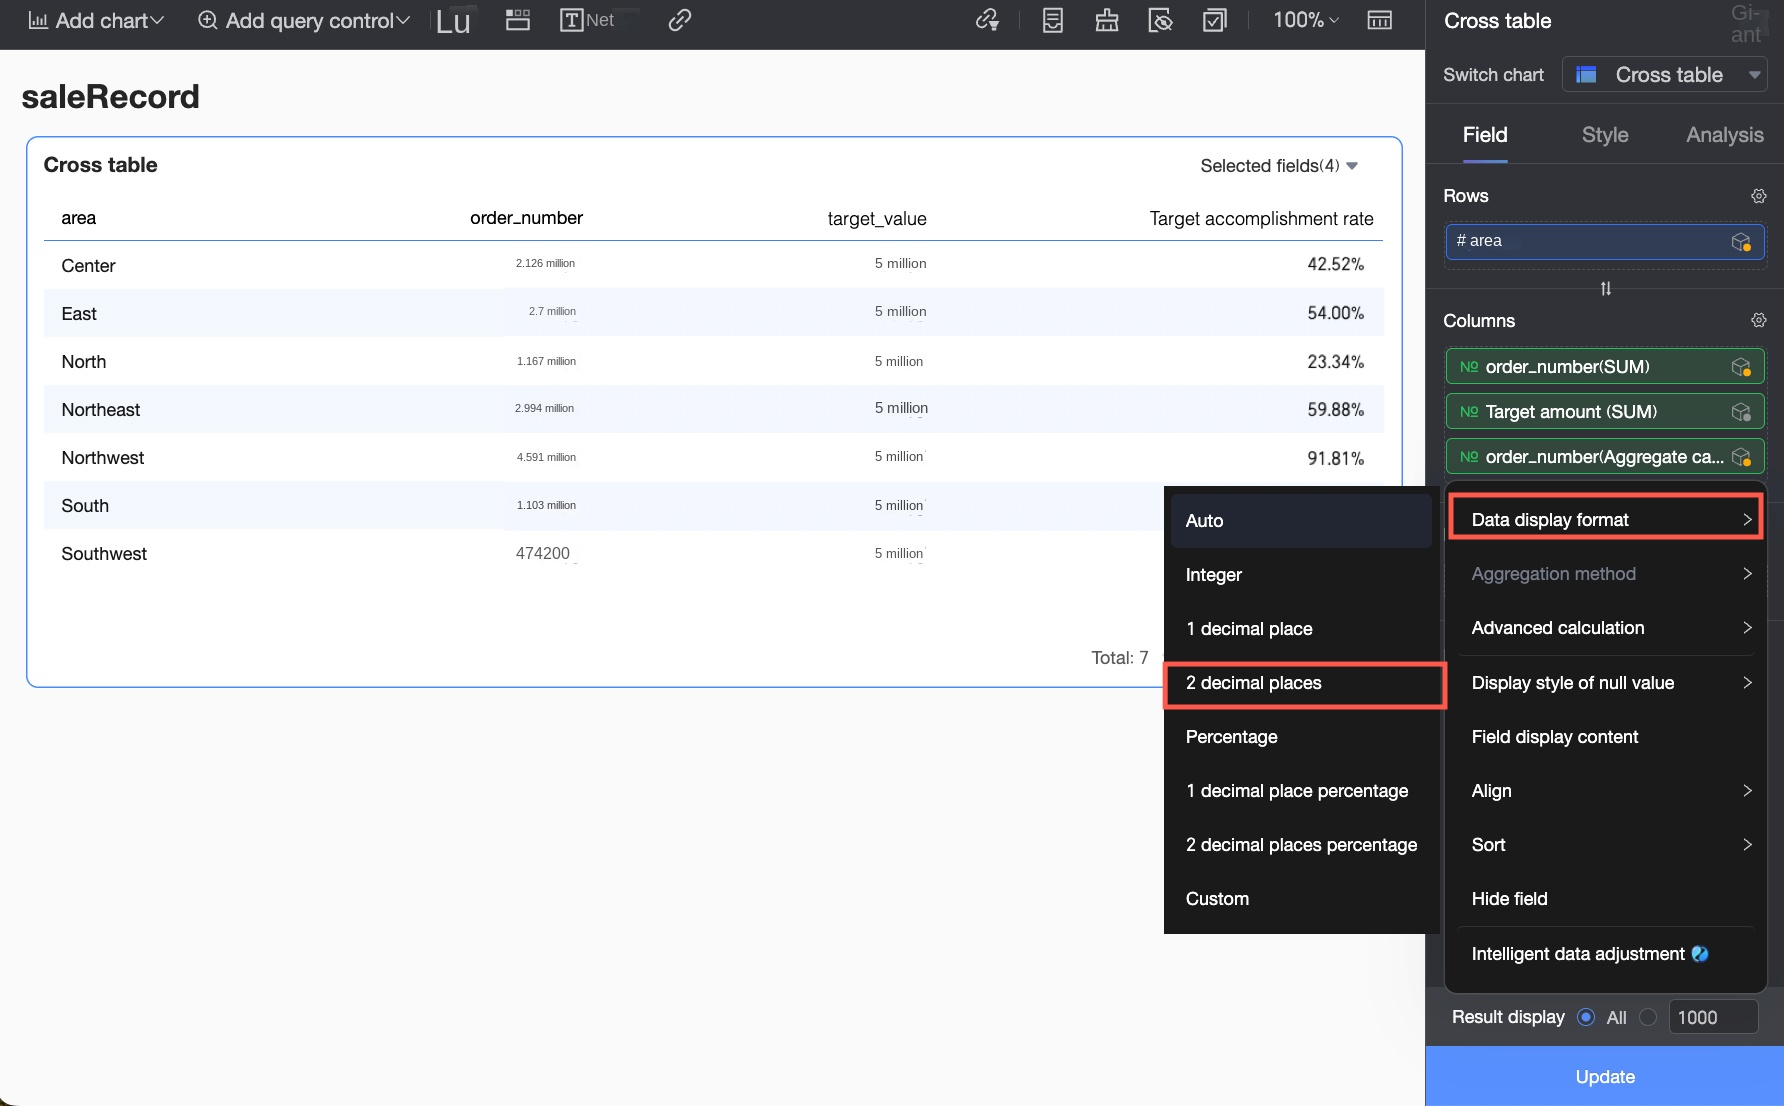
Set the Data Display Format for Monthly cumulative profit margin to 2 decimal places.
Click Update to apply the settings. In the Time Range query control, set the date to January 28, 2024, and click Query. You can then view the monthly cumulative profit margin for each region in January 2024, along with the corresponding monthly cumulative order amount and monthly cumulative profit amount.
Example 2: Target completion rate
Scenario: A salesperson needs to view the current sales target completion rate for each region to make timely adjustments to sales strategies.
Formula: Target completion rate = Order amount (from the sales dataset) / Target order amount (from the sales target dataset)
Based on this information, you must import the sales target dataset as a secondary dataset into the cross table that was created from the sales dataset. Then, you can use the multi-field combination feature to divide the order amount by the target order amount to obtain the target completion rate. The following steps describe the detailed configuration.
Configure the dataset combination.
Click the
 icon next to the dataset in the Data panel and select Multi-select from the drop-down menu.
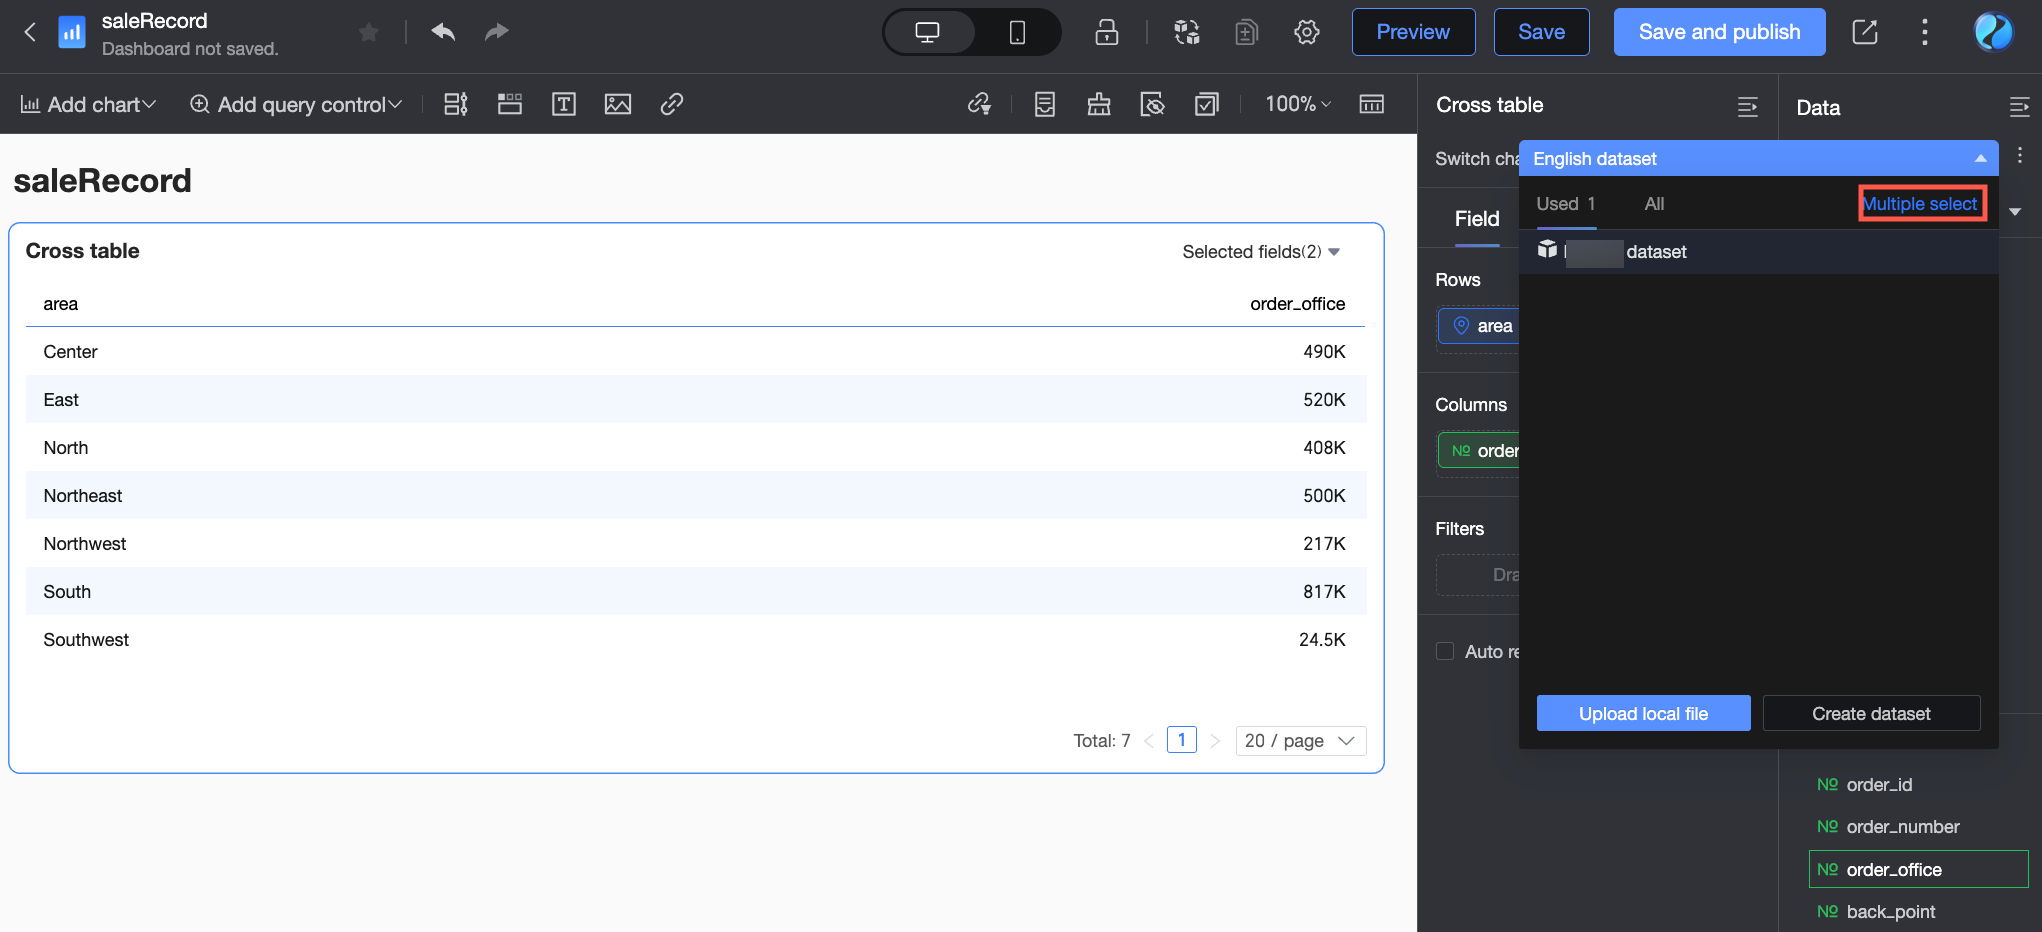
In the dataset list, locate and select the target value dataset.
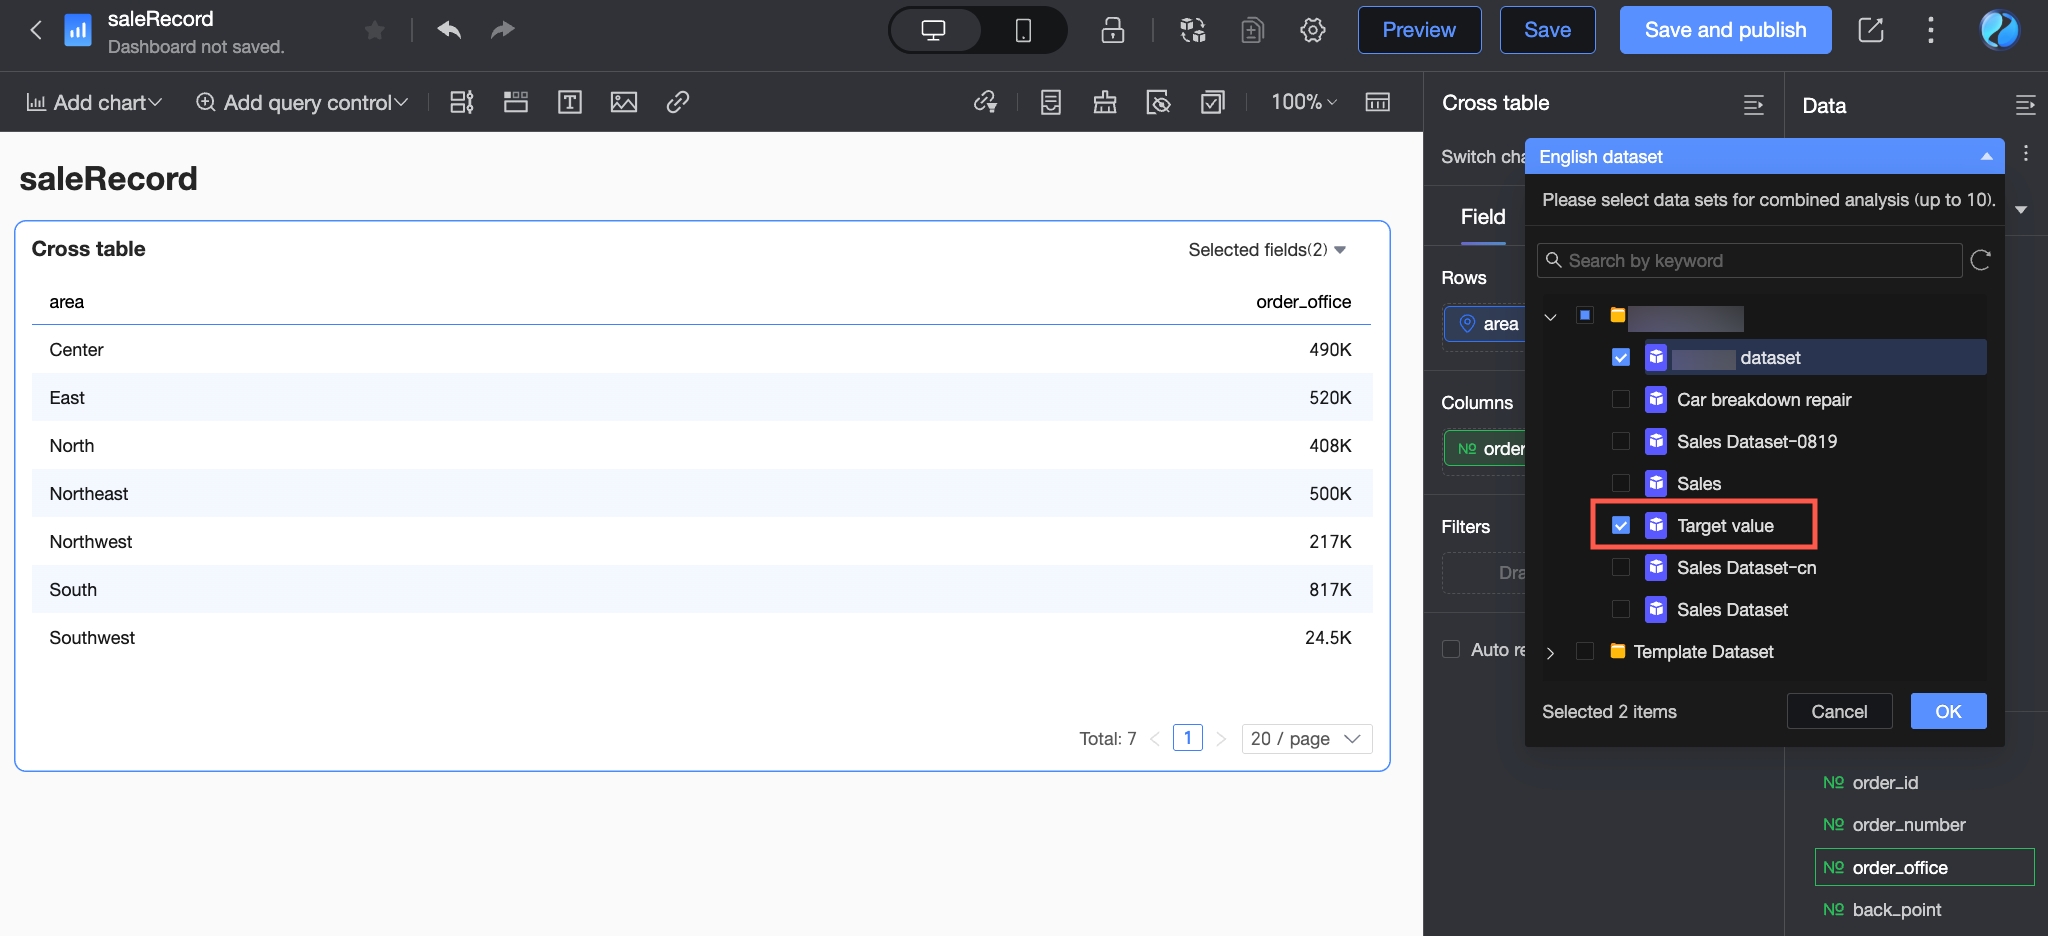
Click OK. In the Create Dataset Combination dialog box, configure the settings.
In this example, set the dataset combination name to Target completion rate analysis. Use the sales dataset as the primary dataset and the target value dataset as the secondary dataset. The two datasets are associated by the Region field. For more information about configuring dataset combinations, see Dataset combination.
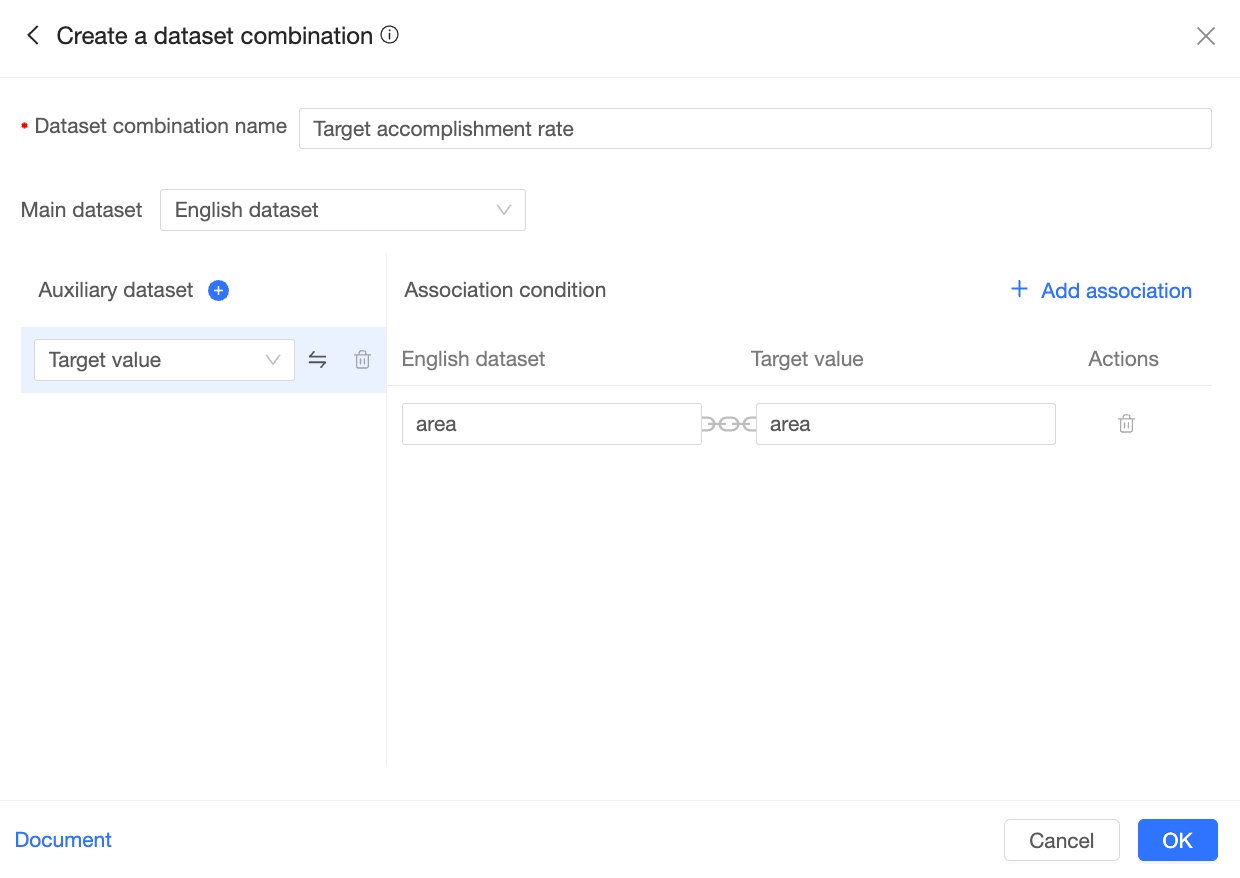
Click OK to complete the dataset combination configuration.
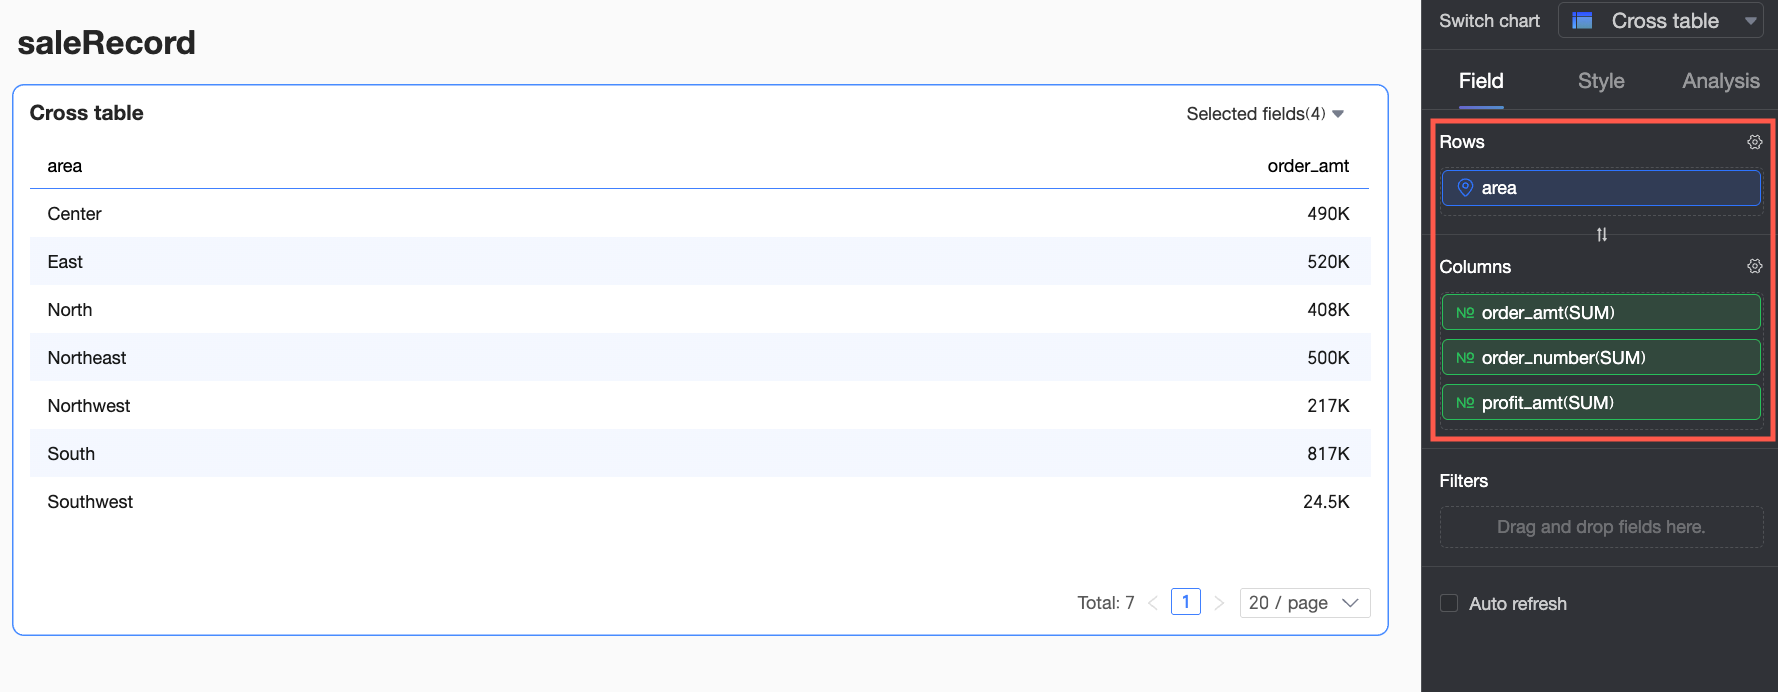
In the Fields panel, configure the fields.
In the Rows area, double-click or drag the Region field from the primary dataset.
In the Columns area, double-click or drag the Order amount field from the primary dataset and the Target amount field from the secondary dataset. You need to add the Order amount field twice. One instance will be used as the basis for the multi-field combination.
Configure the multi-field combination.
Click the
icon next to the second Order amount field and select Advanced Calculation > Combine multiple fields.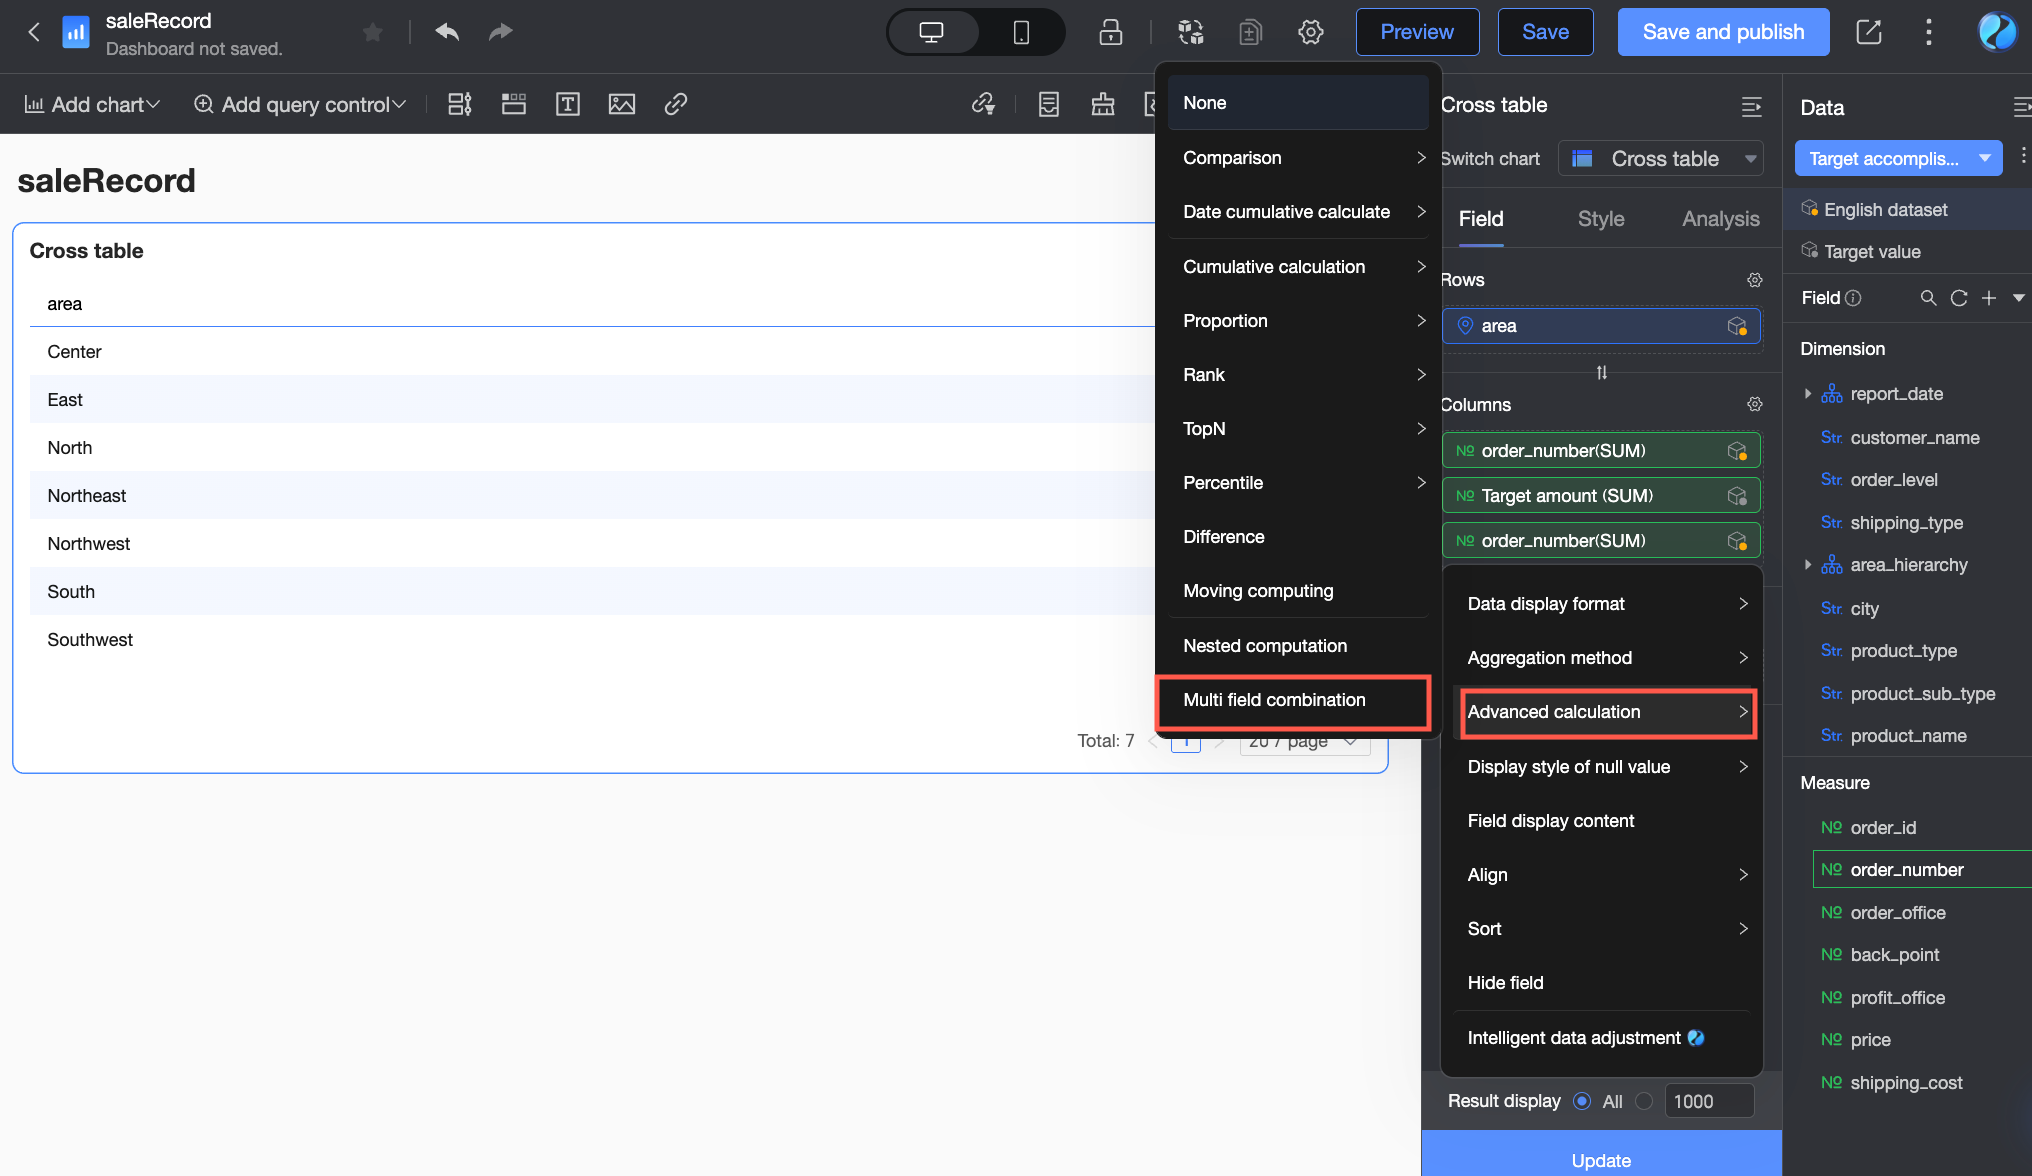
In the Combine multiple fields dialog box, the Order amount field is added by default. Click the
icon to insert a division operator.Click the Add field icon (
), locate the target value dataset in the drop-down list, and select the Target amount field.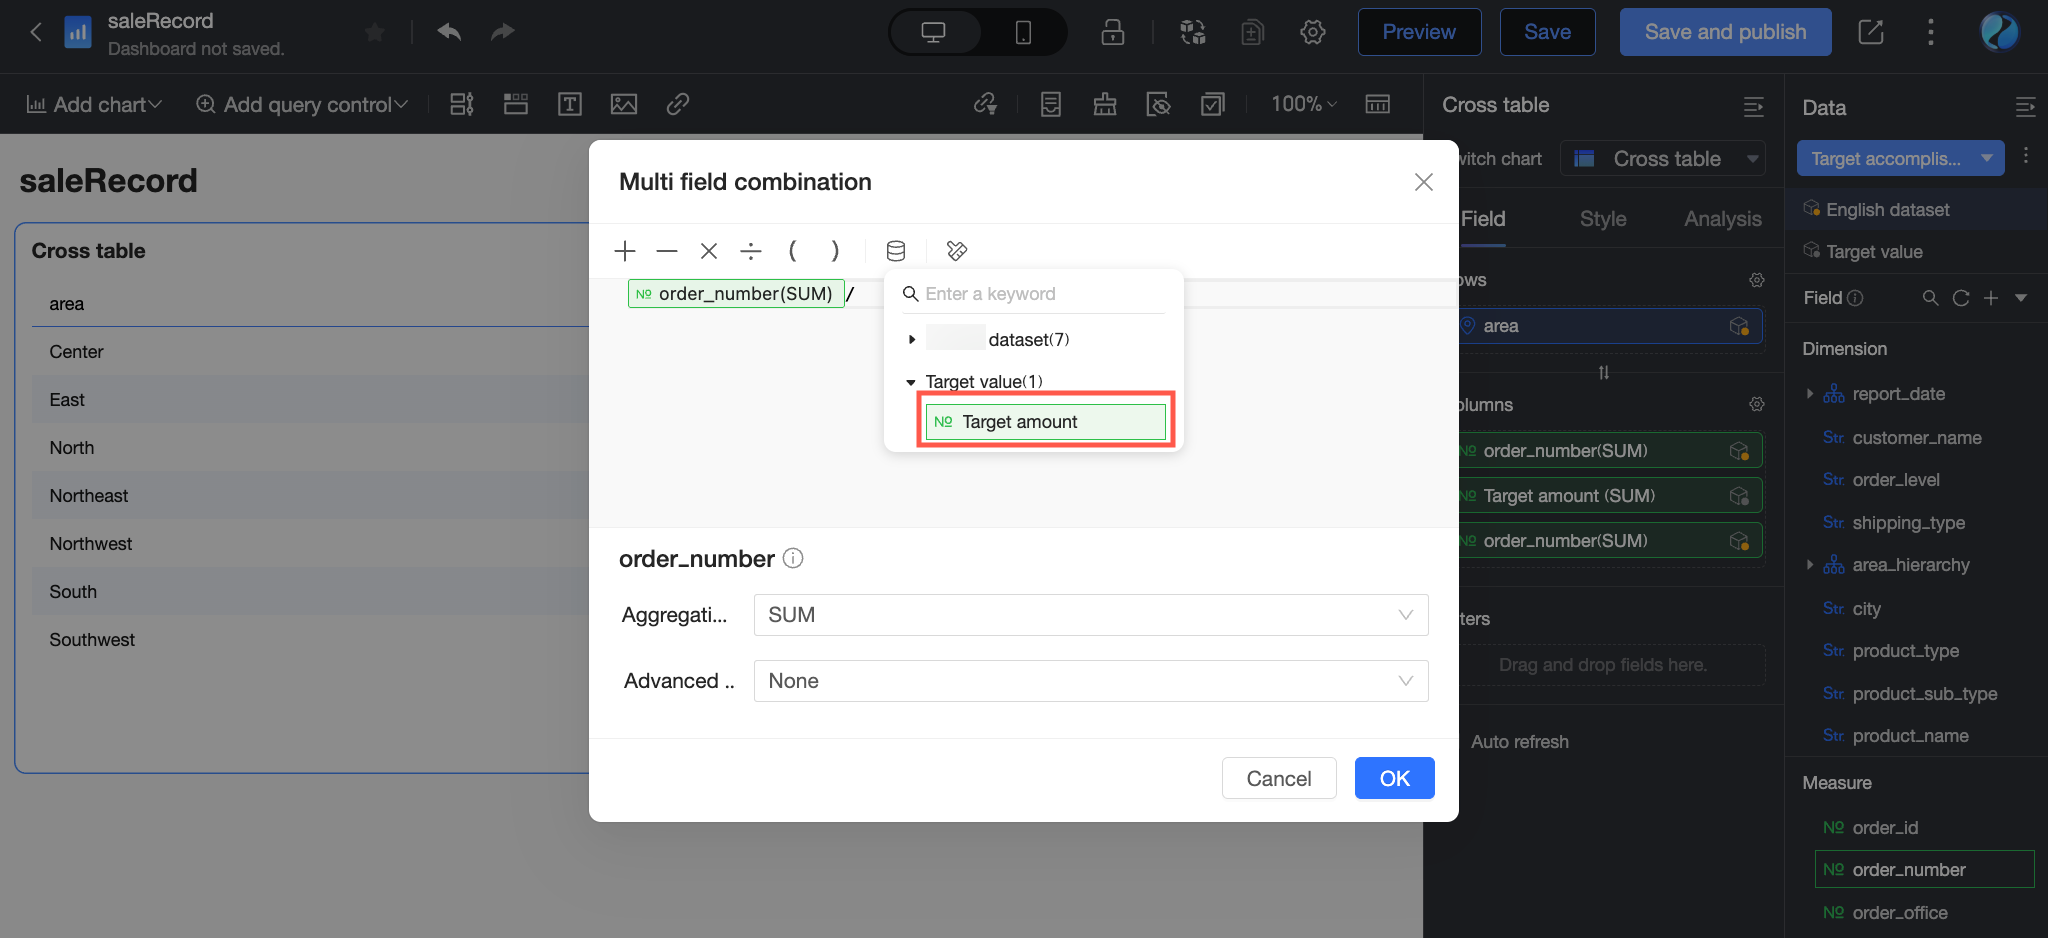
Click OK to complete the multi-field combination configuration.
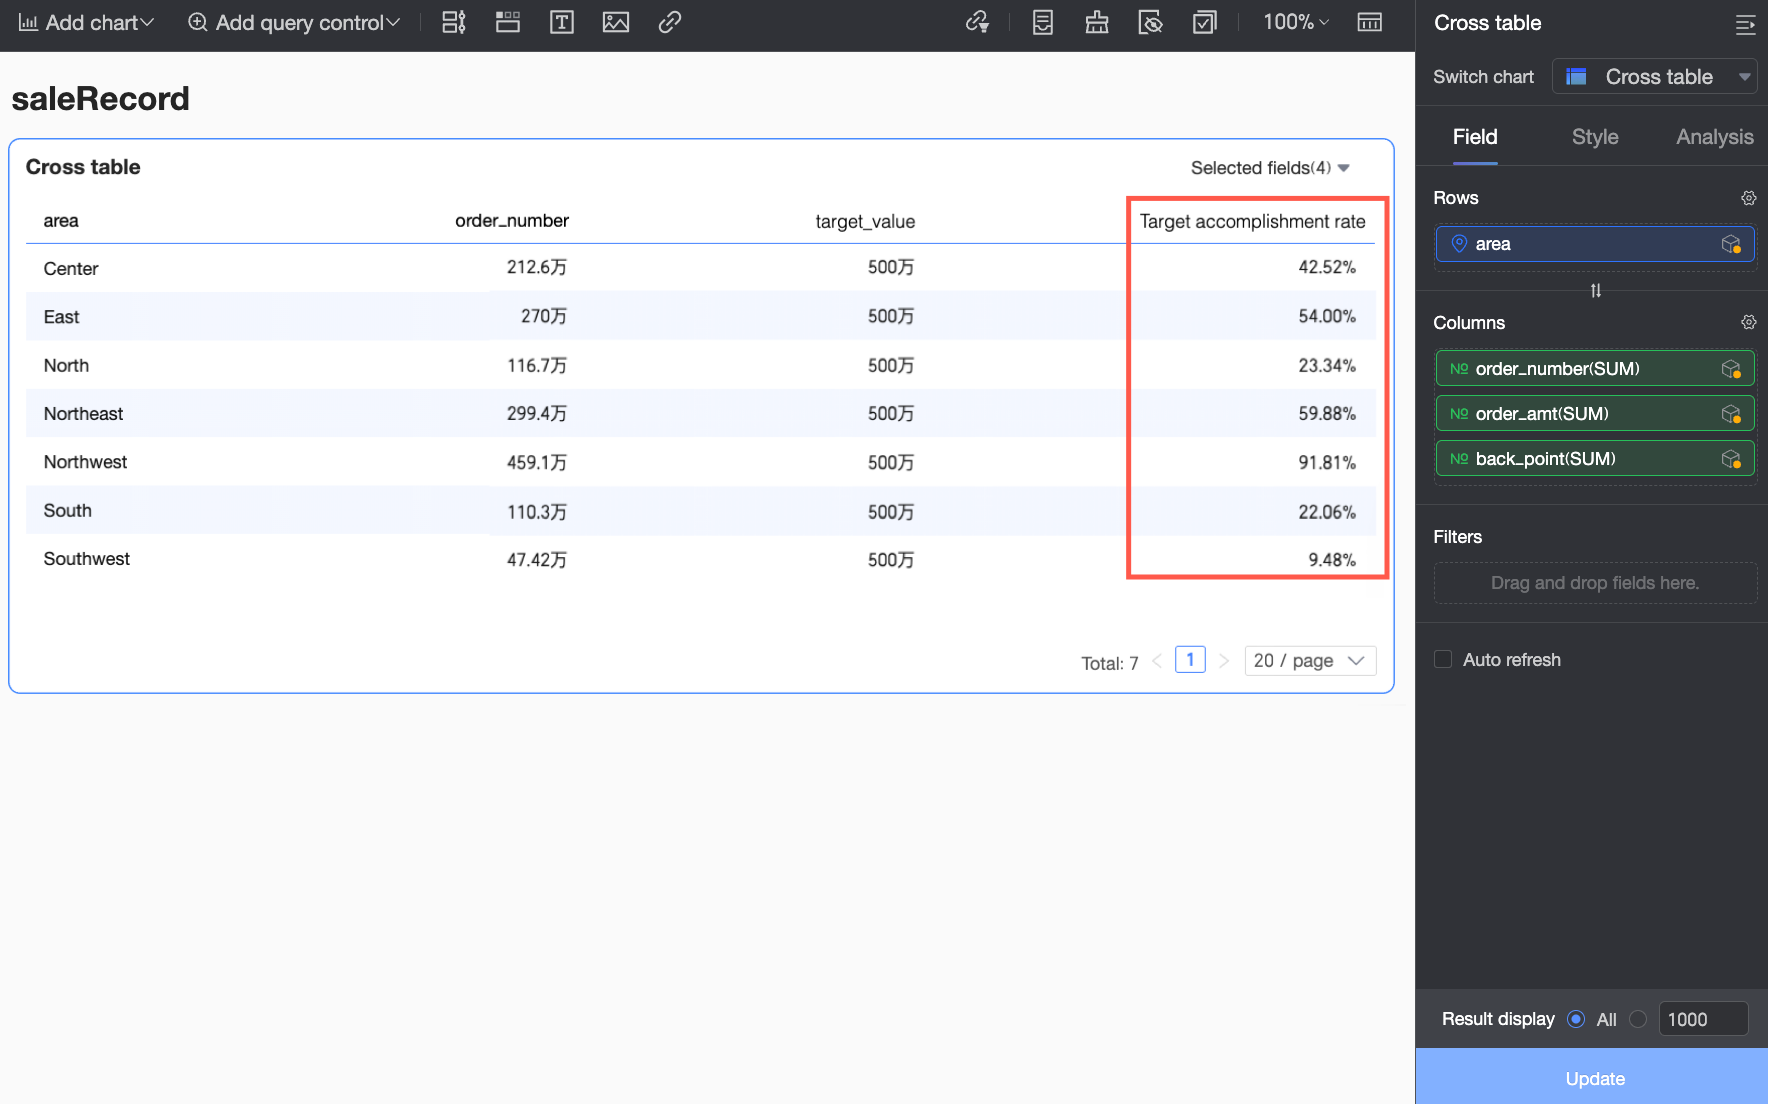
For the Order amount field that uses the multi-field combination, set Display Name to Target completion rate and click OK.
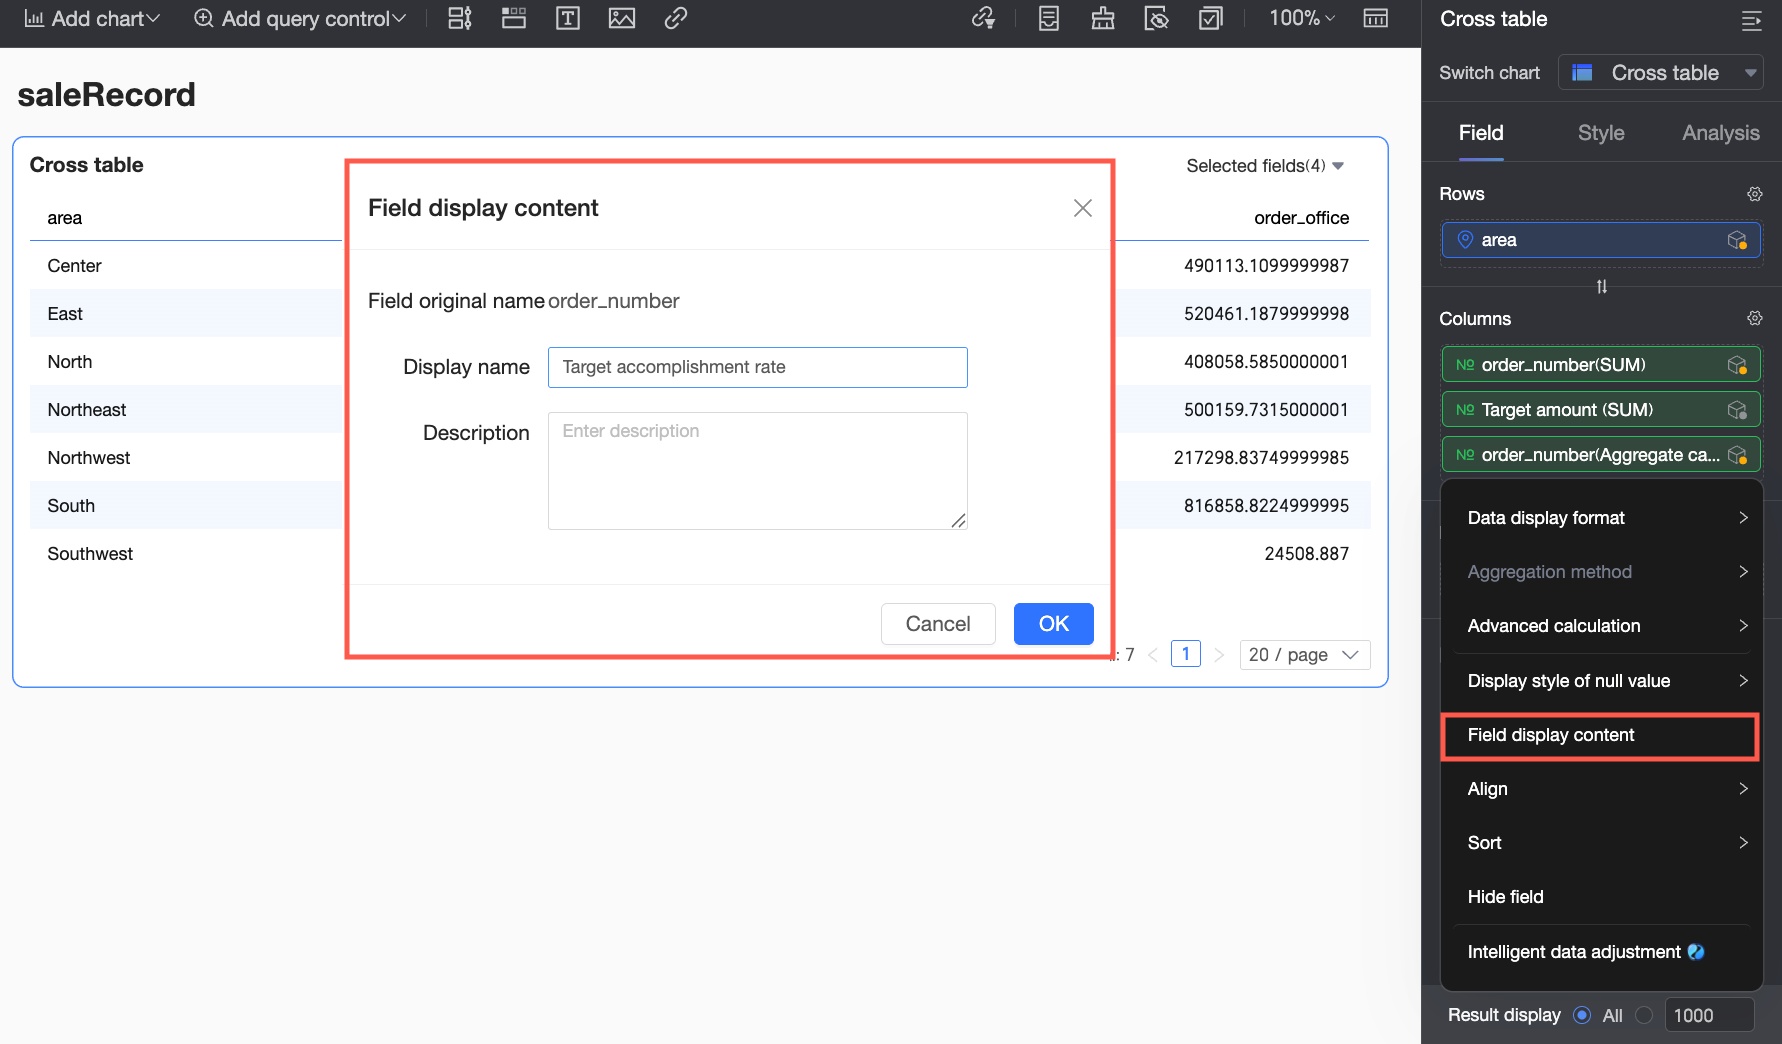
Set the Data Display Format for Target completion rate to Percentage with 2 decimal places.
Click Update. The target completion rate for each region is now displayed in the cross table.