Quick BI allows you to develop custom components beyond the built-in chart options, which can be utilized by you or within your organization.
Before beginning, you should familiarize yourself with ES2015. The official guide presumes you have an intermediate understanding of HTML, CSS, and JavaScript. If you're new to frontend development, starting with Quick BI custom components might not be ideal. There are two methods for developing custom components: online edit and professional mode. The subsequent sections detail each method.
Mode 1. Online Edit
Quick BI supports online edit mode, allowing you to develop and debug custom components directly on the page without installing a development environment. This mode is less complex and more convenient. To begin, log on to Quick BI with an organization administrator account.
Currently, only organization administrators have the permissions required to access the custom component management platform.
1. Register Component
Start by registering your custom component.
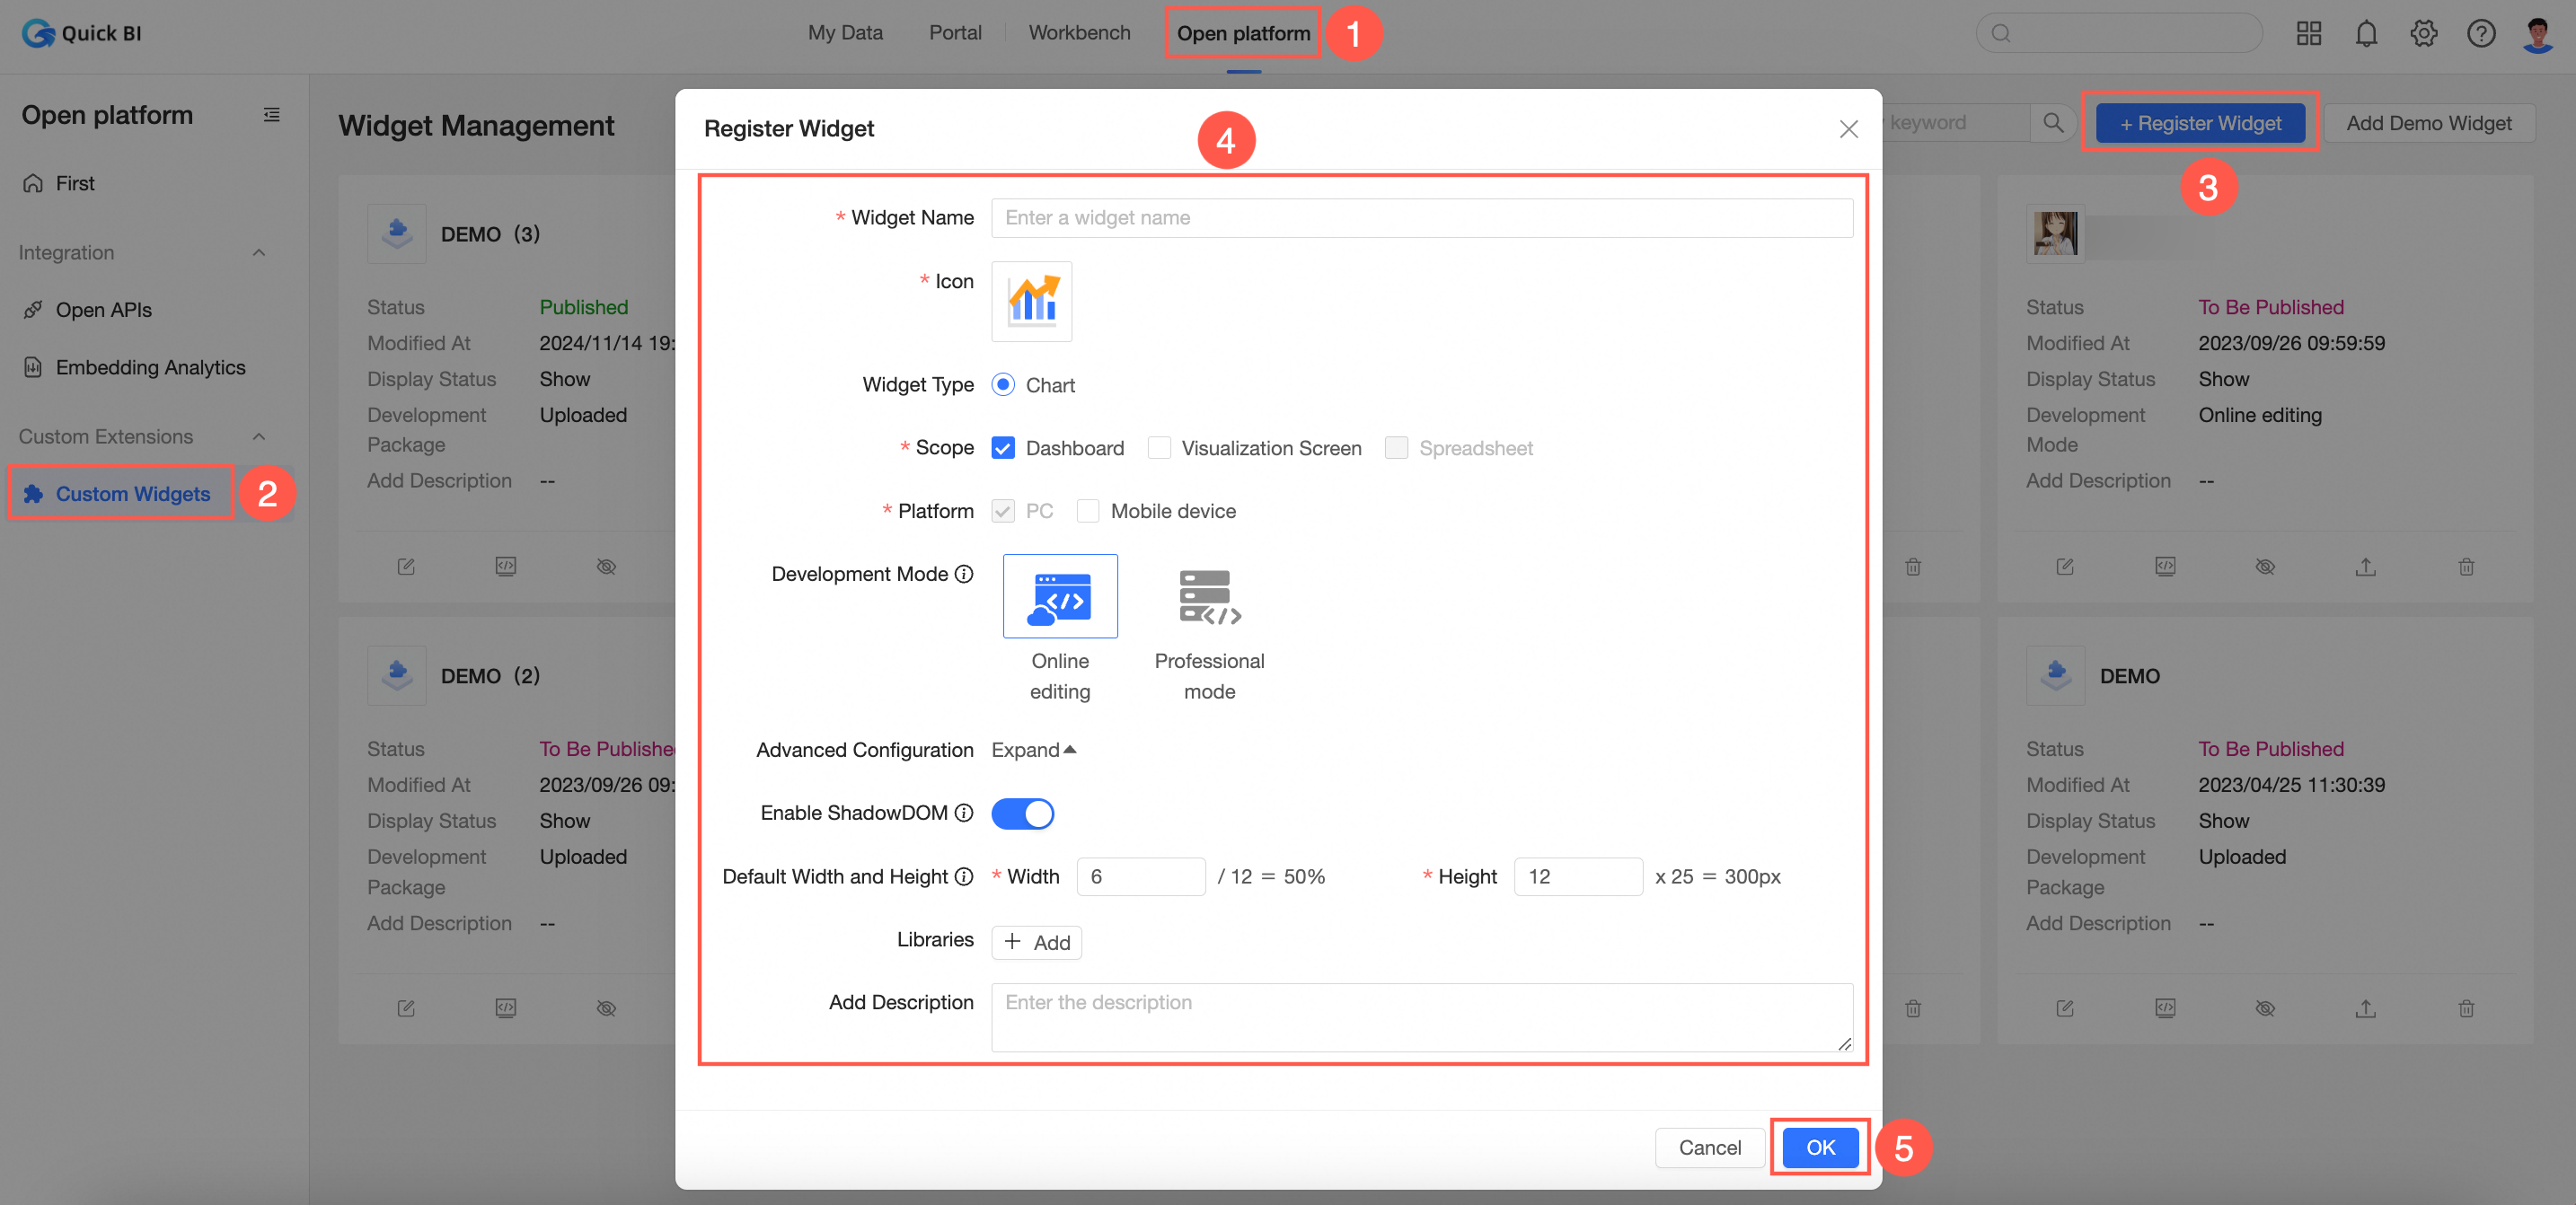
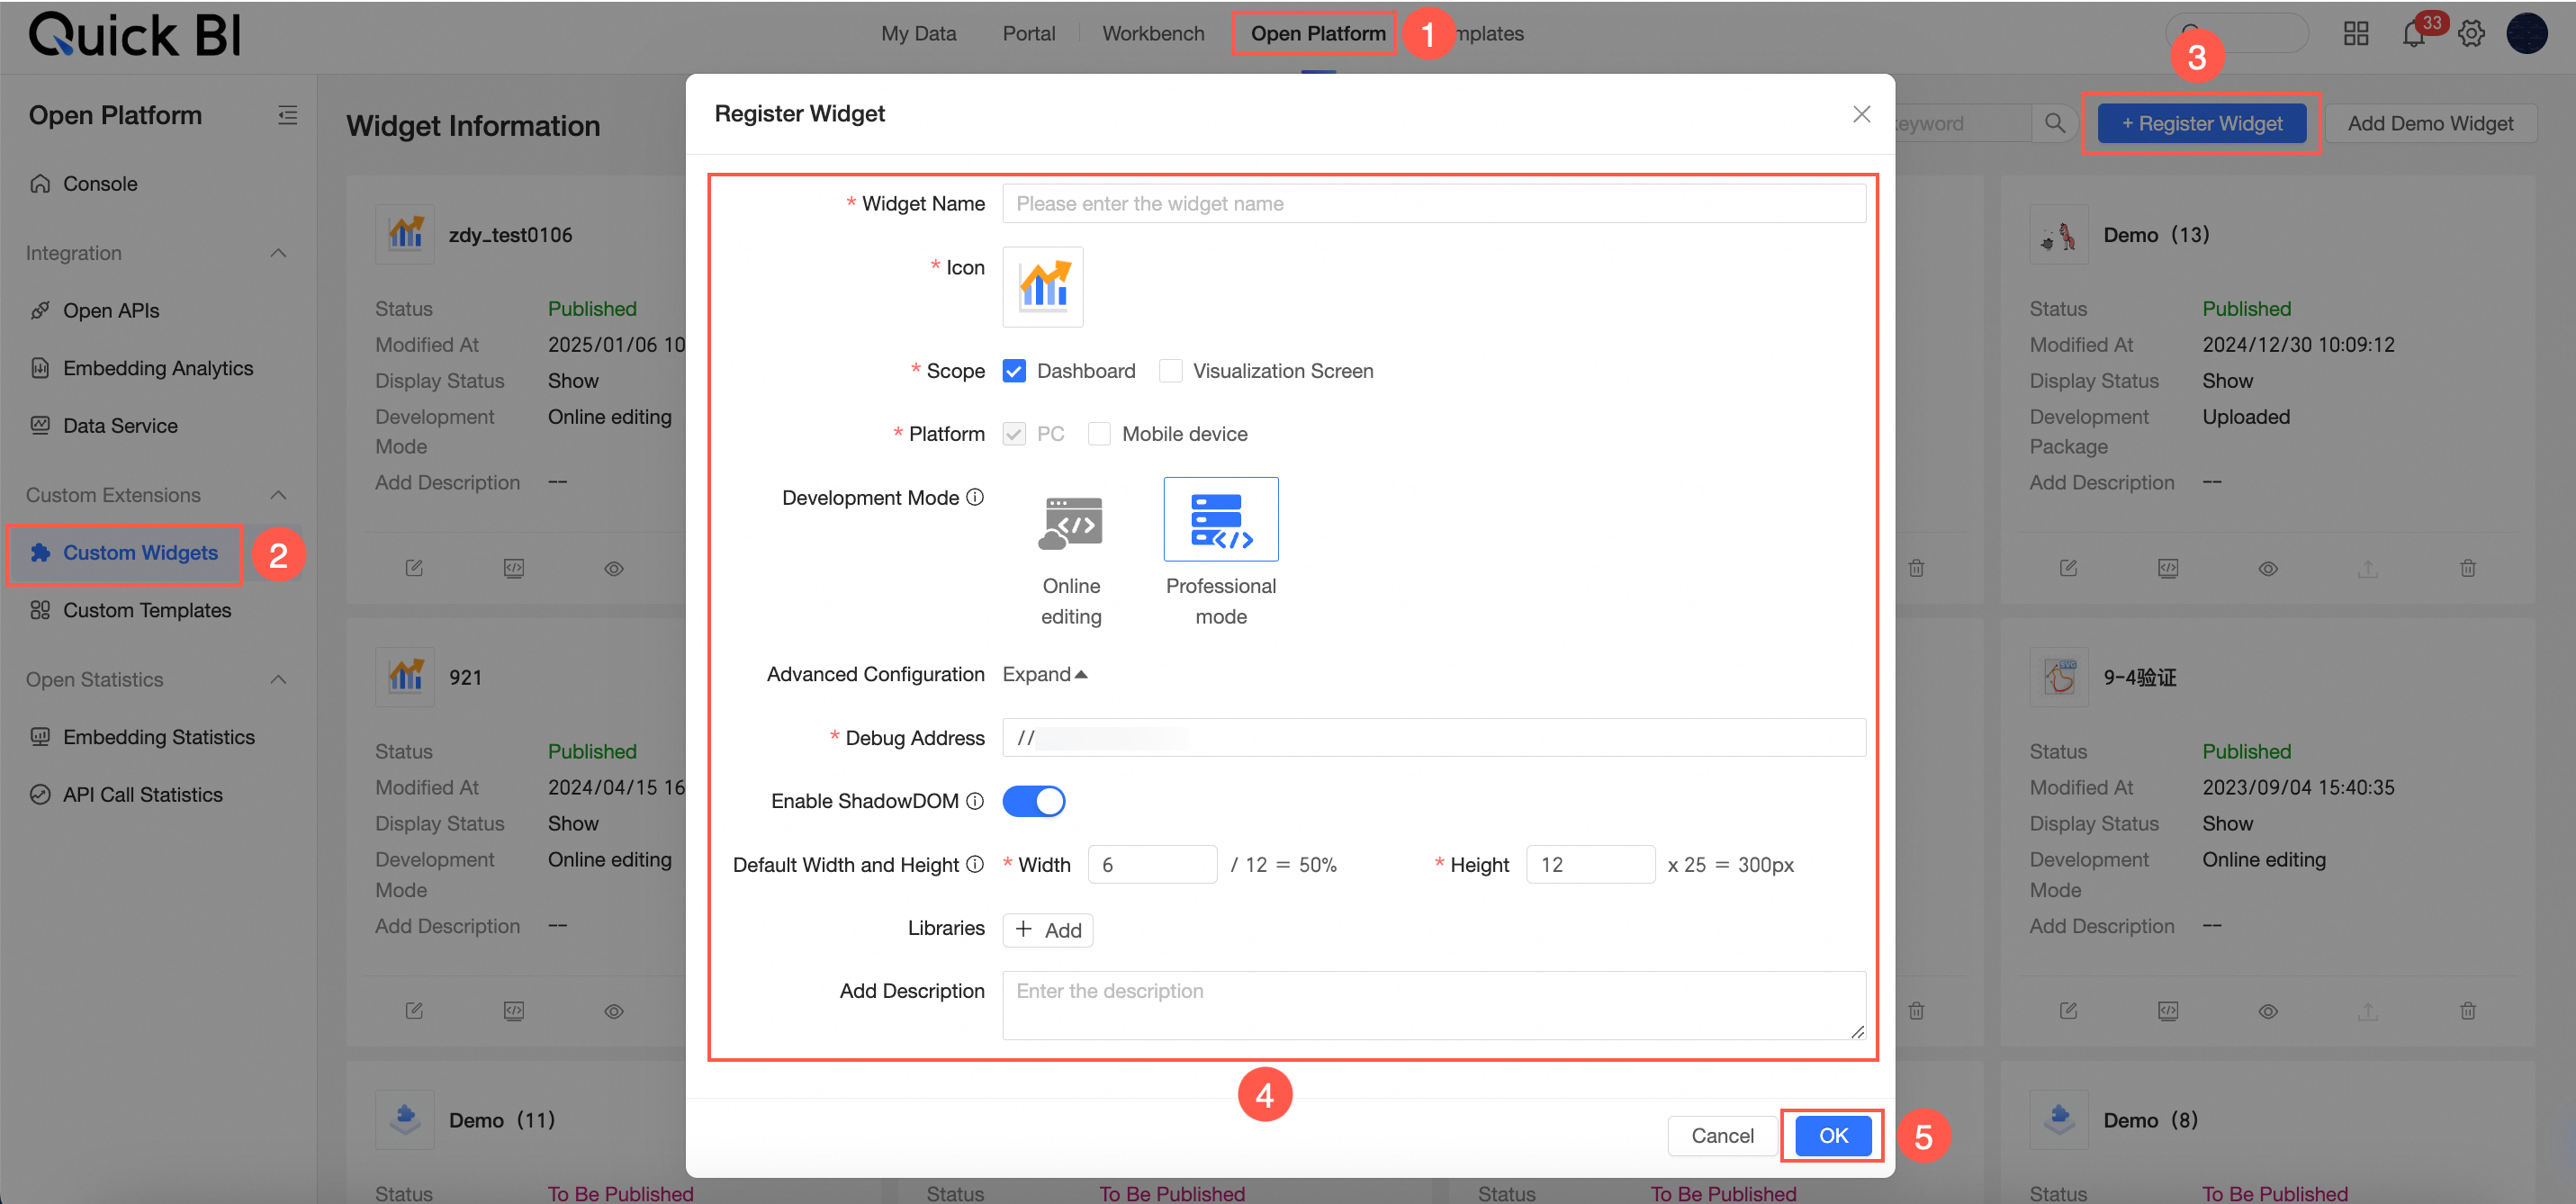
Navigate to Open Platform > Custom Components > Register Component, select online edit as the development mode, enter the required information, and click Confirm.
 Note
NoteYou can choose between online edit mode and professional mode based on your needs.
For more details, see Mode 1: Online Edit and Mode 2: Professional Mode.
In the Register Component dialog box, set the following parameters.
Interface Parameter Description
Parameter
Description
Component Name
You can customize the component name.
Icon
Supports uploading images from local as the component icon.
NoteThe image resolution must be greater than 60 pixels × 60 pixels and less than 180 pixels × 60 pixels.
The size of the image that you upload cannot exceed 100 KB.
Component Type
Supports adding components of chart type, chart card menu type, and workbook menu type.
Applicable Scope
Add the application scope of the component. Supports adding custom components of chart type in dashboards, data dashboards, and workbooks.
Development Mode
Online Edit: Edit and debug on the page. It offers lower difficulty and greater convenience.
Professional Mode: Use the SDK for local debugging. Suitable for complex component development scenarios.
Debug Address
The address used for debugging custom components.
NoteOnly professional mode requires a debug address.
Platform
Supports adding custom components to platforms, supporting both PC and mobile.
Enable Shadowdom
When enabled, the component DOM will enable ShadowDOM mode.
Default Width And Height
Set the width and height of the custom component.
Dependent Third-party Libraries
Optional. Fill in the CDN address to enhance component performance.
Remarks
Add remarks to the custom component.
Click Confirm.
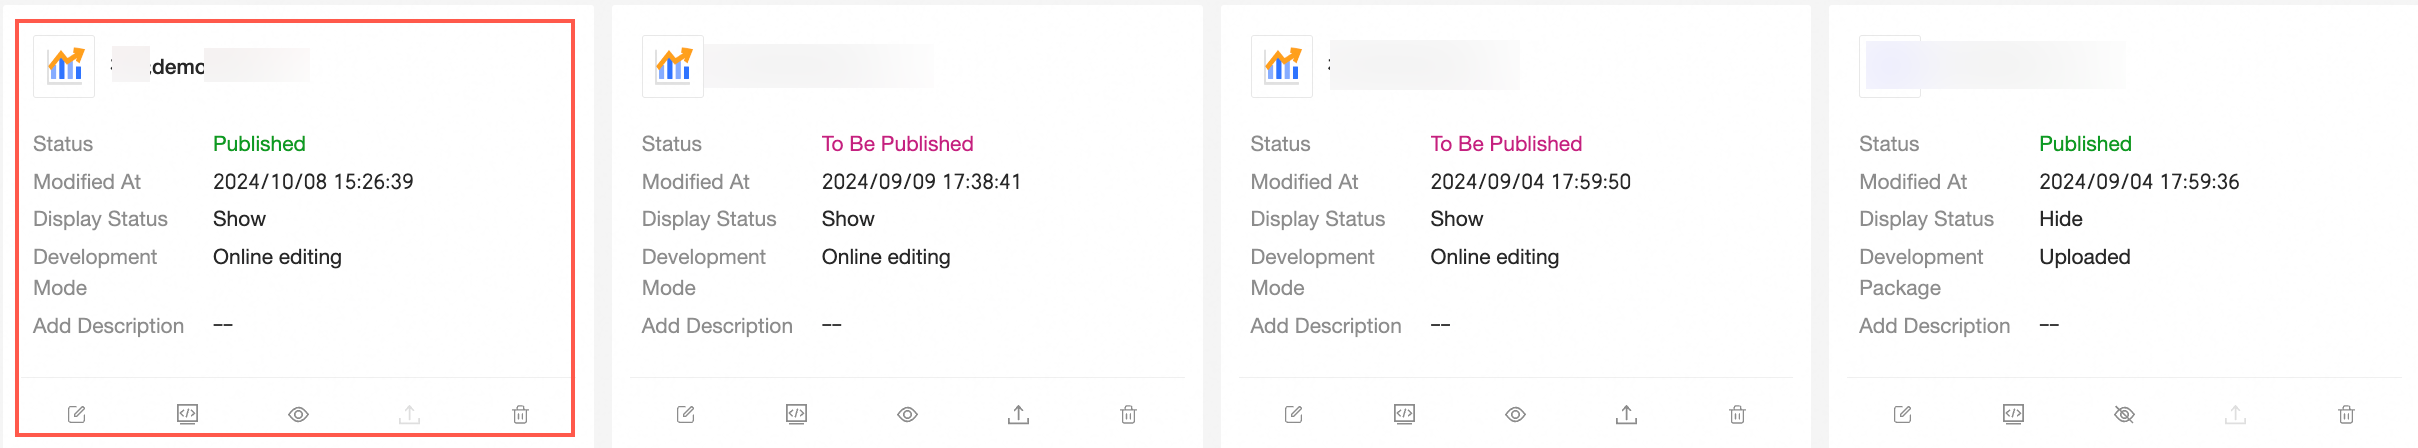
Your newly registered component will now appear on the component management page.
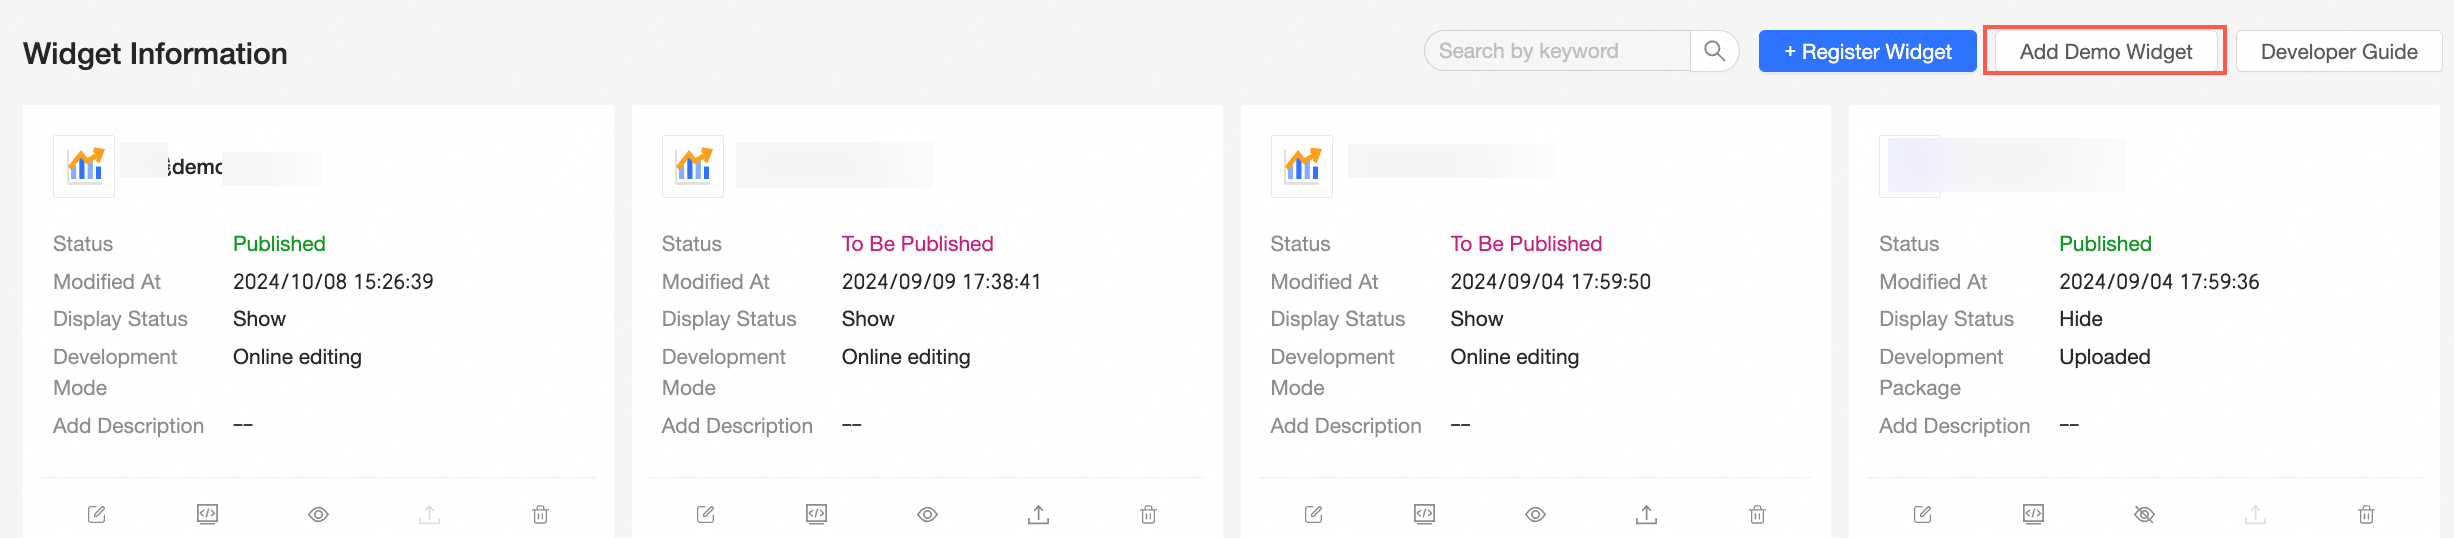
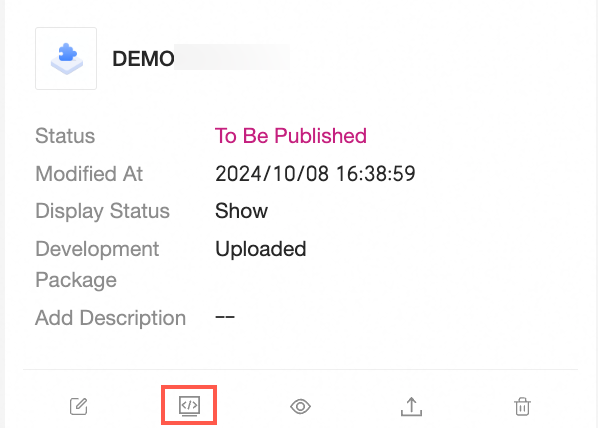
Add a demo component.
You can quickly create a custom component by directly clicking "Add Demo Component."
The preset configuration for this Demo custom component is as follows:
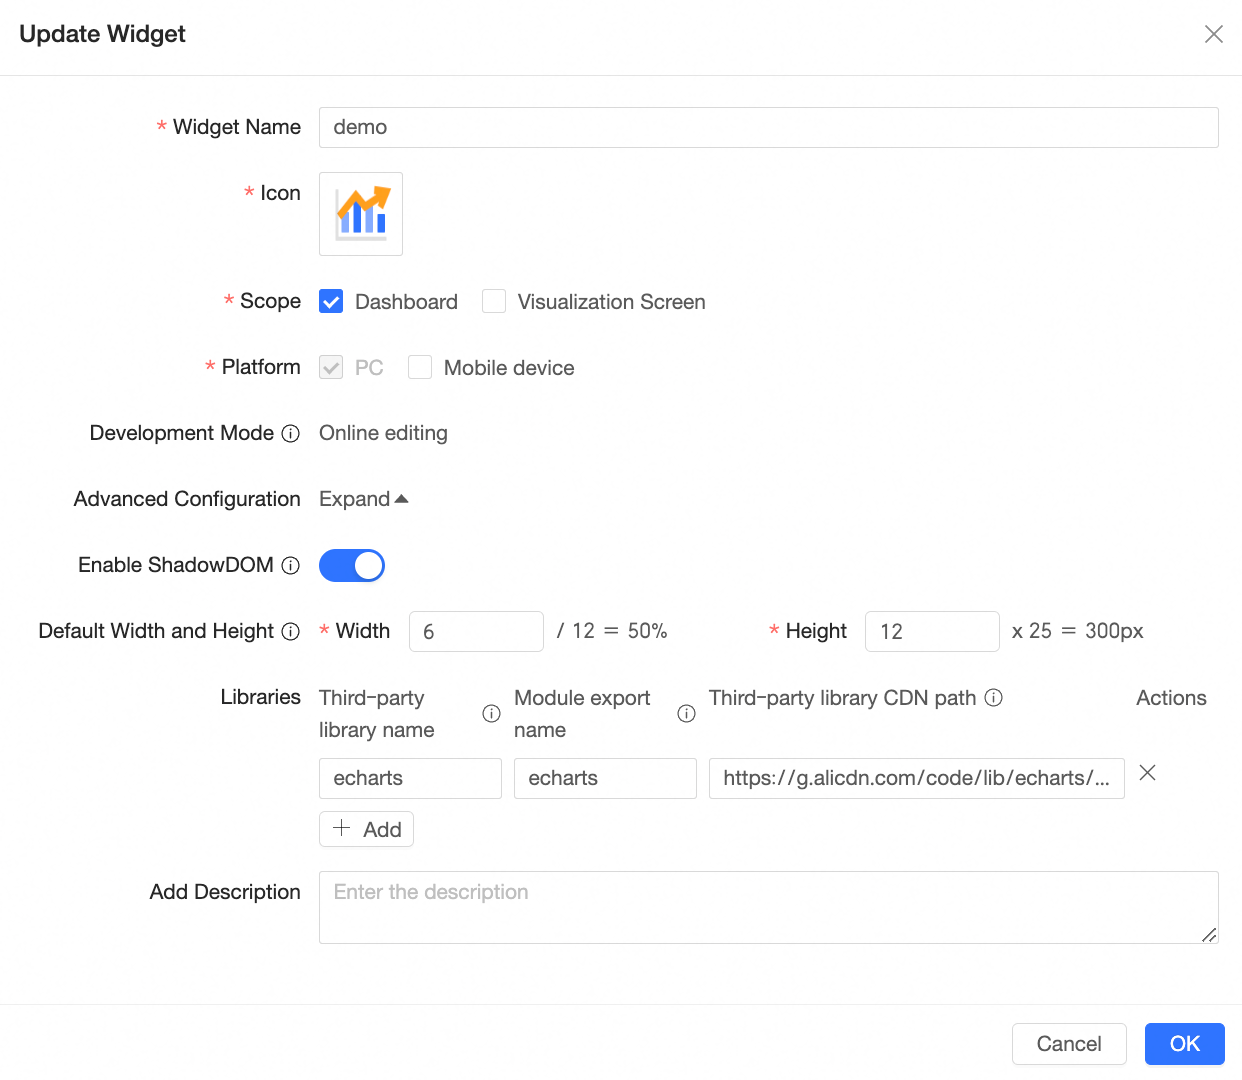
This custom component, developed through online editing, features a rounded corner ring chart built on echarts. It has been integrated into Quick BI by registering the Demo component, with the display effect shown below:
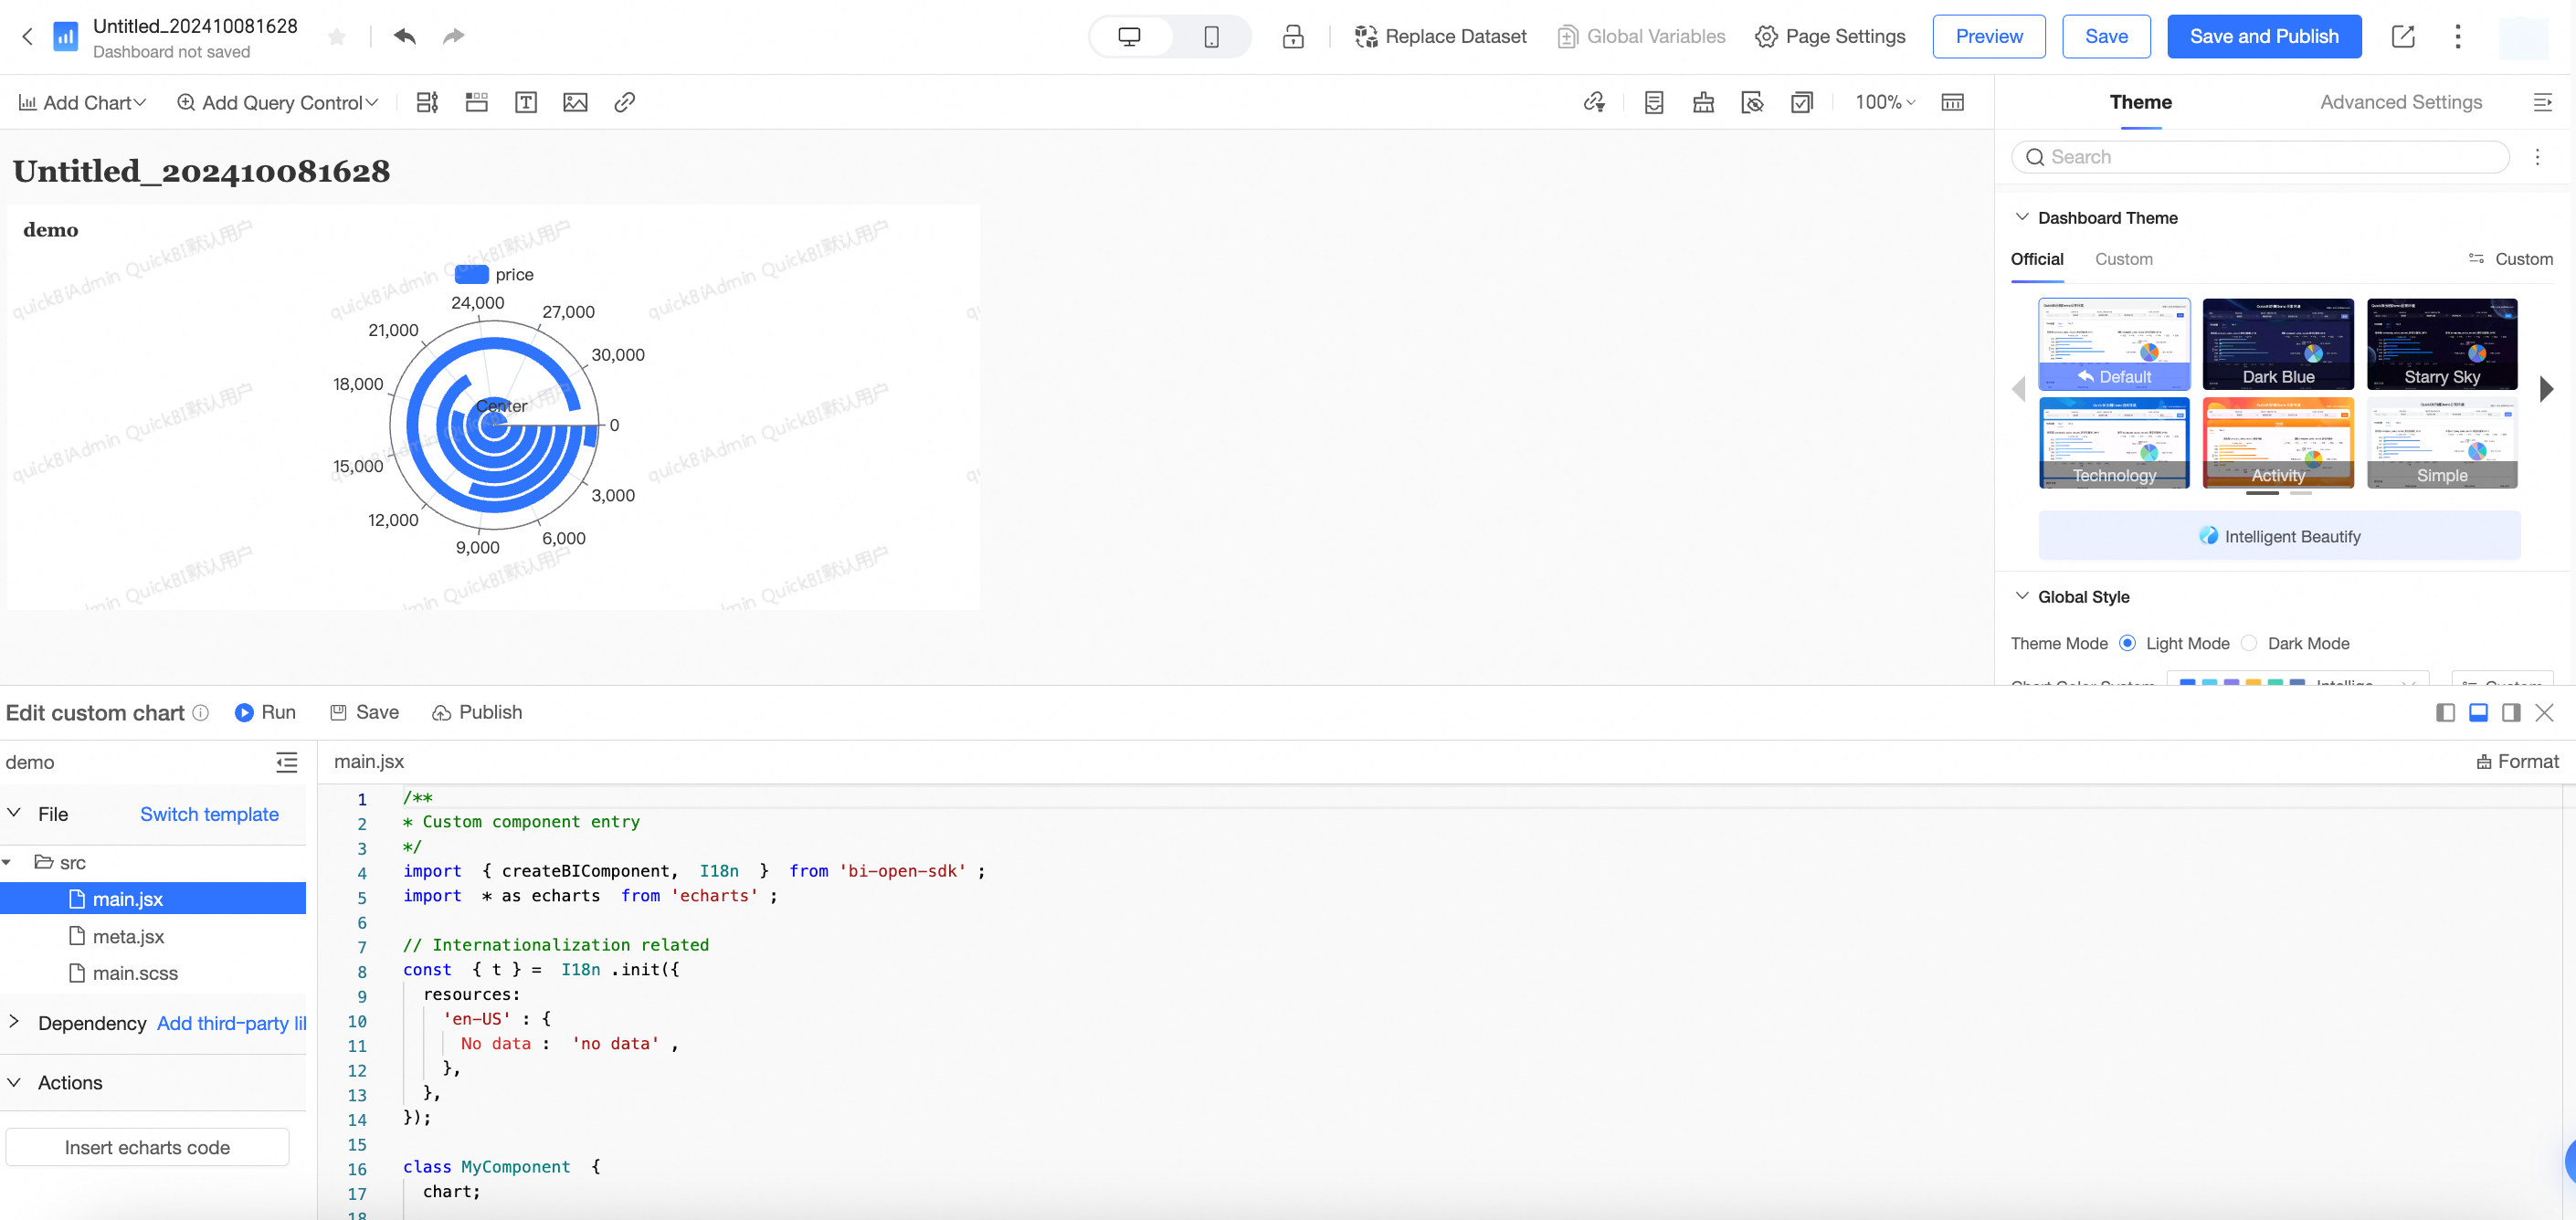
You can manage and utilize this Demo custom component directly, or modify it to meet your specific needs.
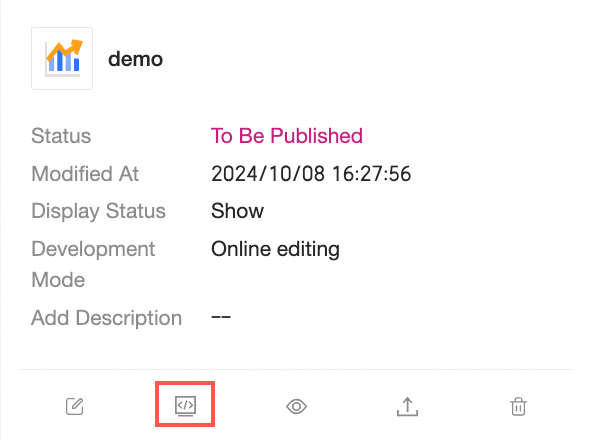
2. Debug Component
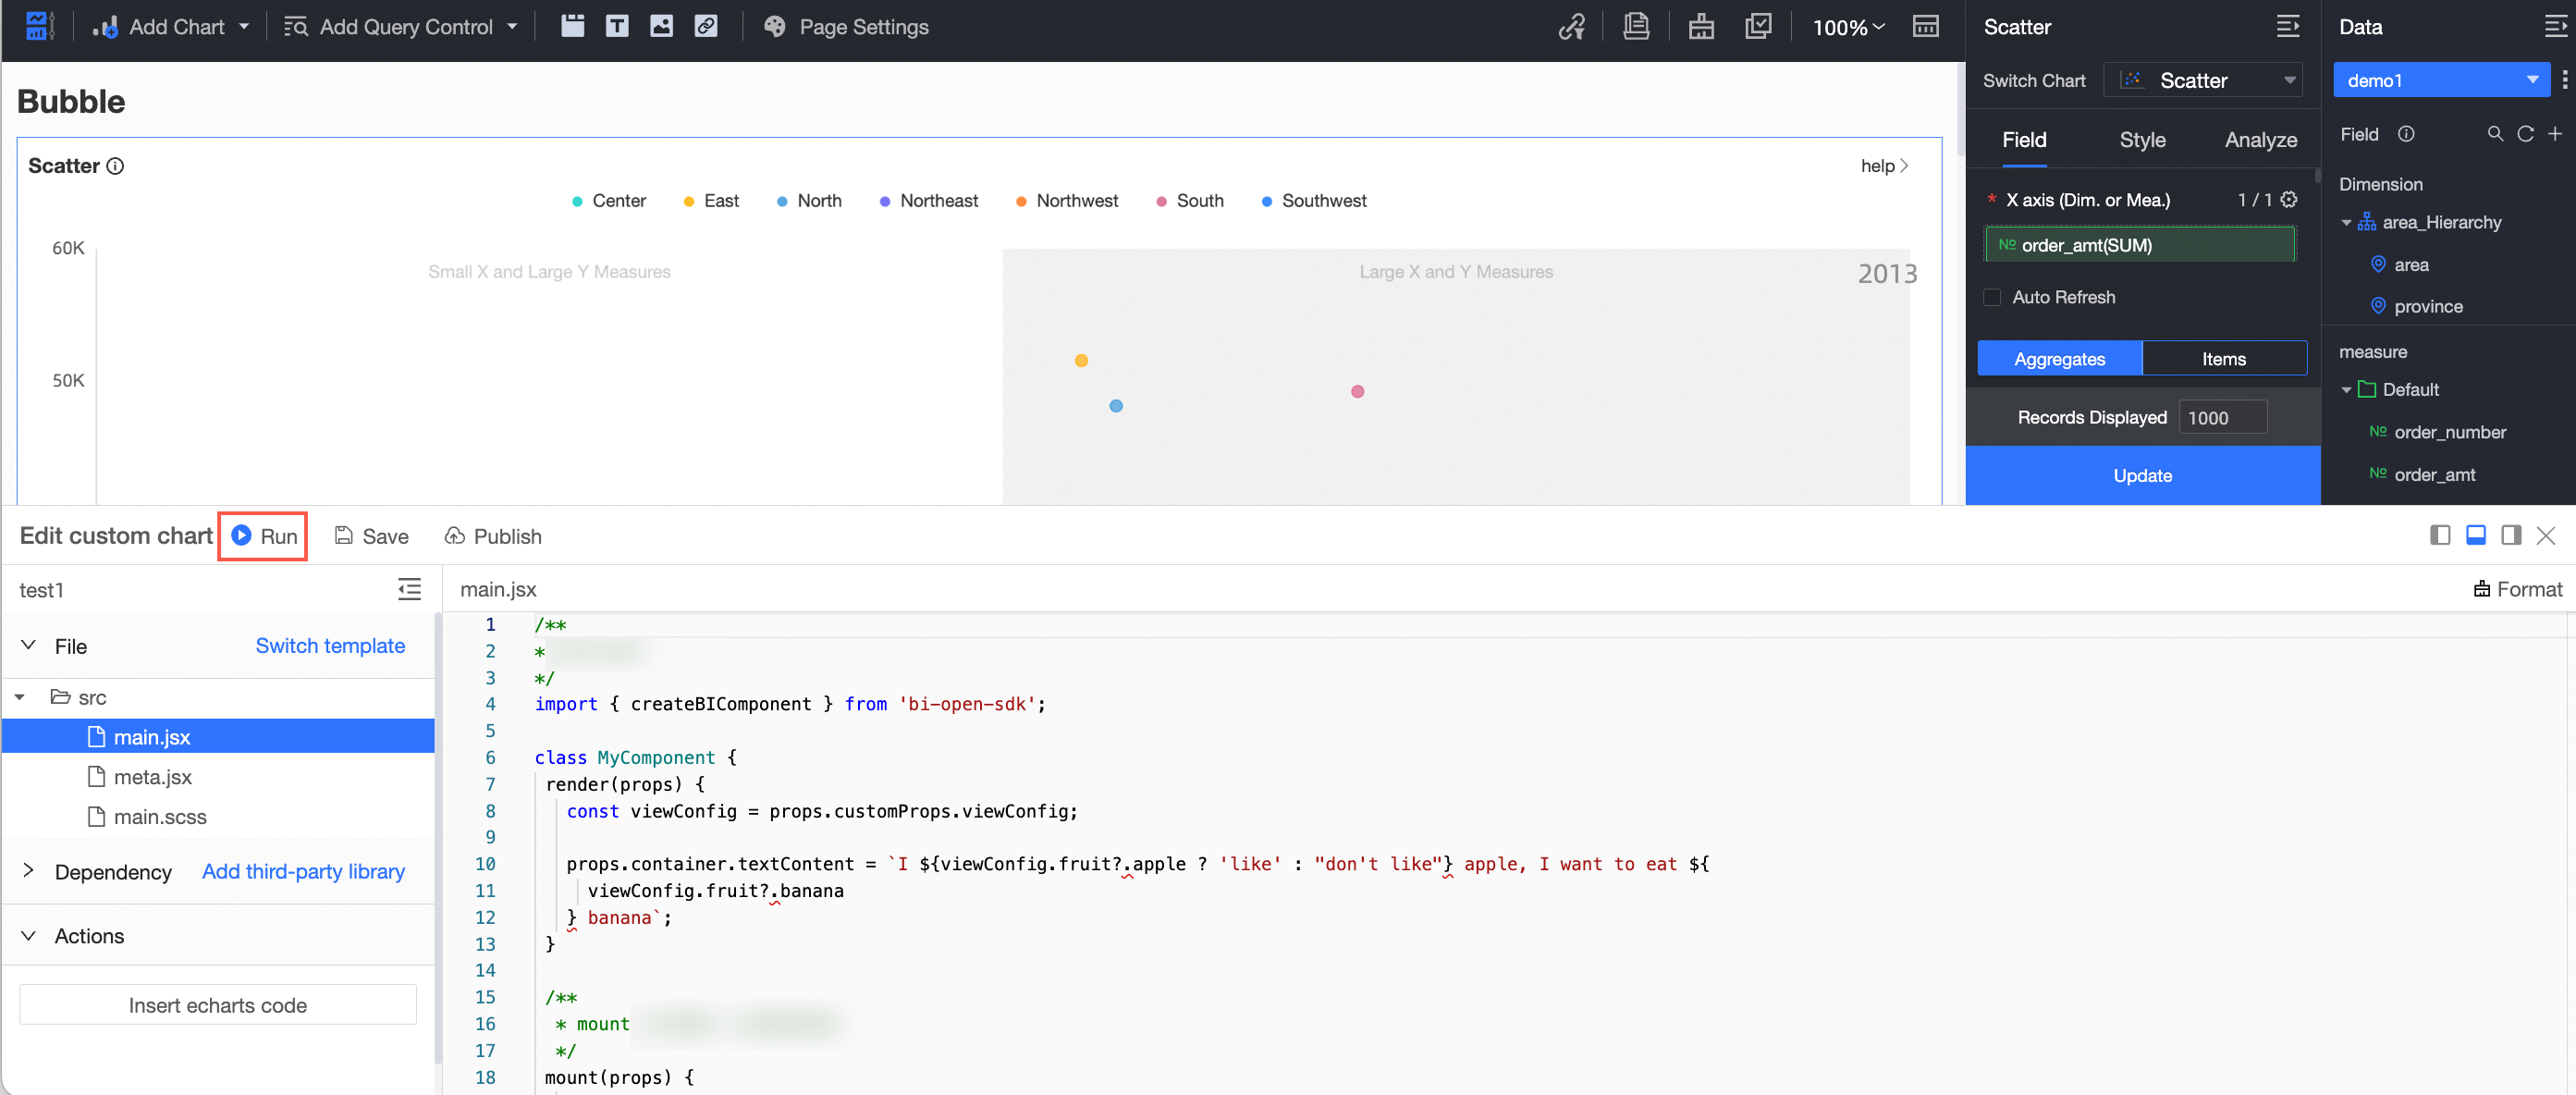
After registering the component, click the Debug Component icon on the component card to start debugging.
In the dialog box that appears, select the debug range, workspace, and the dashboard you want to debug, then click Go to Debug.
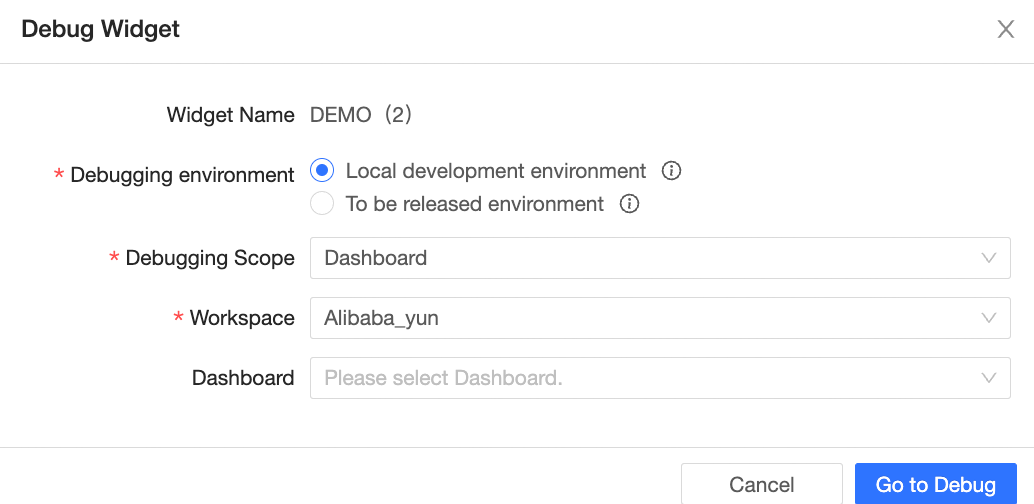
You will be taken to the dashboard edit page, where you can develop custom components.
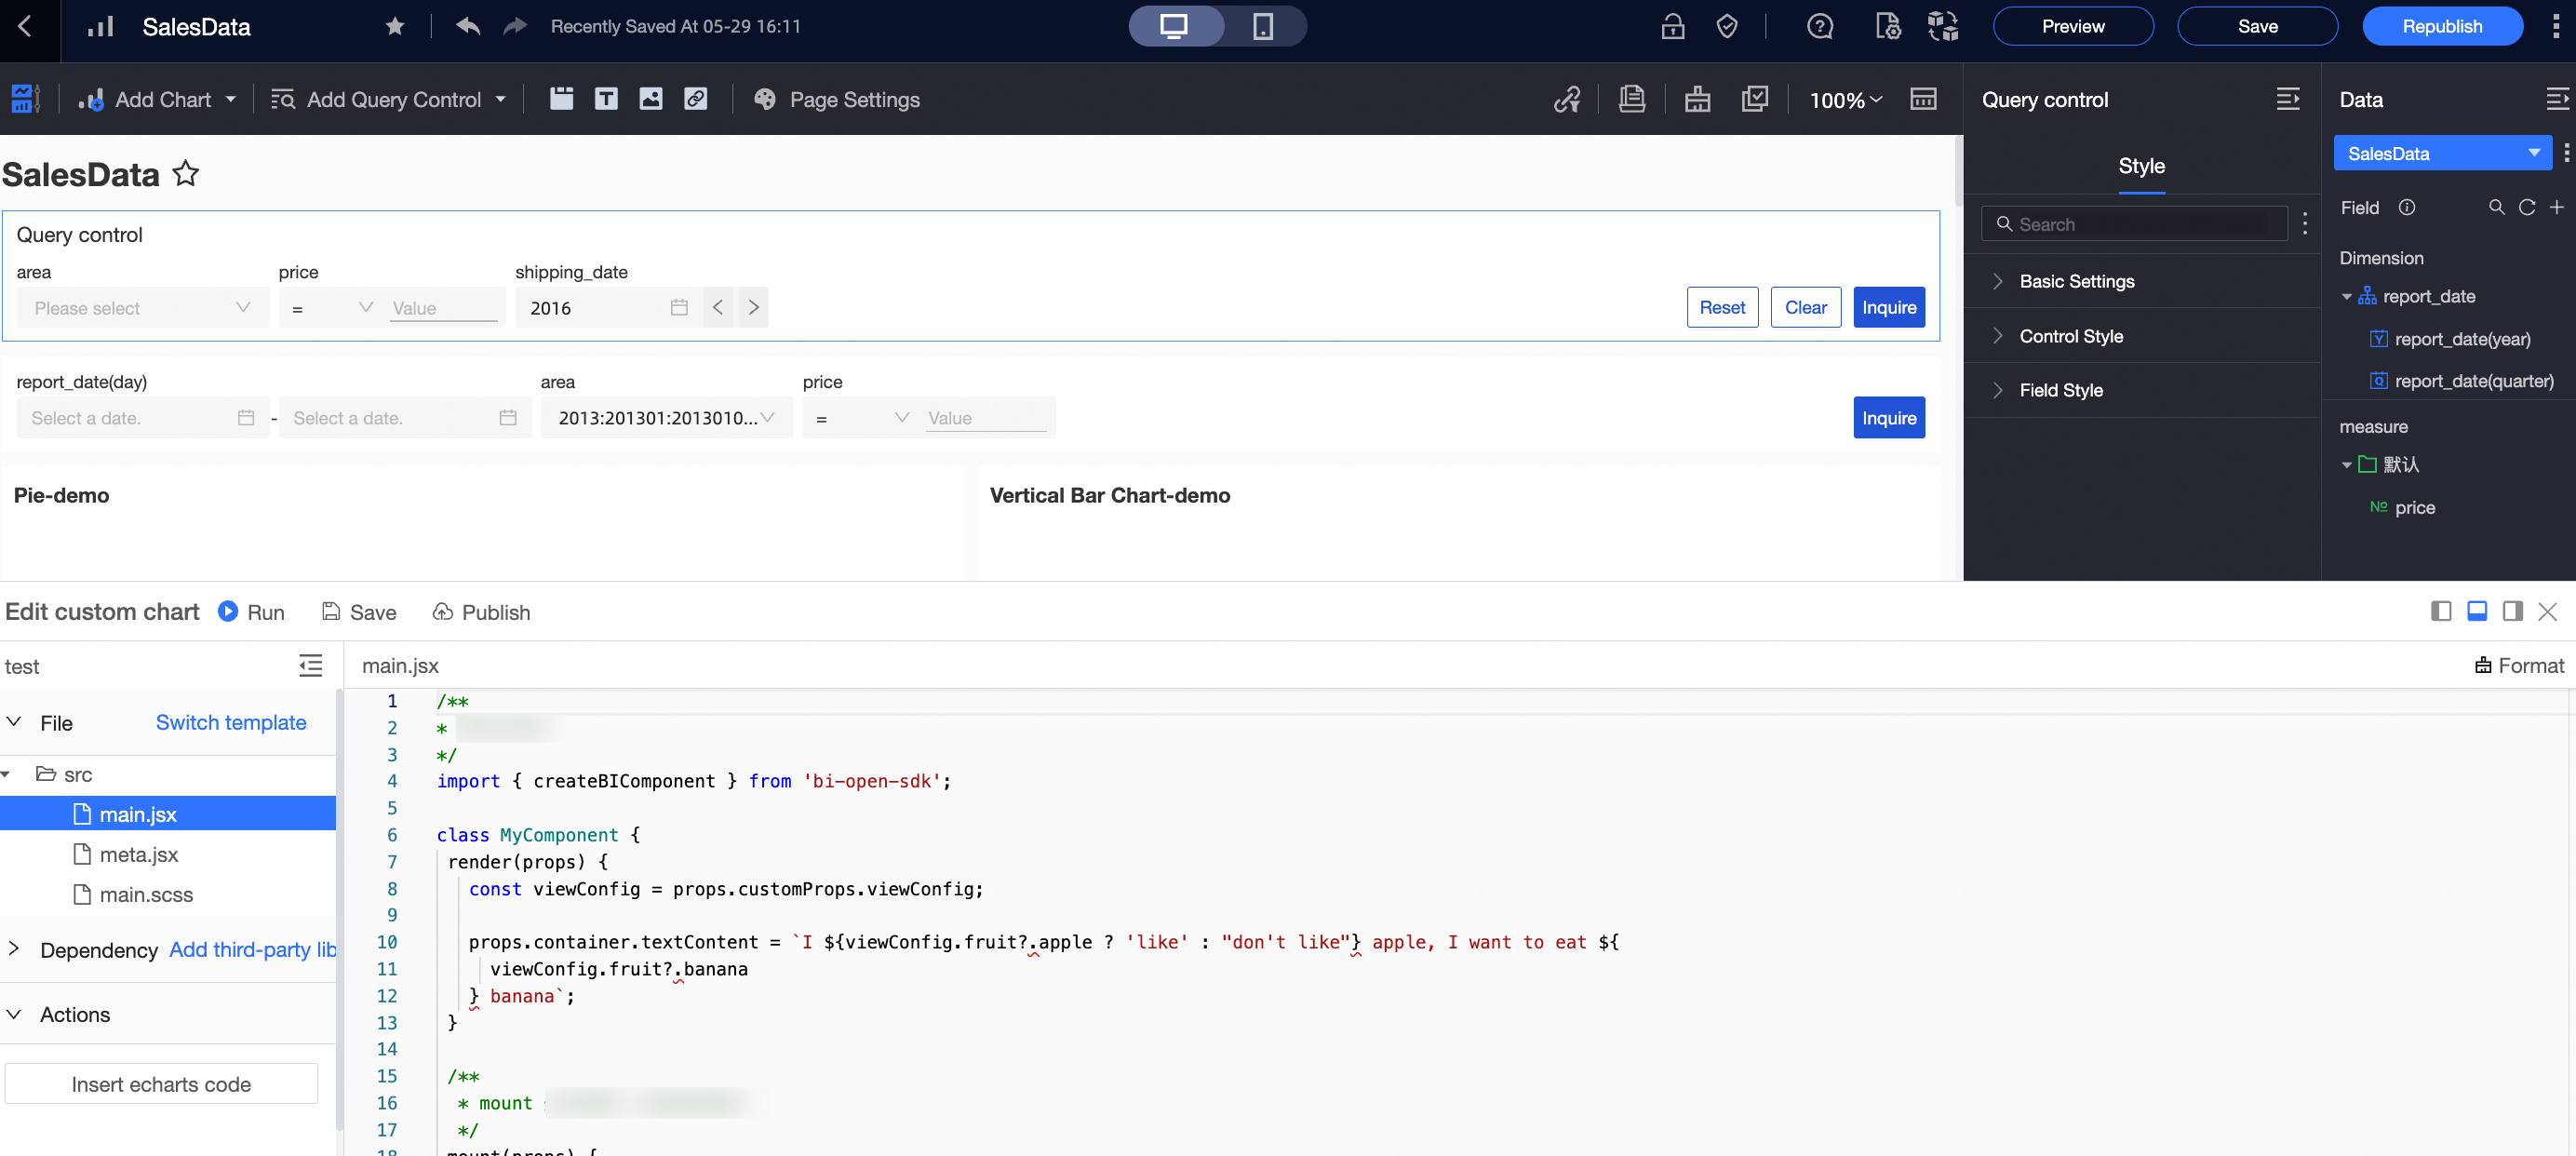
The chart effect after debugging is as follows:
Mode 2. Professional Mode
Professional mode involves developing and debugging custom components in a local environment. This mode requires you to first install and configure the local environment and is suited for more complex component development.
1. Install Environment
Before starting development, install the following software:
node.js
Visit the node.js official website, download and install the Node environment (node16 version is recommended). Verify the installation with the following command.
node -vgit
Visit the Git official website, download and install git. Confirm the installation with the following command.
git --versionyarn
Quick BI recommends using yarn for dependency installation. Follow these steps to install yarn:
npm i -g yarn3.1 yarn Mirror
The default yarn mirror may be slow in China. Using the Taobao mirror is recommended.
yarn config set registry https://registry.npm.taobao.org/vscode
Quick BI suggests using Visual Studio Code as the IDE. The Quick BI seed project utilizes
TypeScript, and vscode is recommended for the best development experience.
2. Create Development Project
Open the terminal or PowerShell and navigate to your desired project directory.
Run the following command to initiate the project:
npm init qbi-app testYou will be prompted to select a template as shown below.
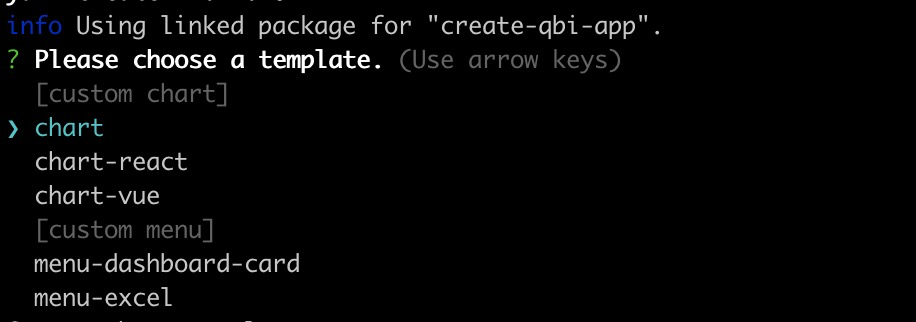
chartprefixed templates are for Custom Chart templates.menuprefixed templates are for Custom Menu templates.
Use the
-tparameter to specify a template during creation.# Create a "custom chart" template npm init qbi-app test -t chartNavigate to the project directory and install the dependencies.
cd test
yarn
Launch the local service.
yarn run startUpon successful startup, the following message will appear.
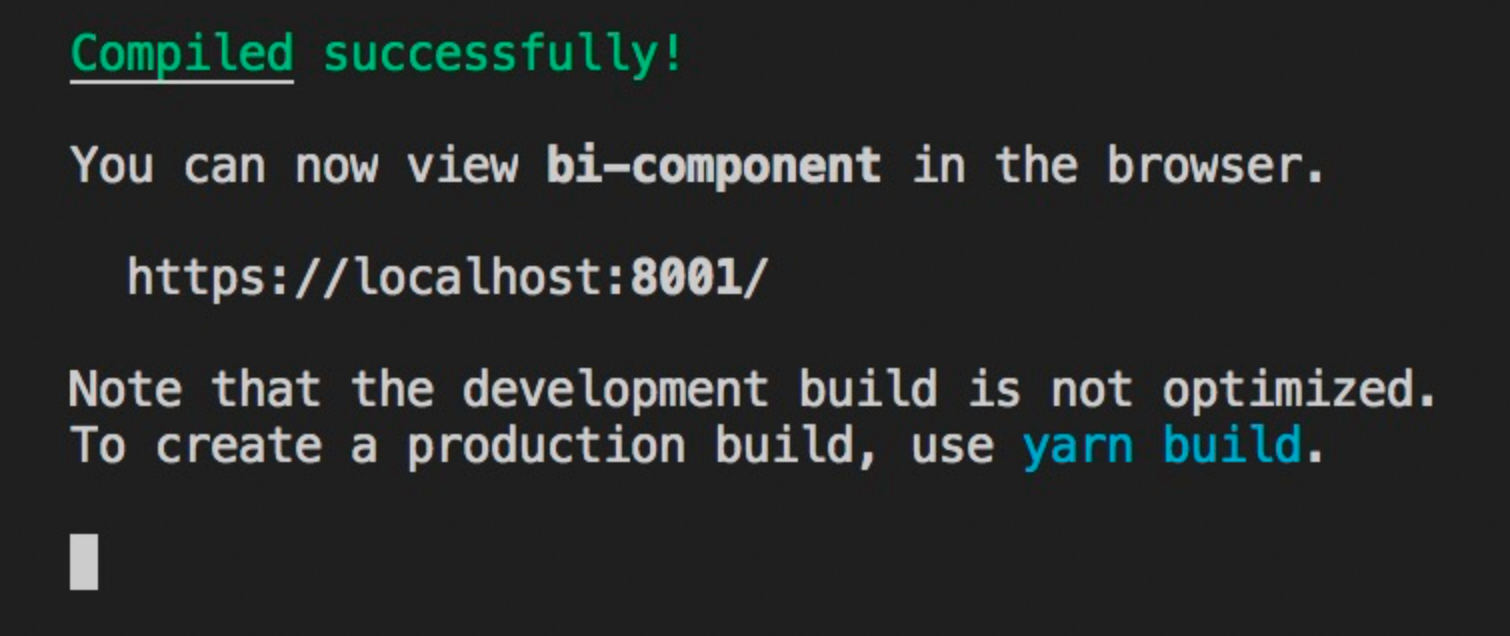
If Google Chrome does not open automatically, install Chrome and manually navigate to localhost:8001/ using the browser.
If you encounter a port conflict, another application may be using port 8001.
If localhost:8001/ shows no service, ensure your computer's hosts file maps localhost to 127.0.0.1. Alternatively, access 127.0.0.1:8001/ in Chrome to preview the component.
If you encounter an
httpscertificate issue on first access, refer to the FAQ for assistance.
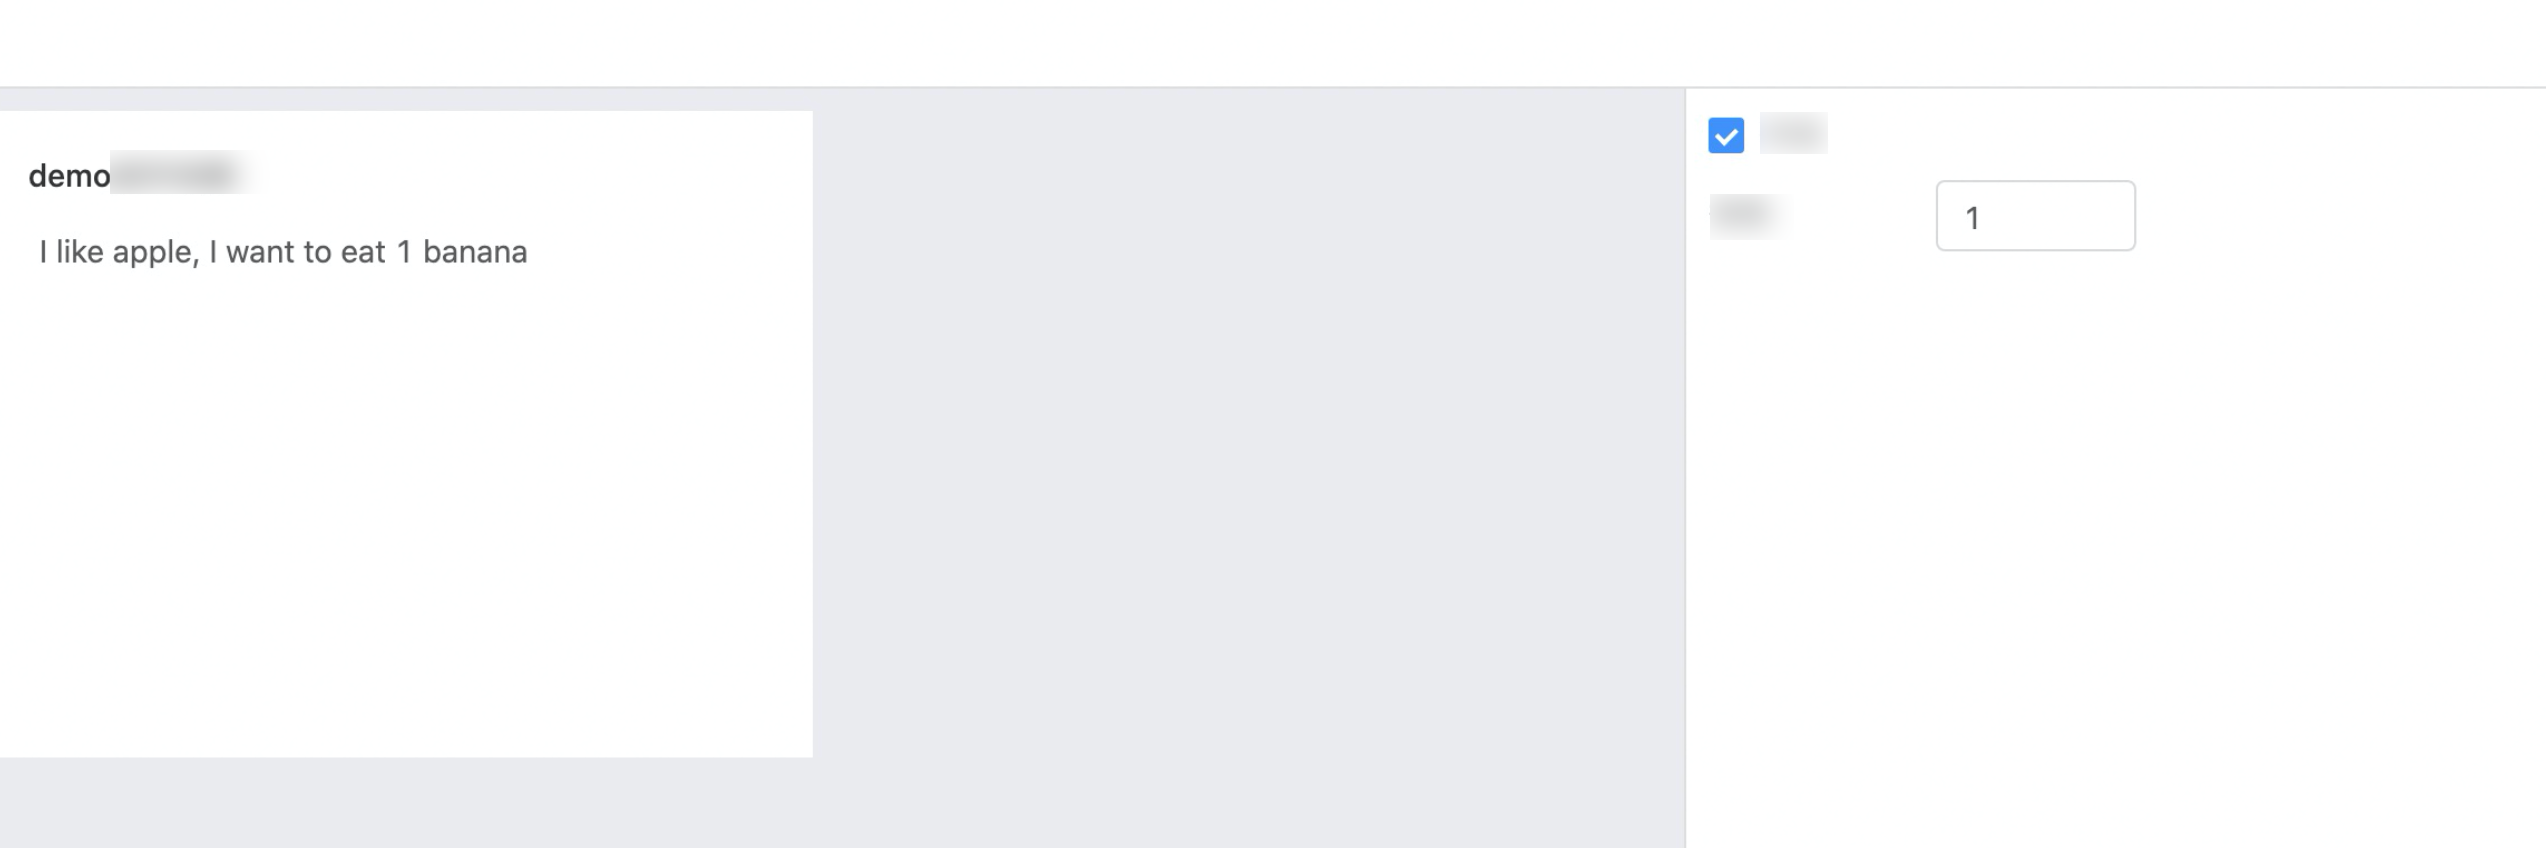
Enter 127.0.0.1:8001/ in your local browser.
The following interface indicates a successful start of the local service.
 Note
NoteEnsure the local service is running throughout the debugging process.
3. Debug Components in Quick BI Dashboard
Register Component
Begin by registering acustom component.
Go to Open Platform > Custom Components > Register Component, choose professional mode as your development mode, provide the necessary details, and click Confirm.
 Note
NoteDependent third-party libraries are optional. Leave this field blank if there are no performance issues with the component.
Debug Component
Click the Debug Component icon on the component card.
In the dialog that appears, select the debug range, workspace, and the dashboard page you want to debug, then click Go to Debug.

On the dashboard edit page that opens, click Add Chart > Custom, and your created custom component will be visible.
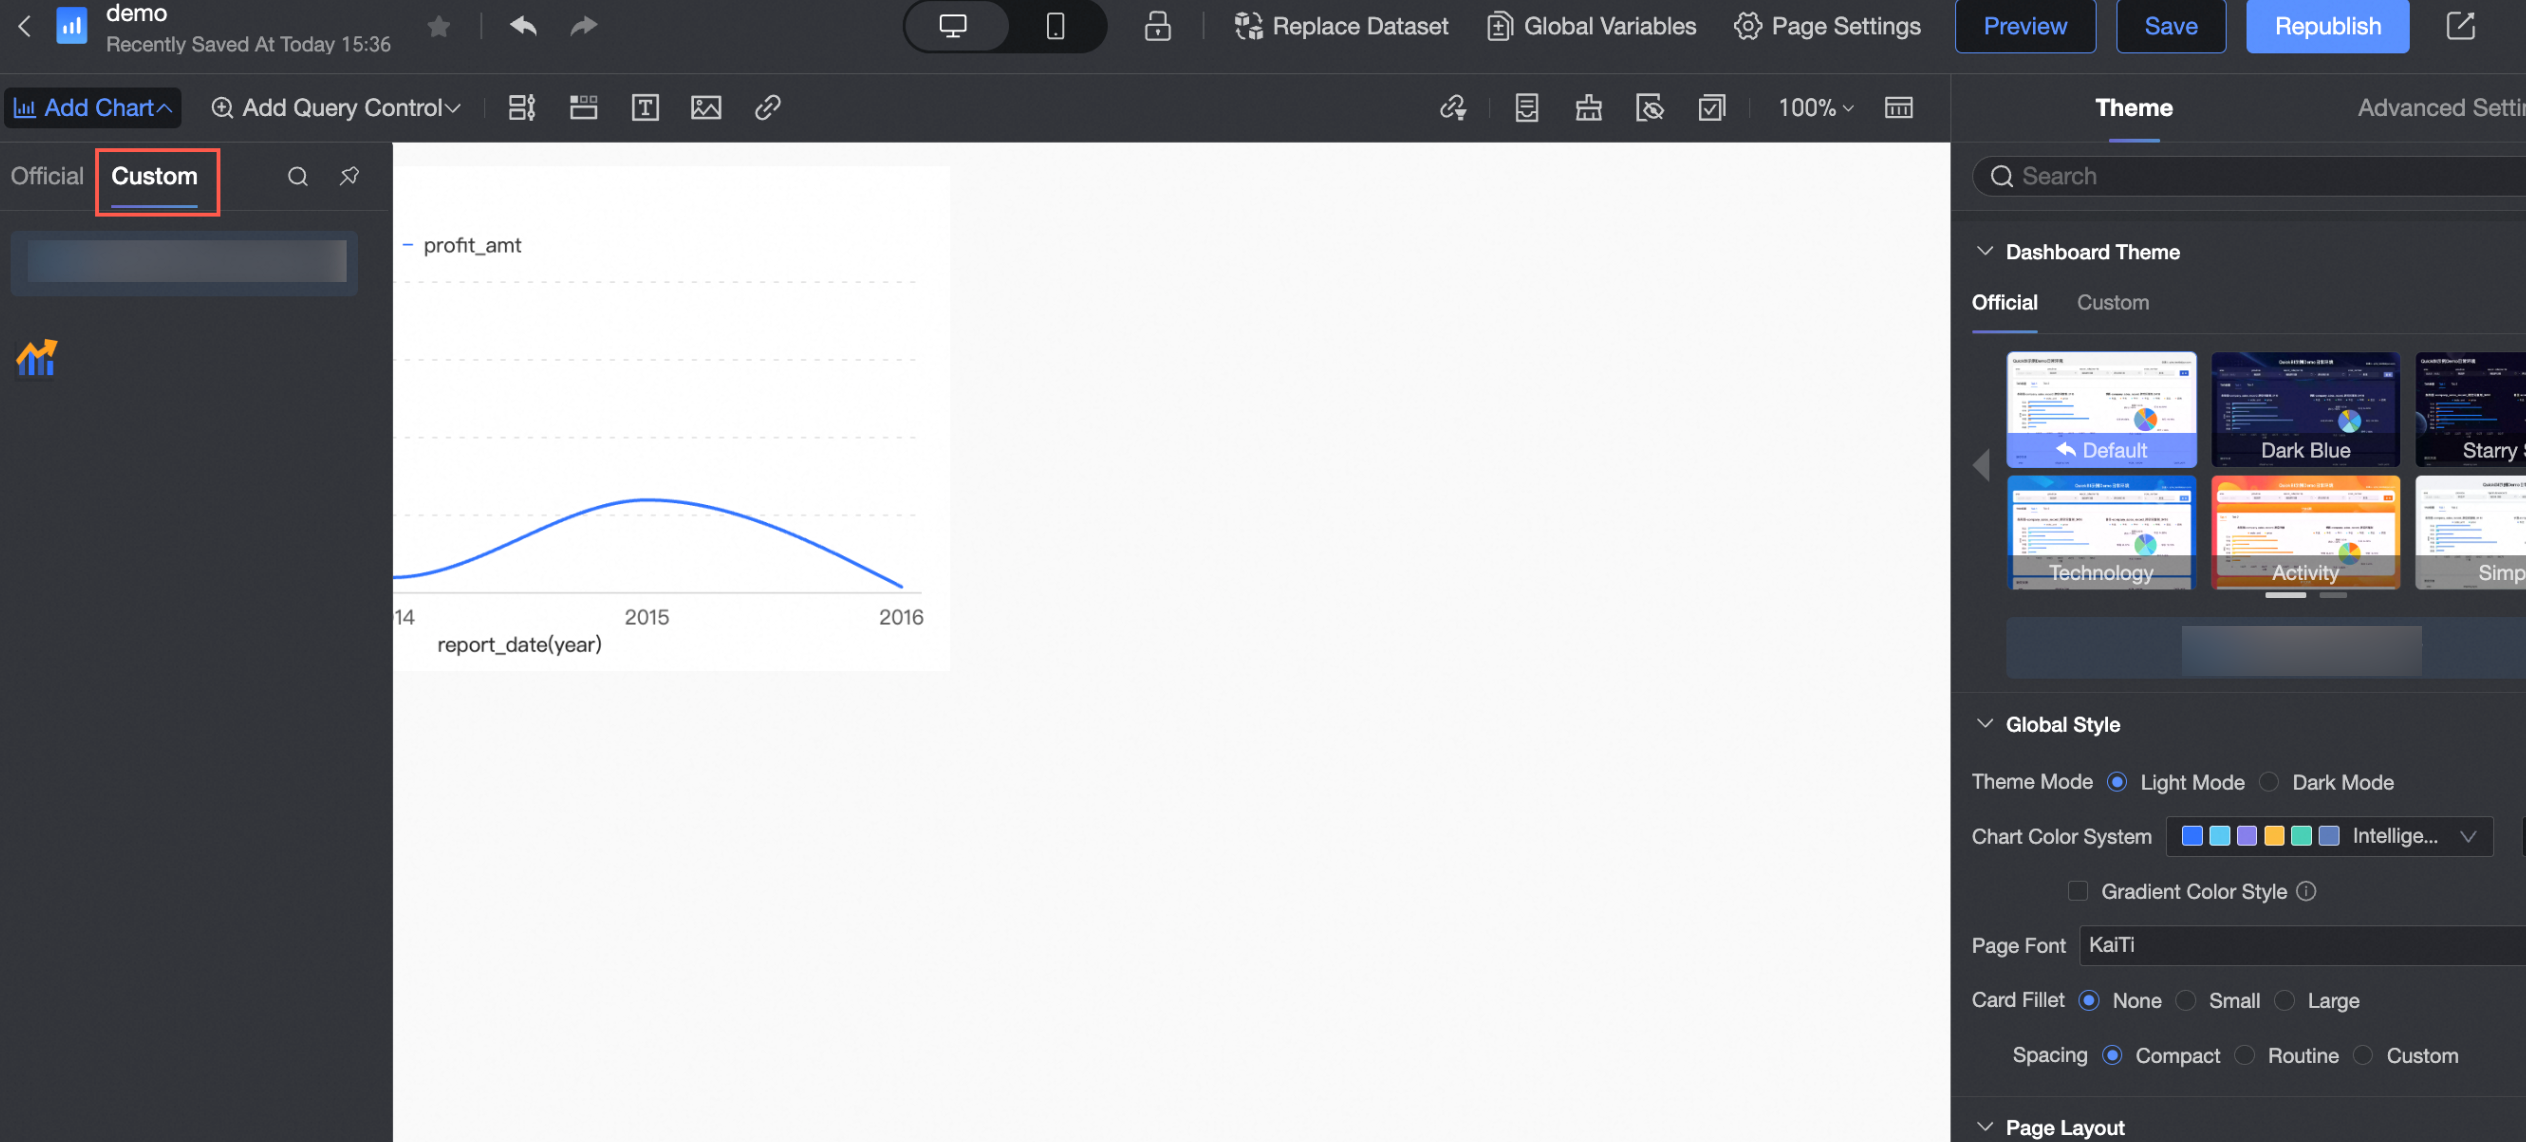
You can now proceed with the development and debugging of your custom components as needed.