This topic describes the features of Quick BI V4.5.3.
Release date
April 04, 2023
Connection
Data source connection links are newly upgraded.

For more information, see Create a database data source.
Impala data sources support 3.x.
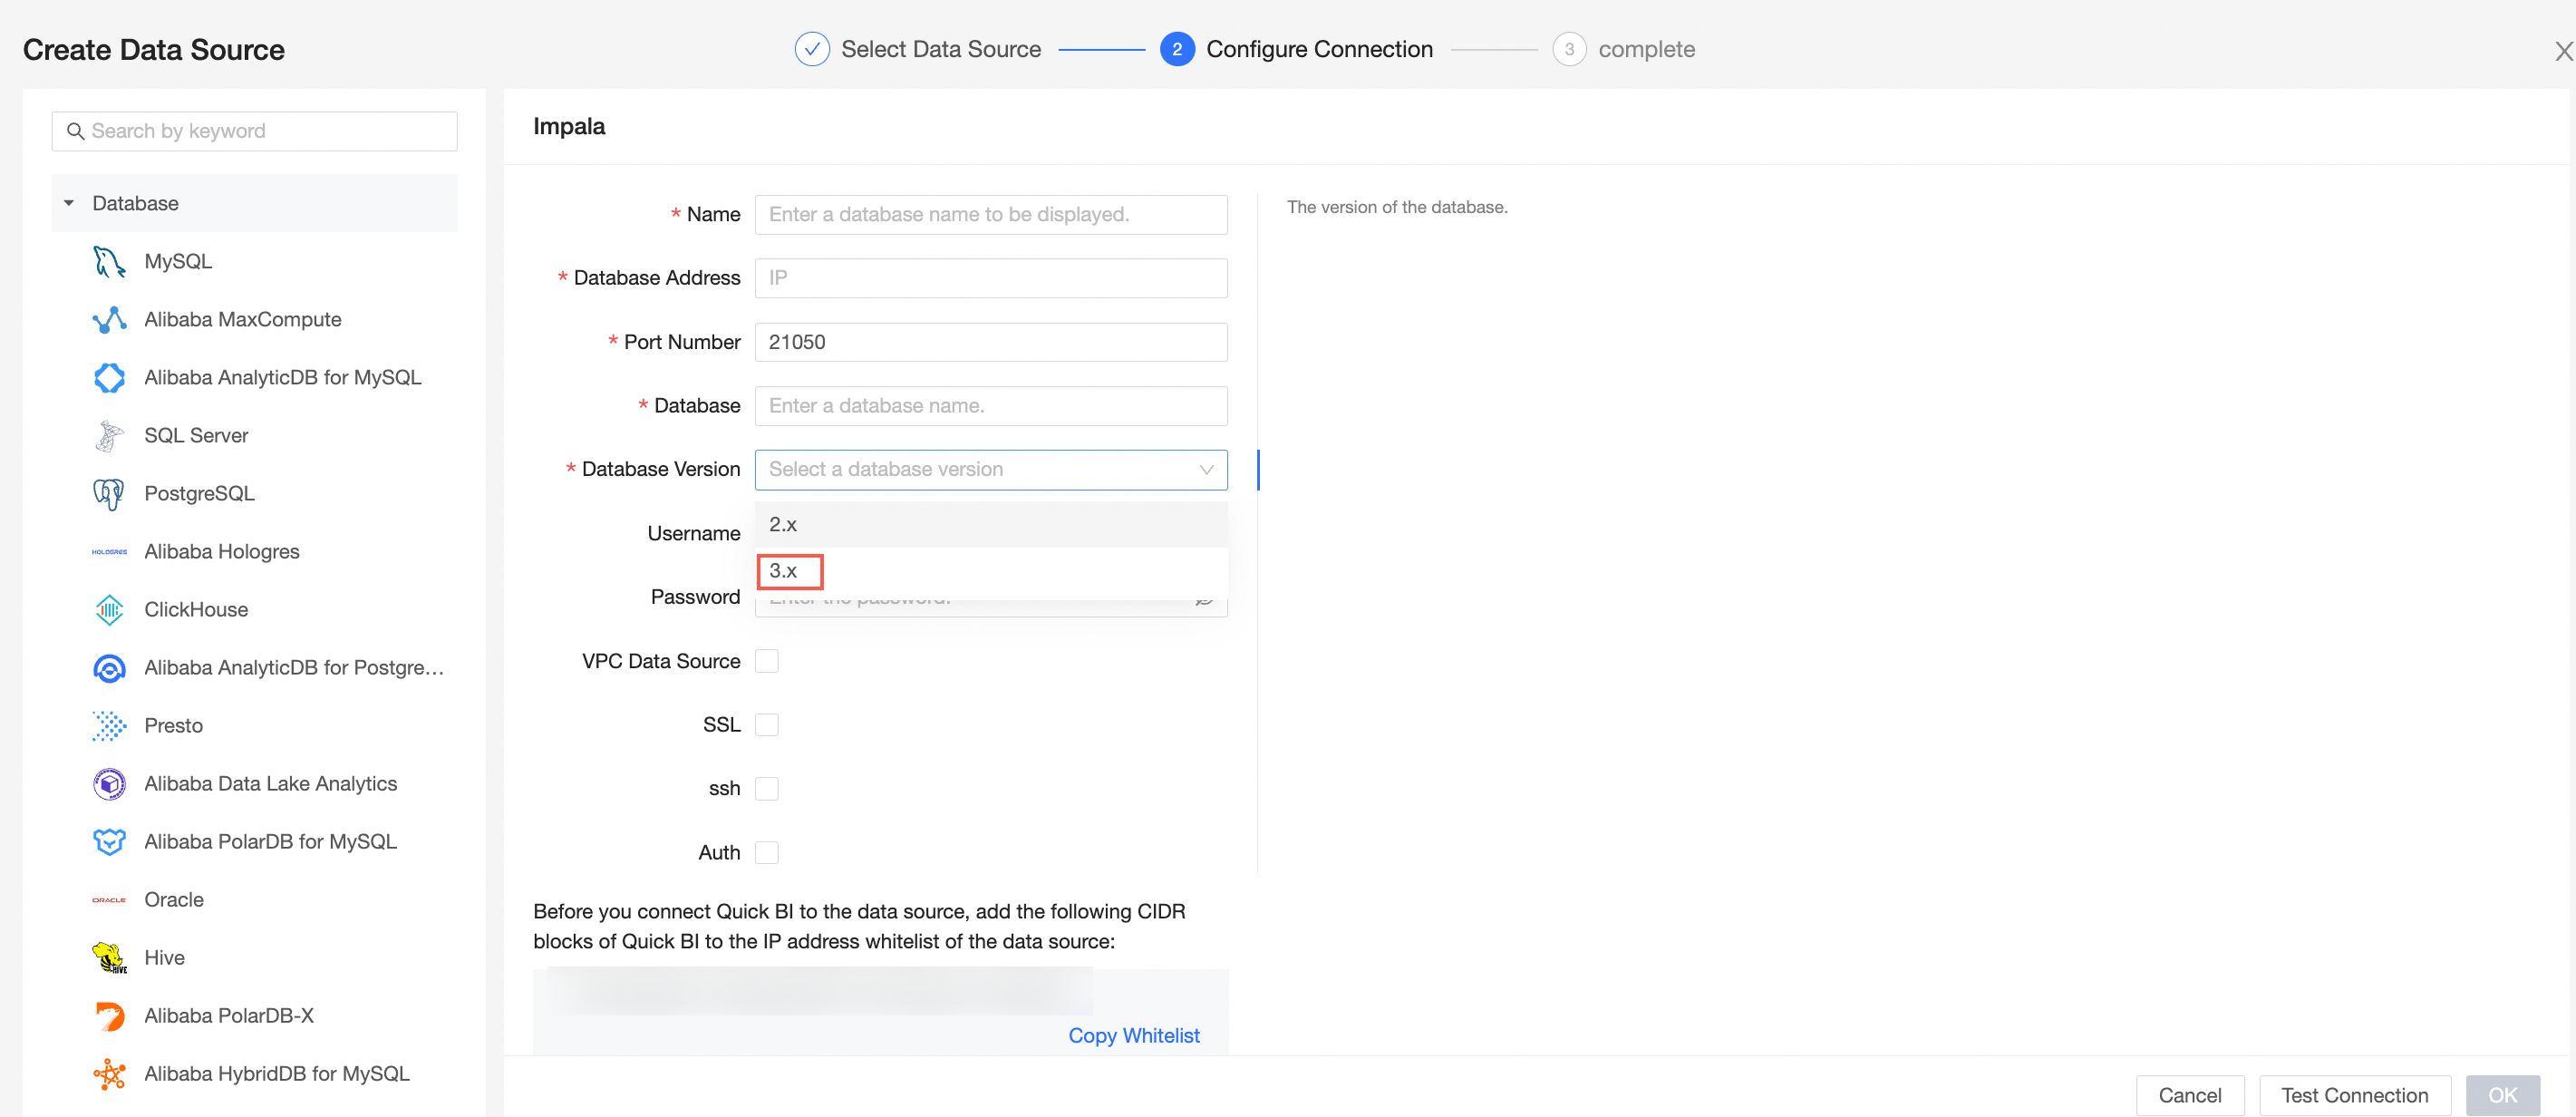
For more information, see Add a user-created Impala data source.
The LindormTSDB data source is added.
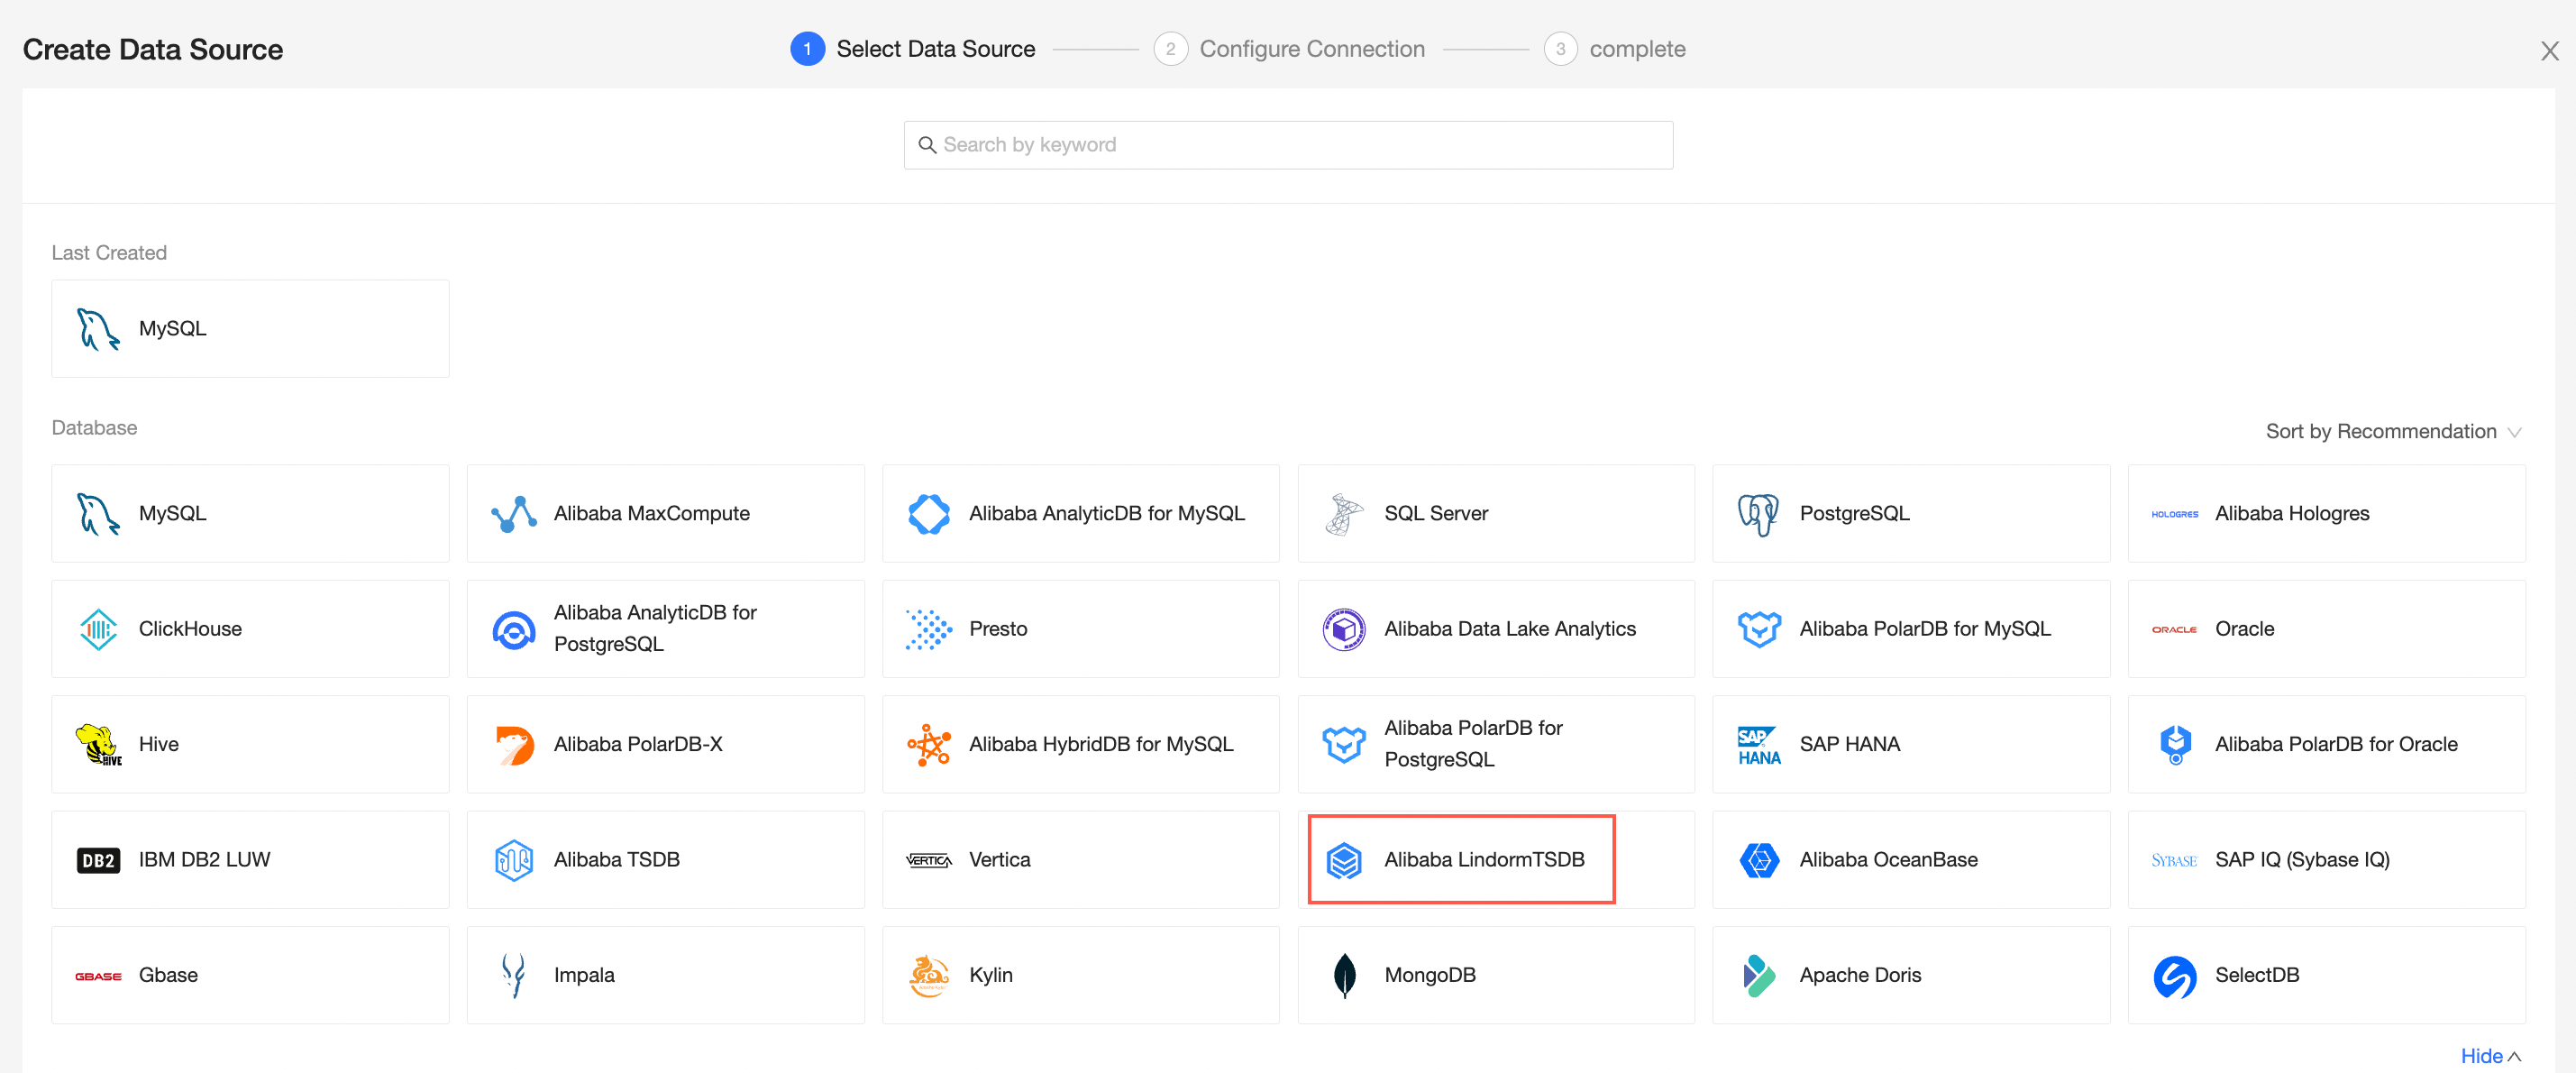
For more information, see Alibaba LindormTSDB.
The StarRocks and SelectDB data source entries are added. The StarRocks data source is changed to Apache Doris.
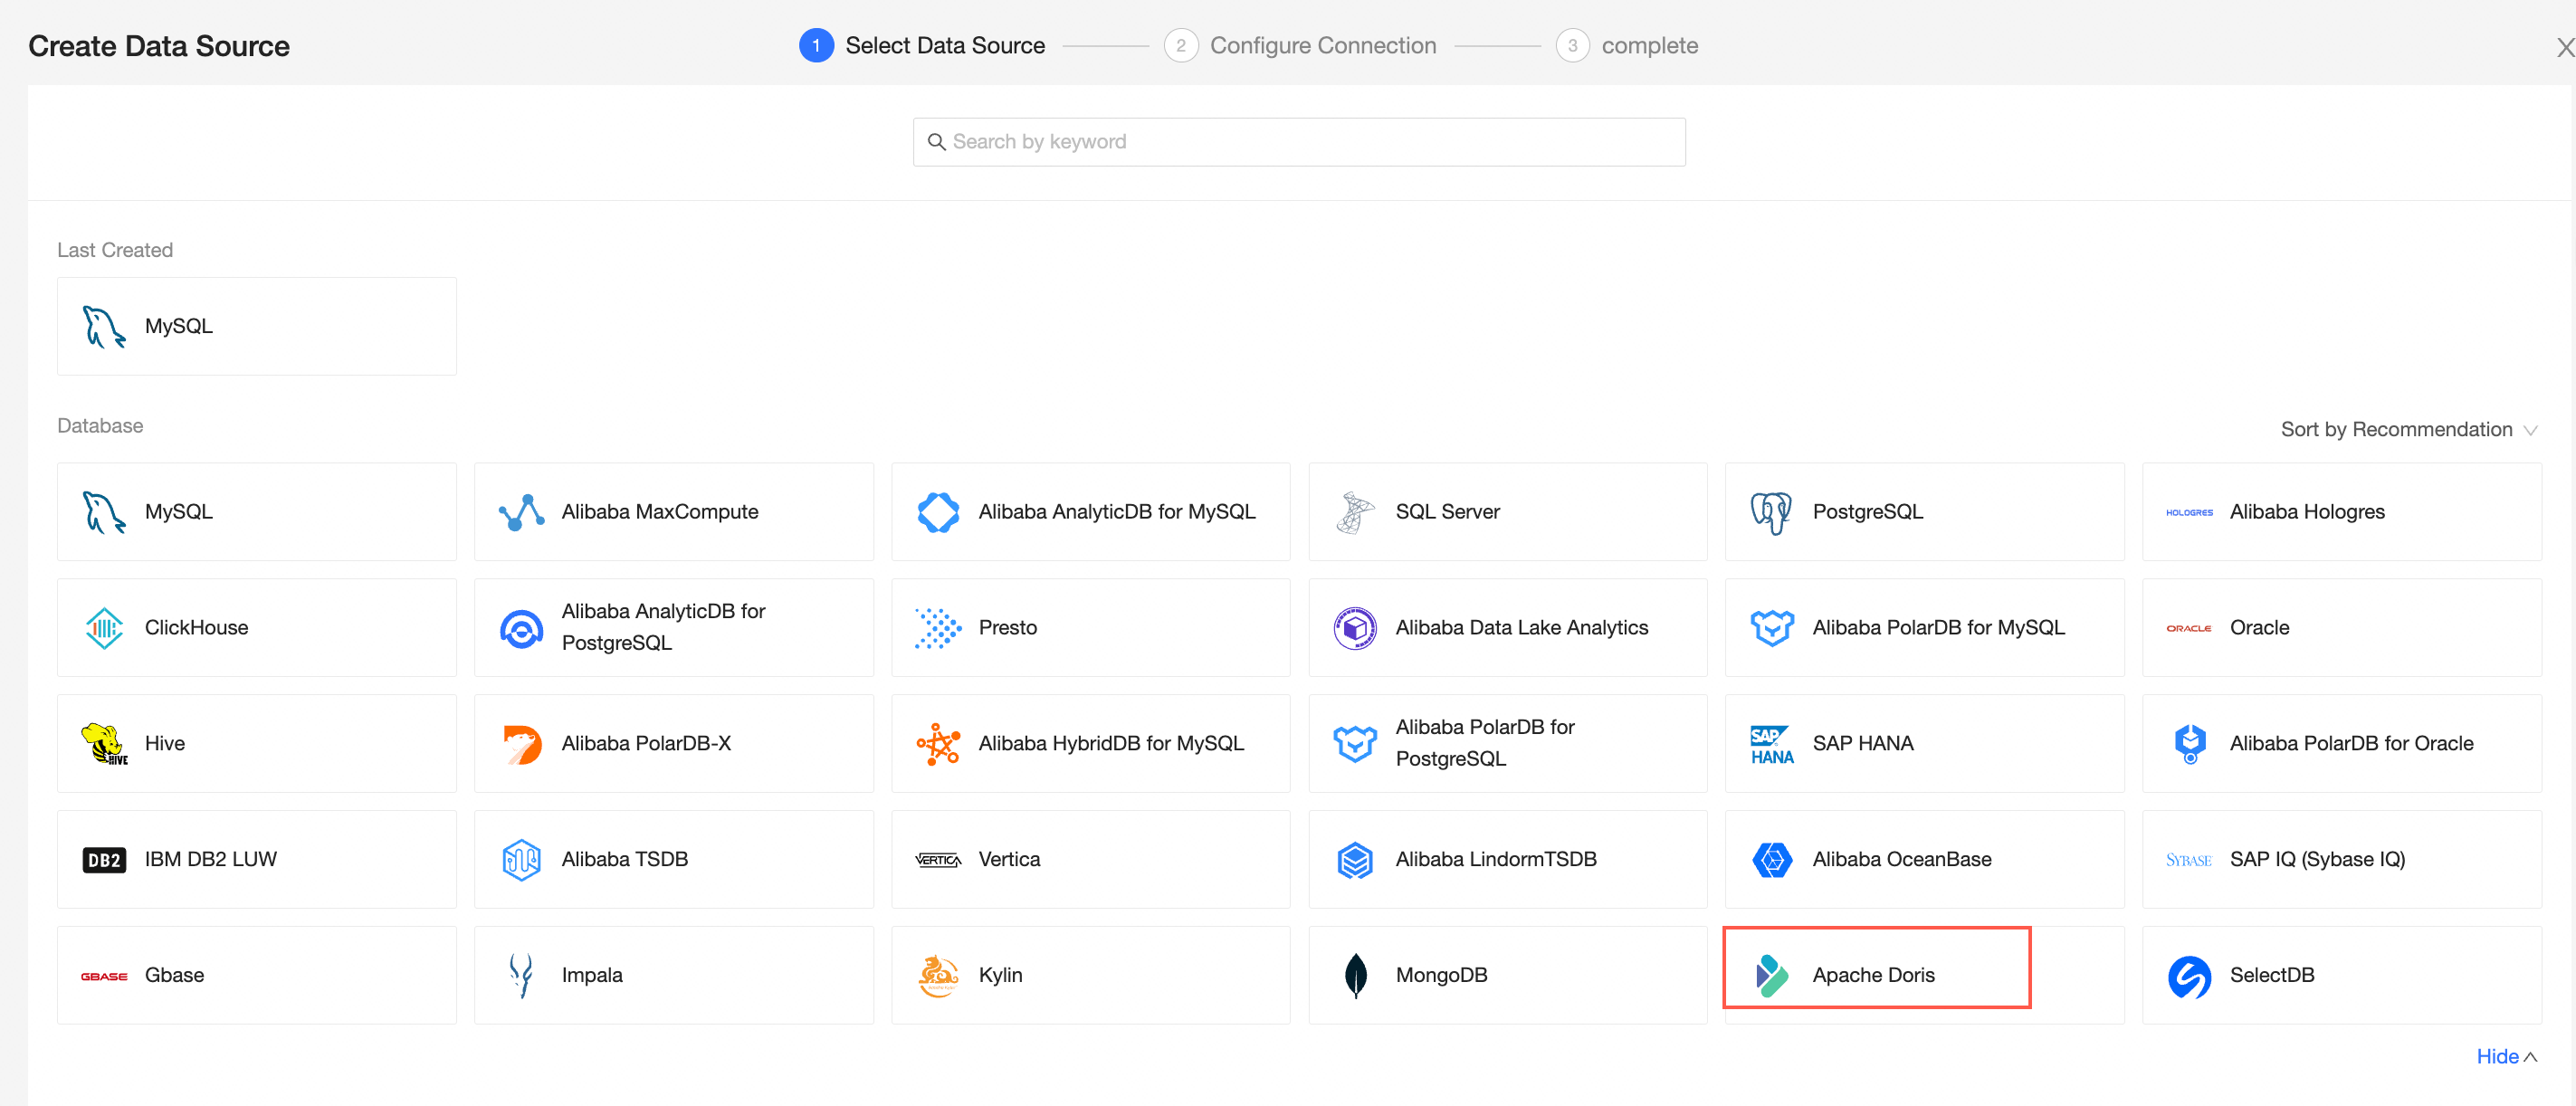
For more information, see Add an Apache Doris data source.
You can modify the column names of an object after the object is uploaded.
For more information, see Create a file data source.
Datasets
Custom associated conditions are supported.
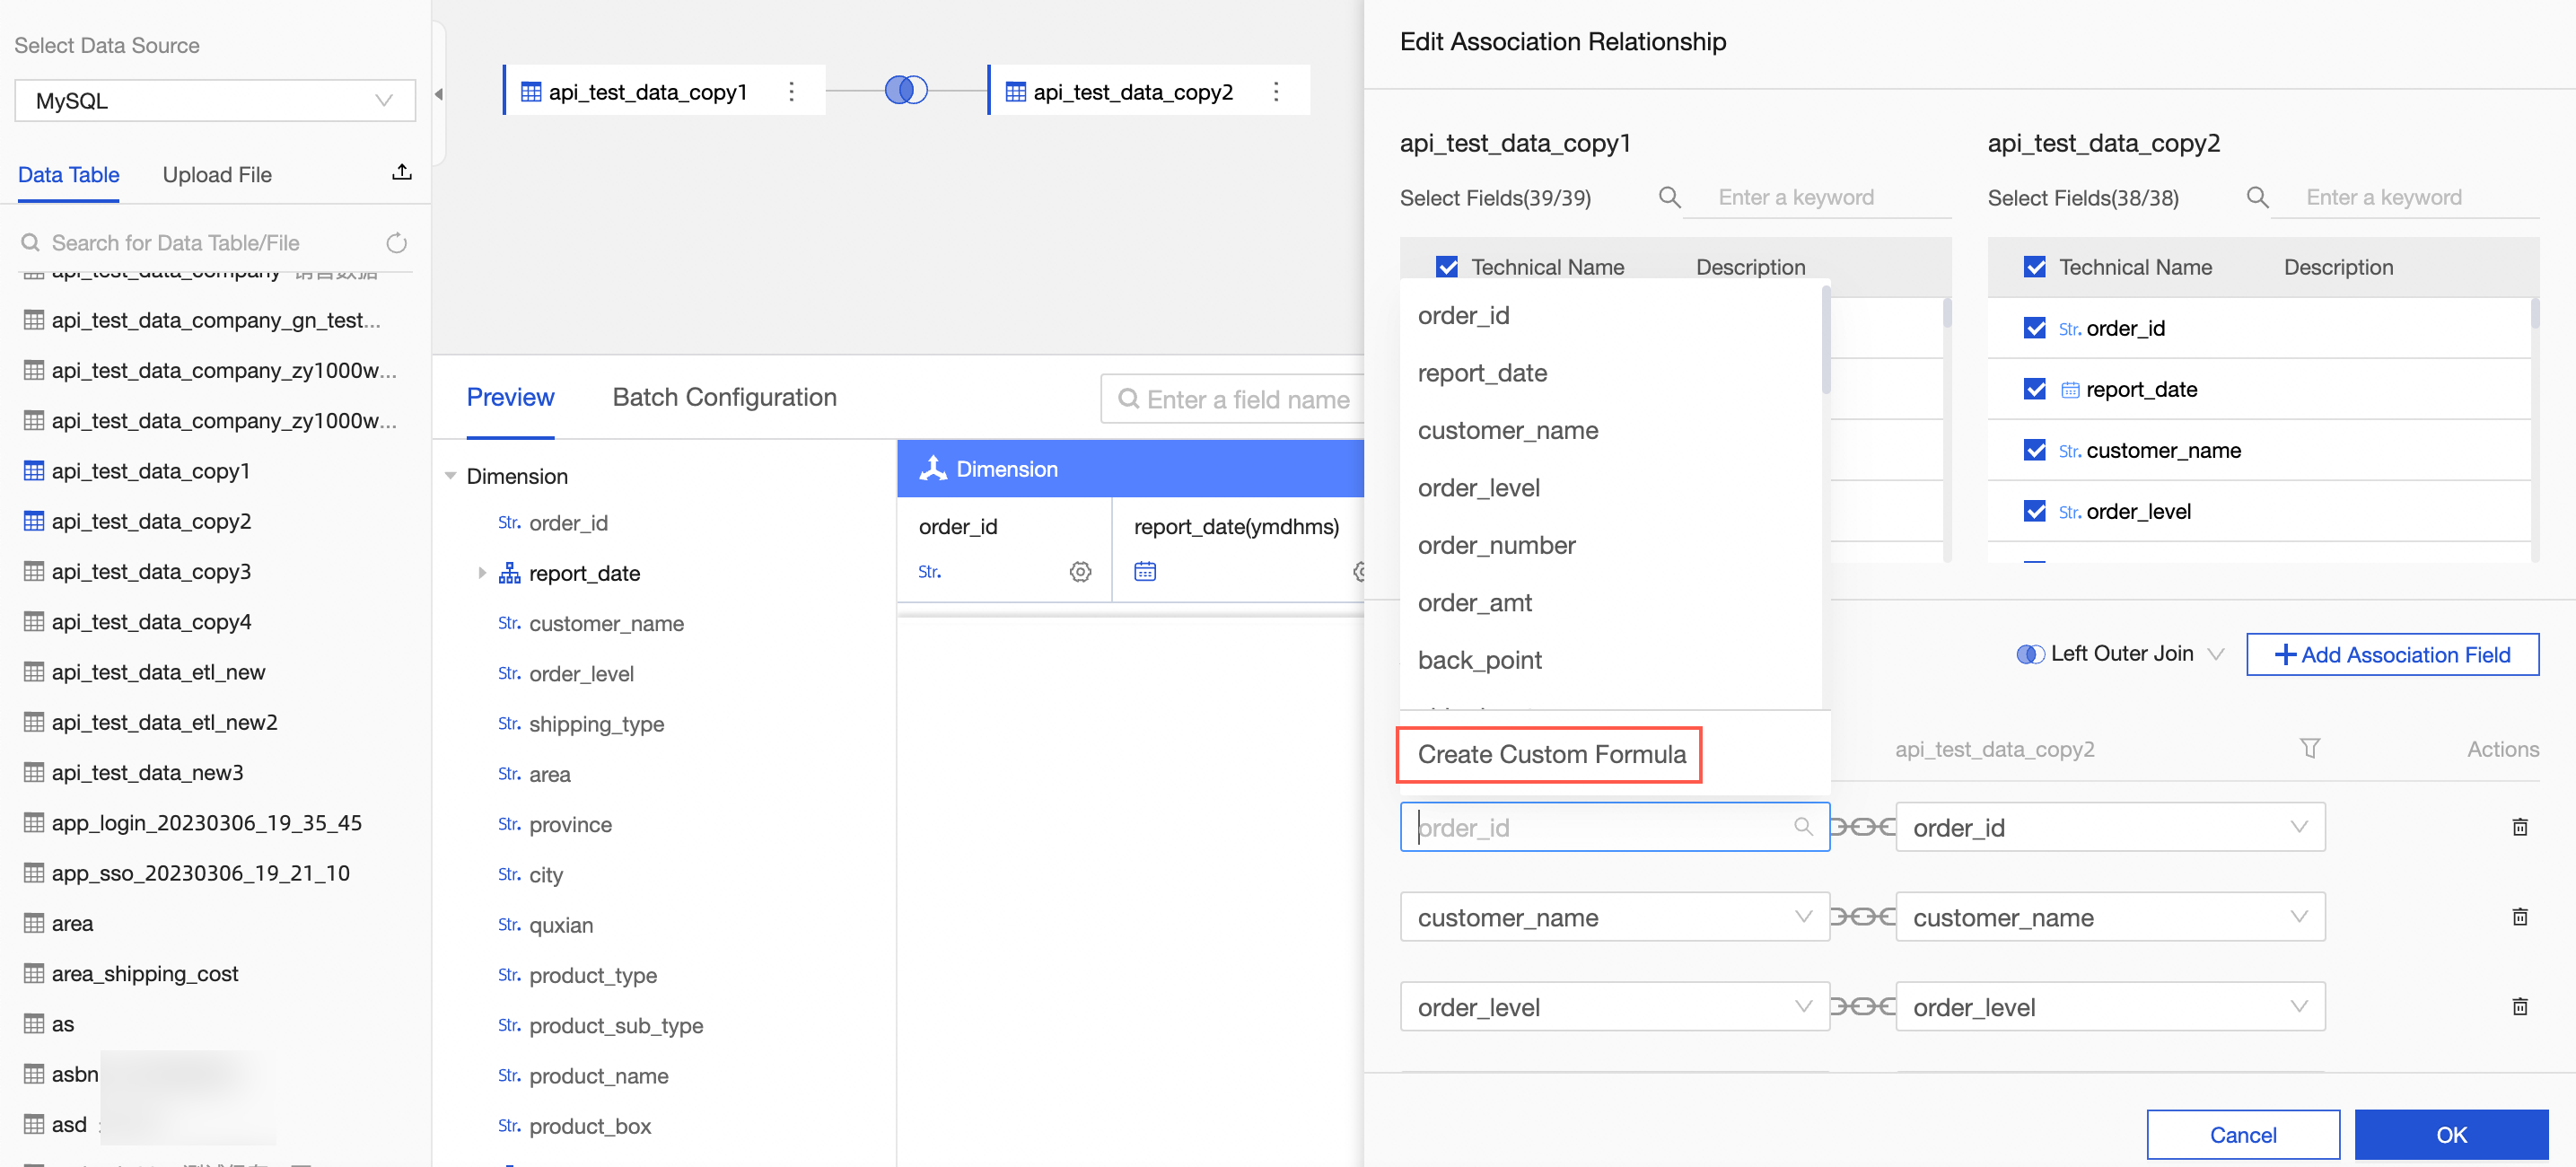
Supports filtering before association.
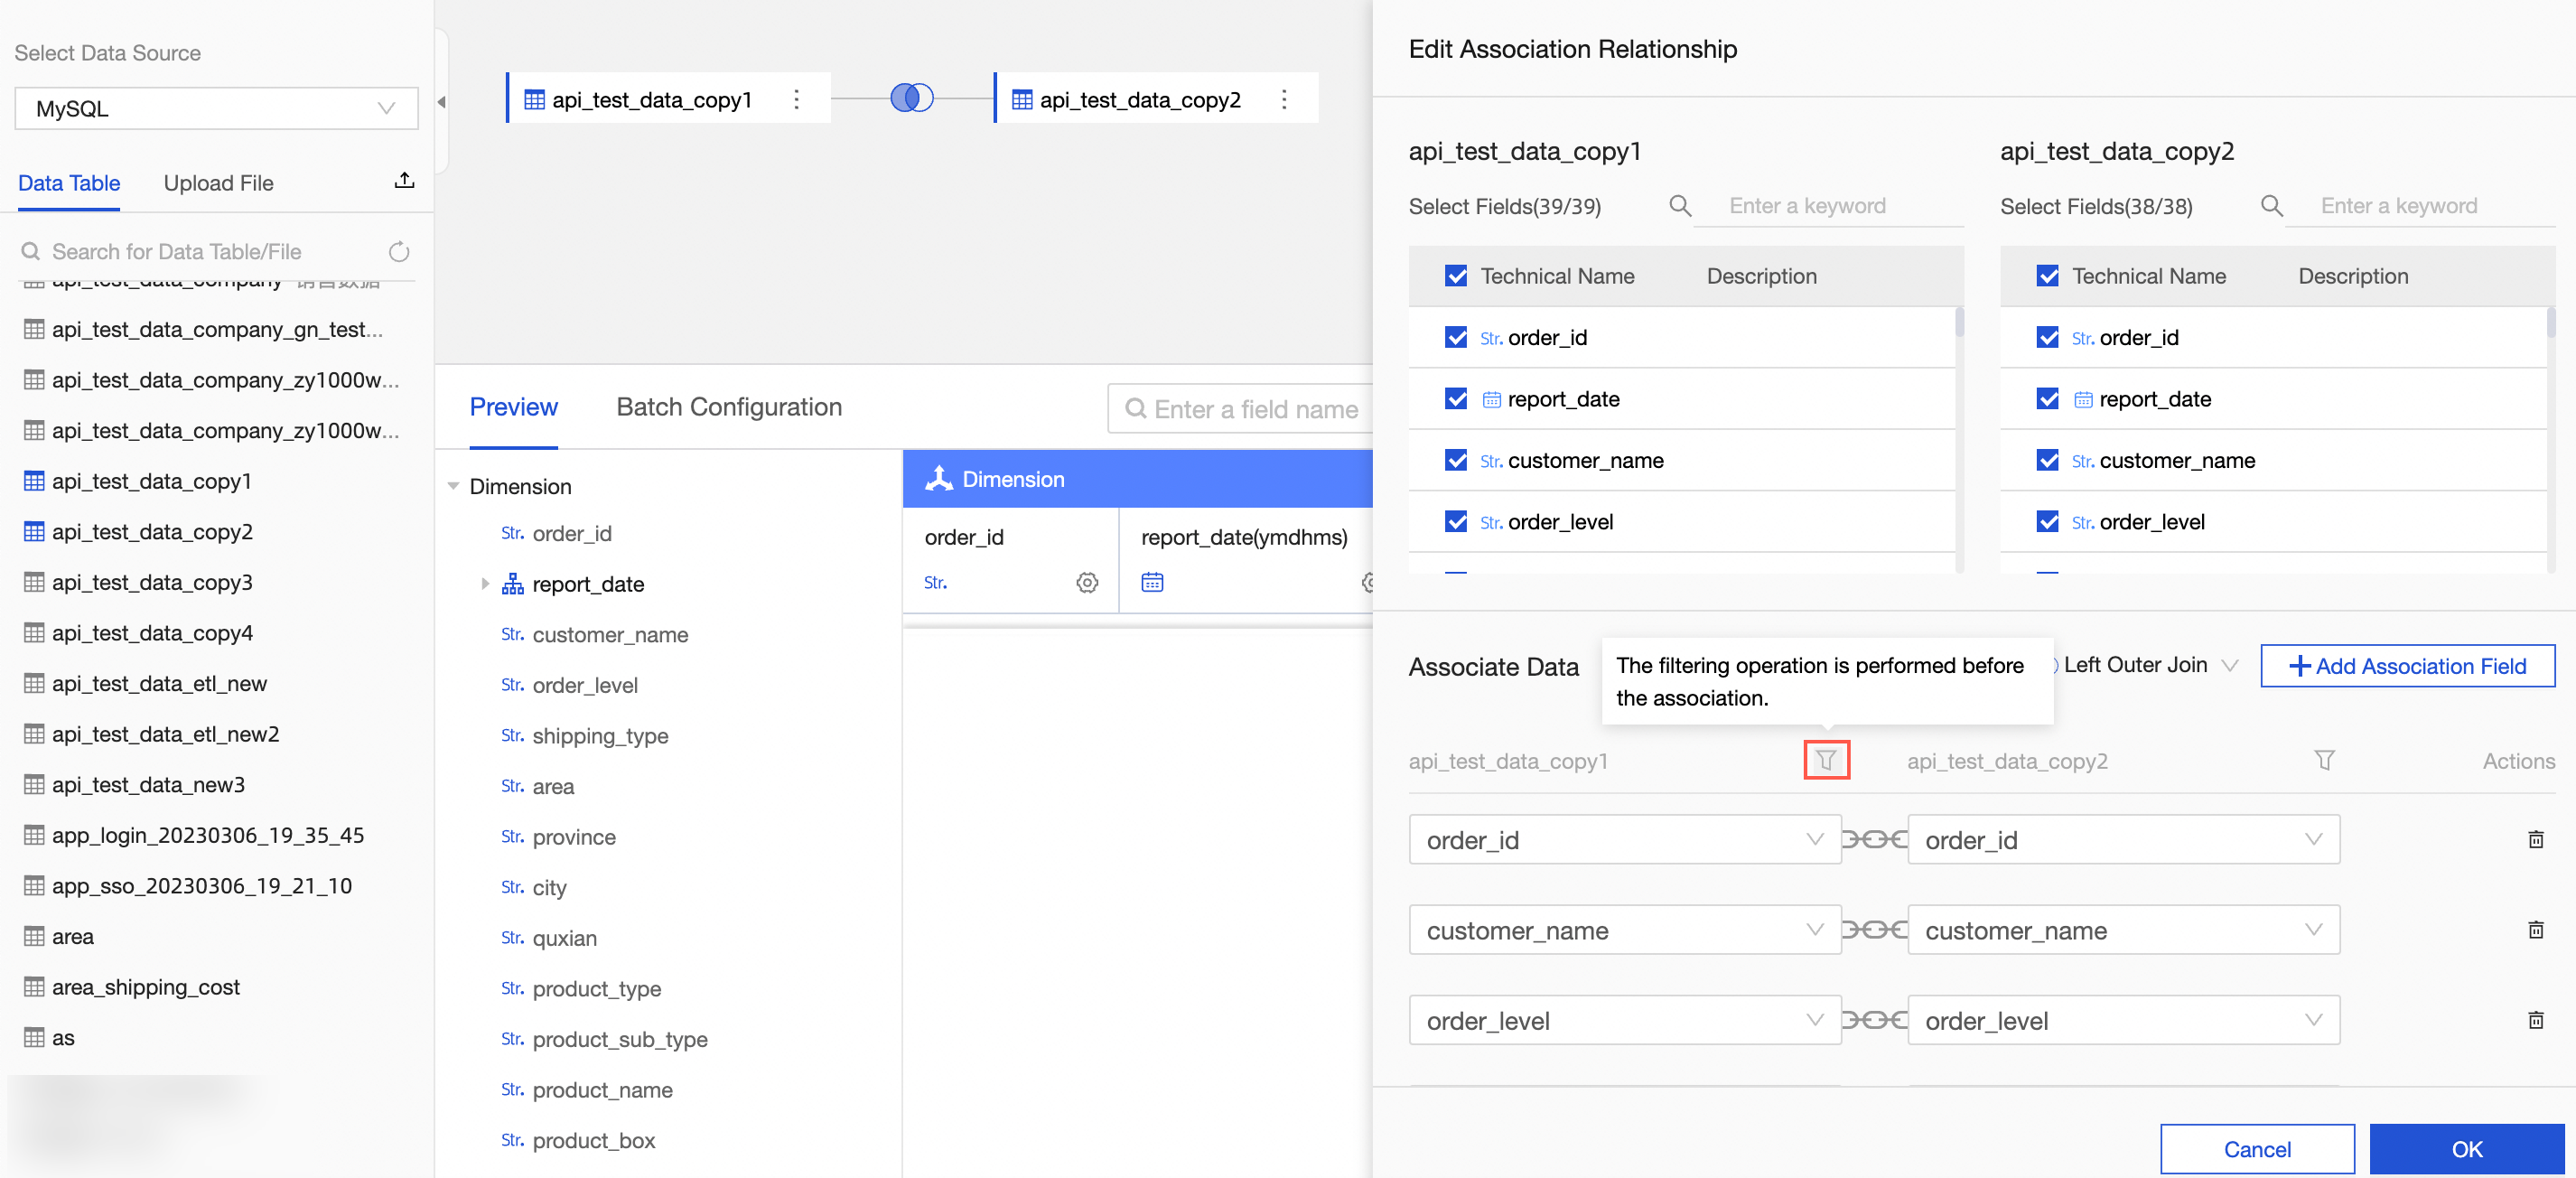
For more information, see Build a model.
By default, the global cache is disabled for new organizations.
For more information, see Configure the acceleration engine of Quick BI.
Forms
Postgresql is supported for data filling.
Data reporting supports sqlserver.
For more information, see Create a form.
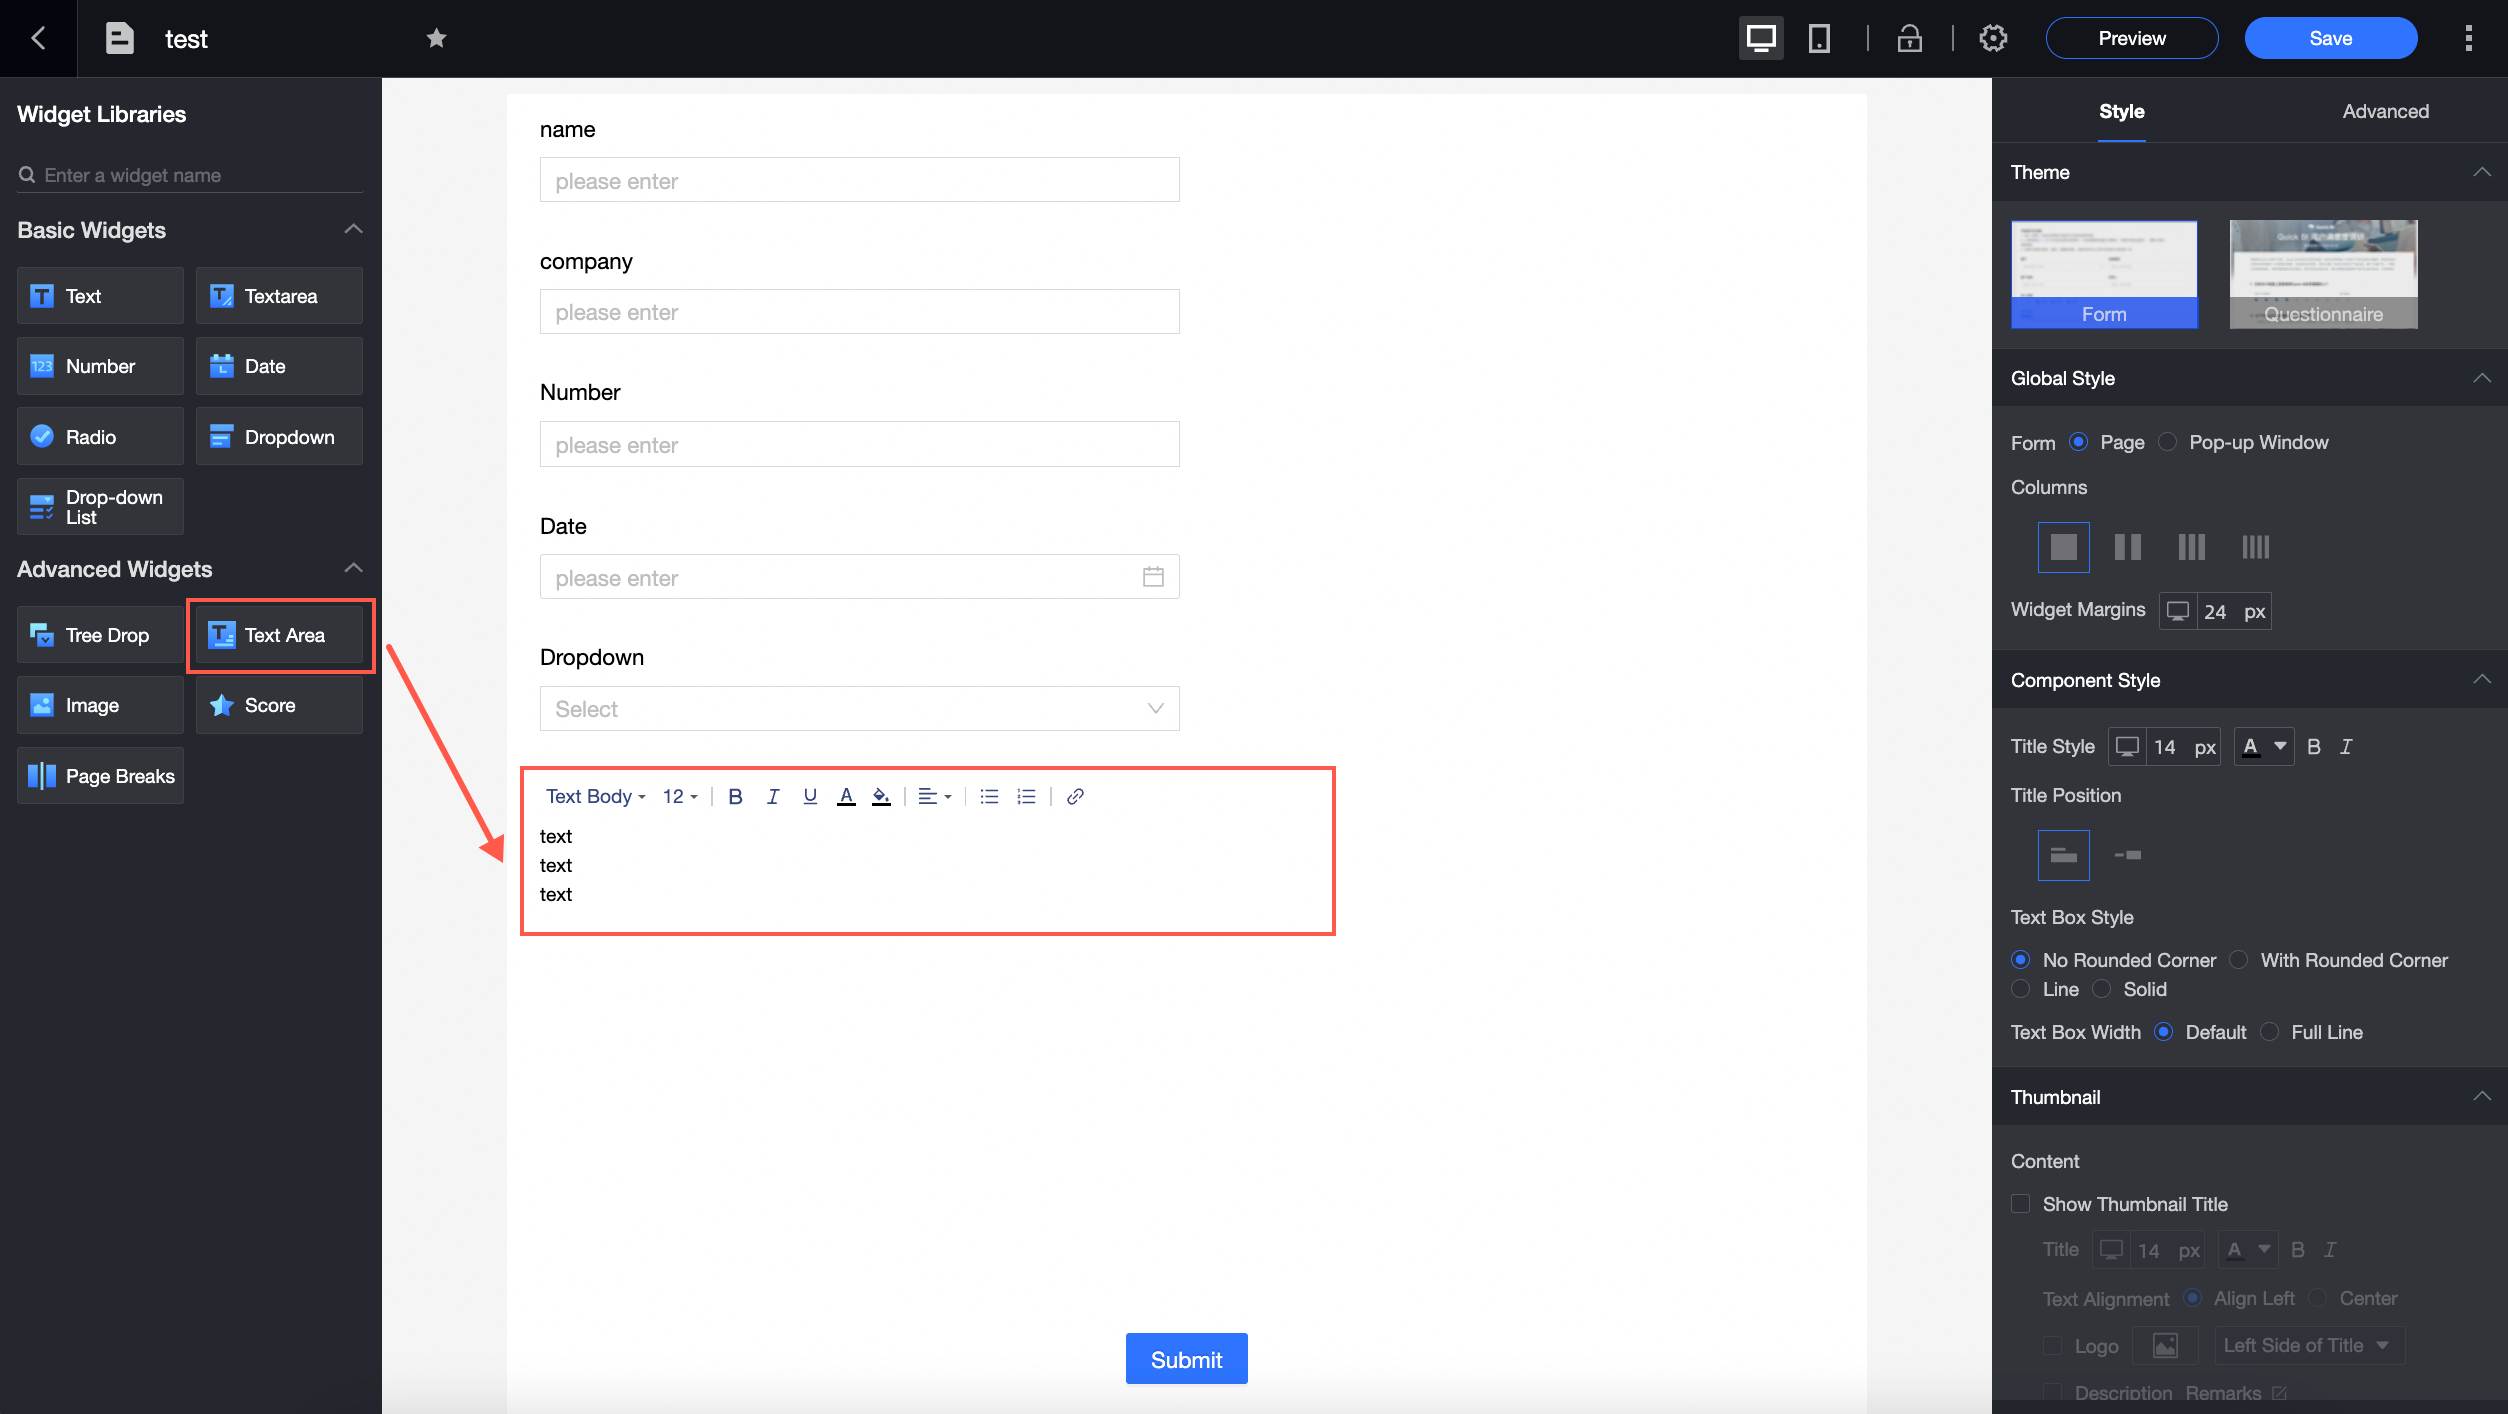
Added advanced components: Rich Text and Scoring.
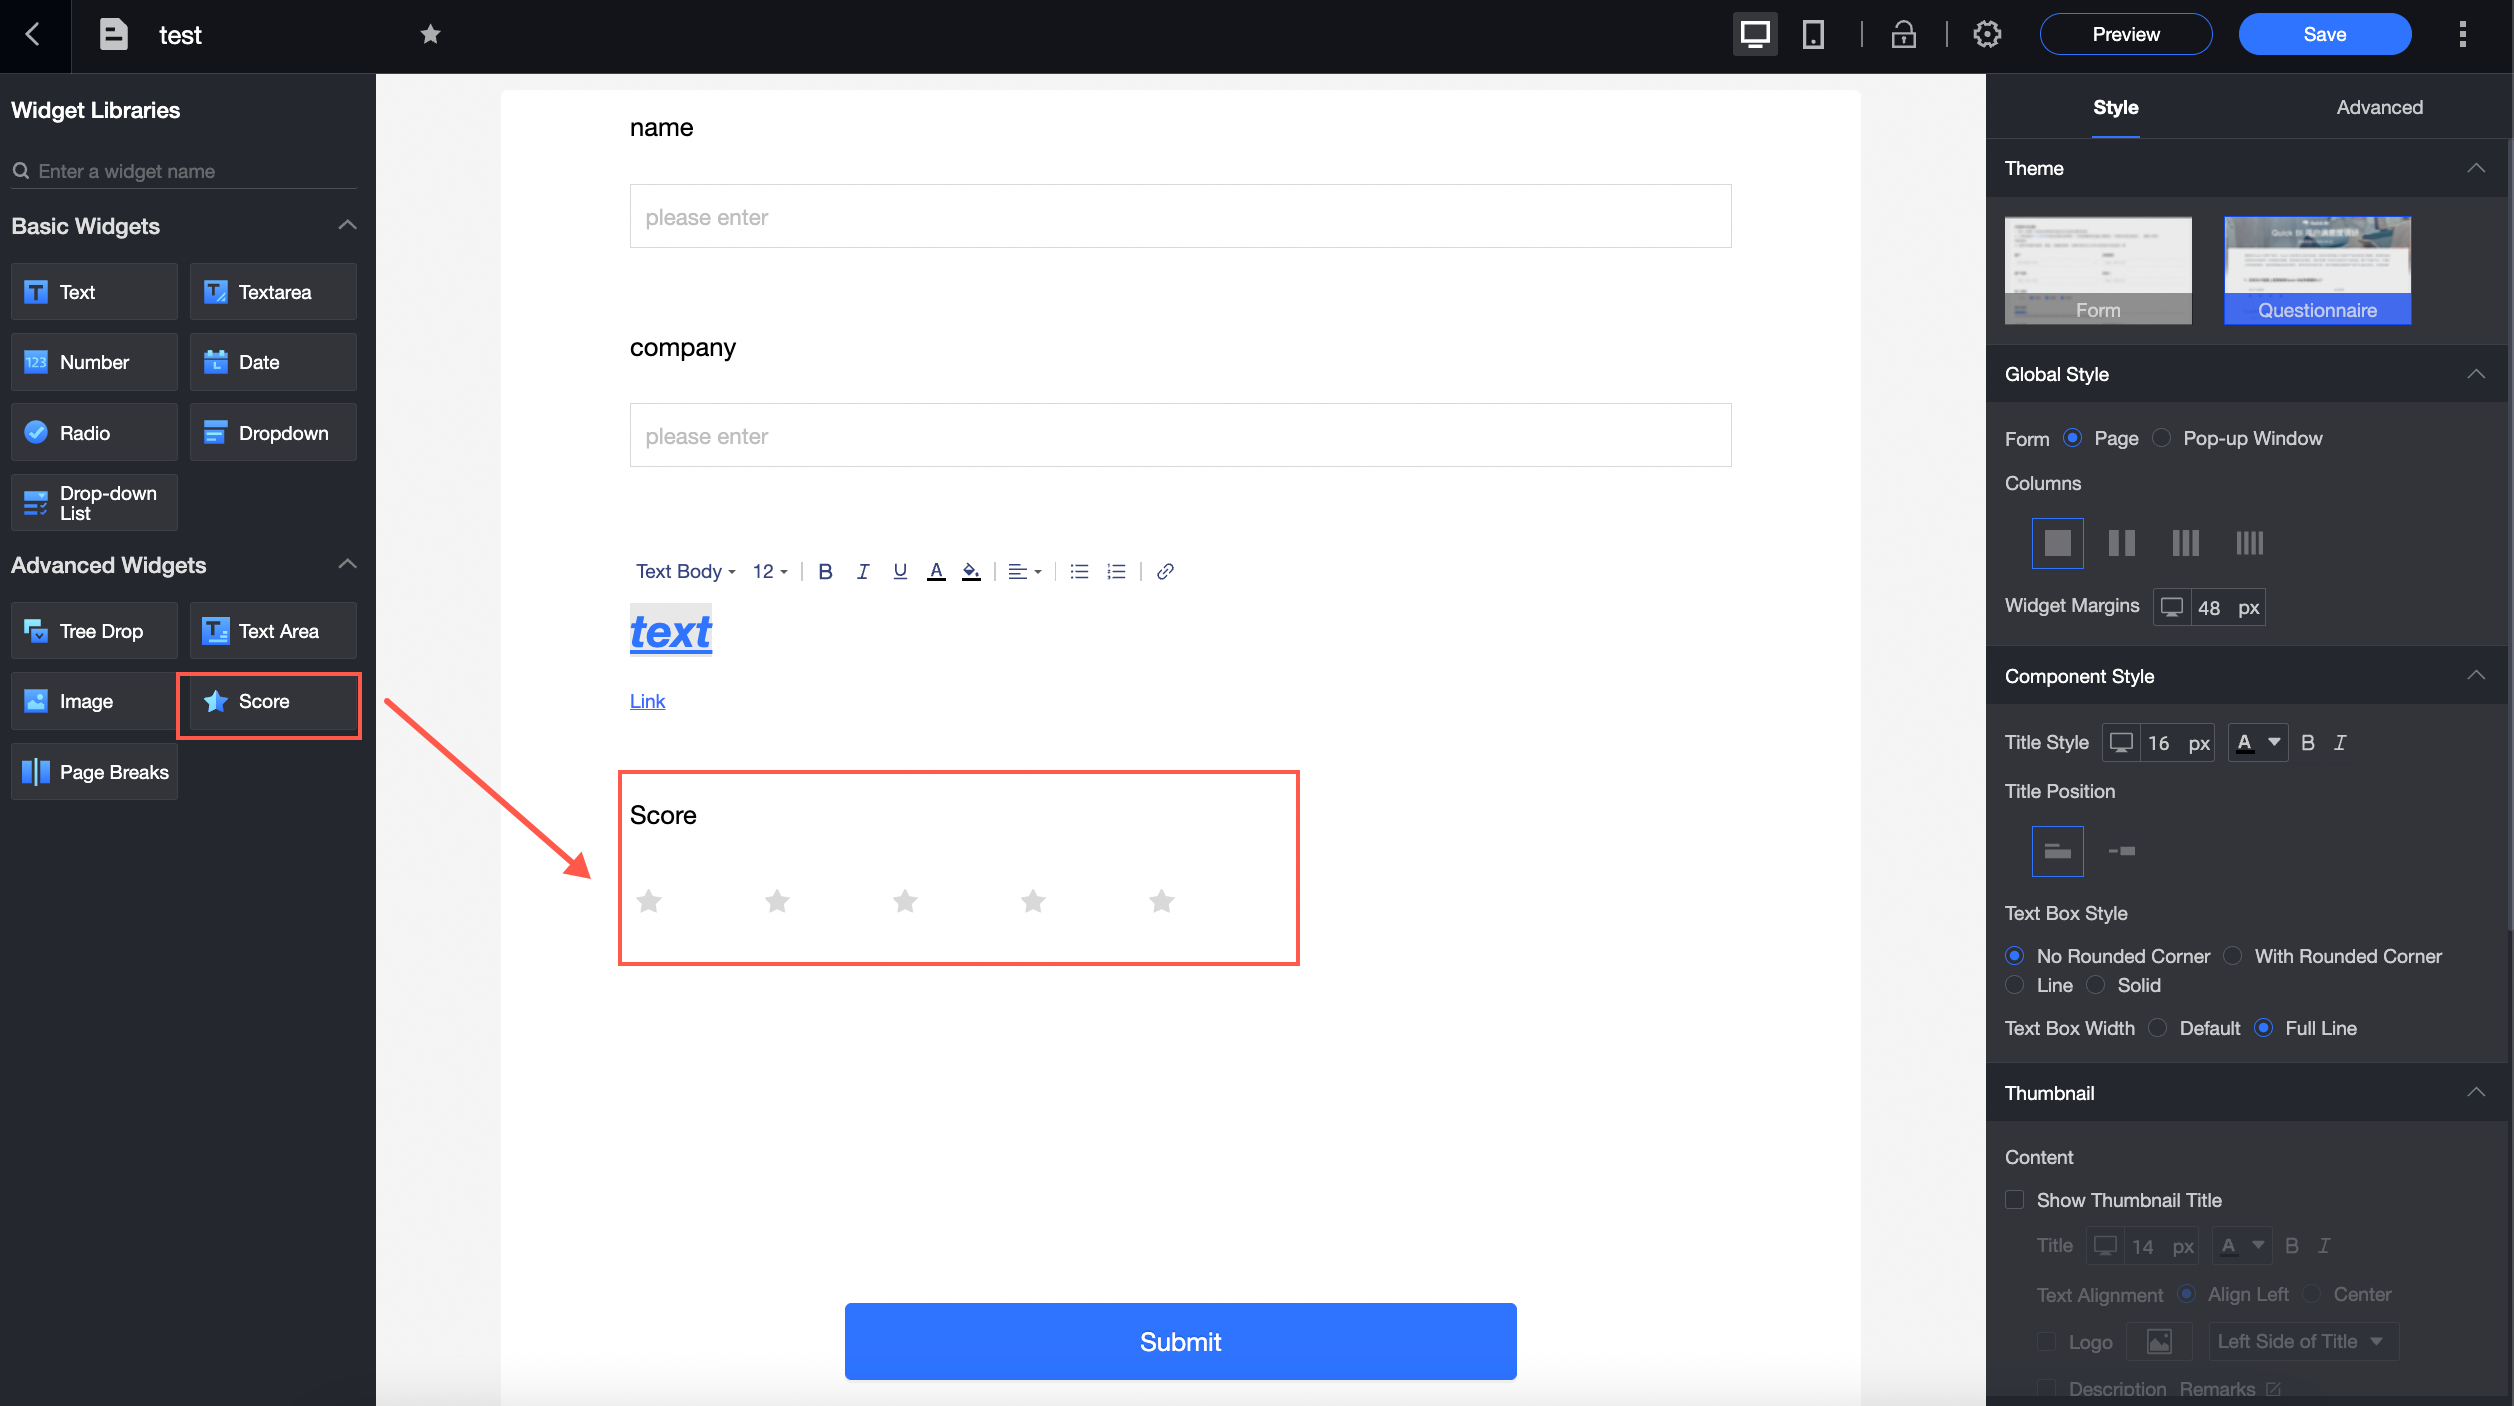
Added global form configurations (questionnaire mode, cover page, and tail page).
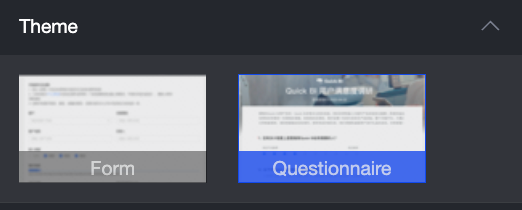
For more information, see Data form page settings.
Dashboards
Chart link optimization is added to support filtering by intent.
The undo rollback feature is added to the dashboard.
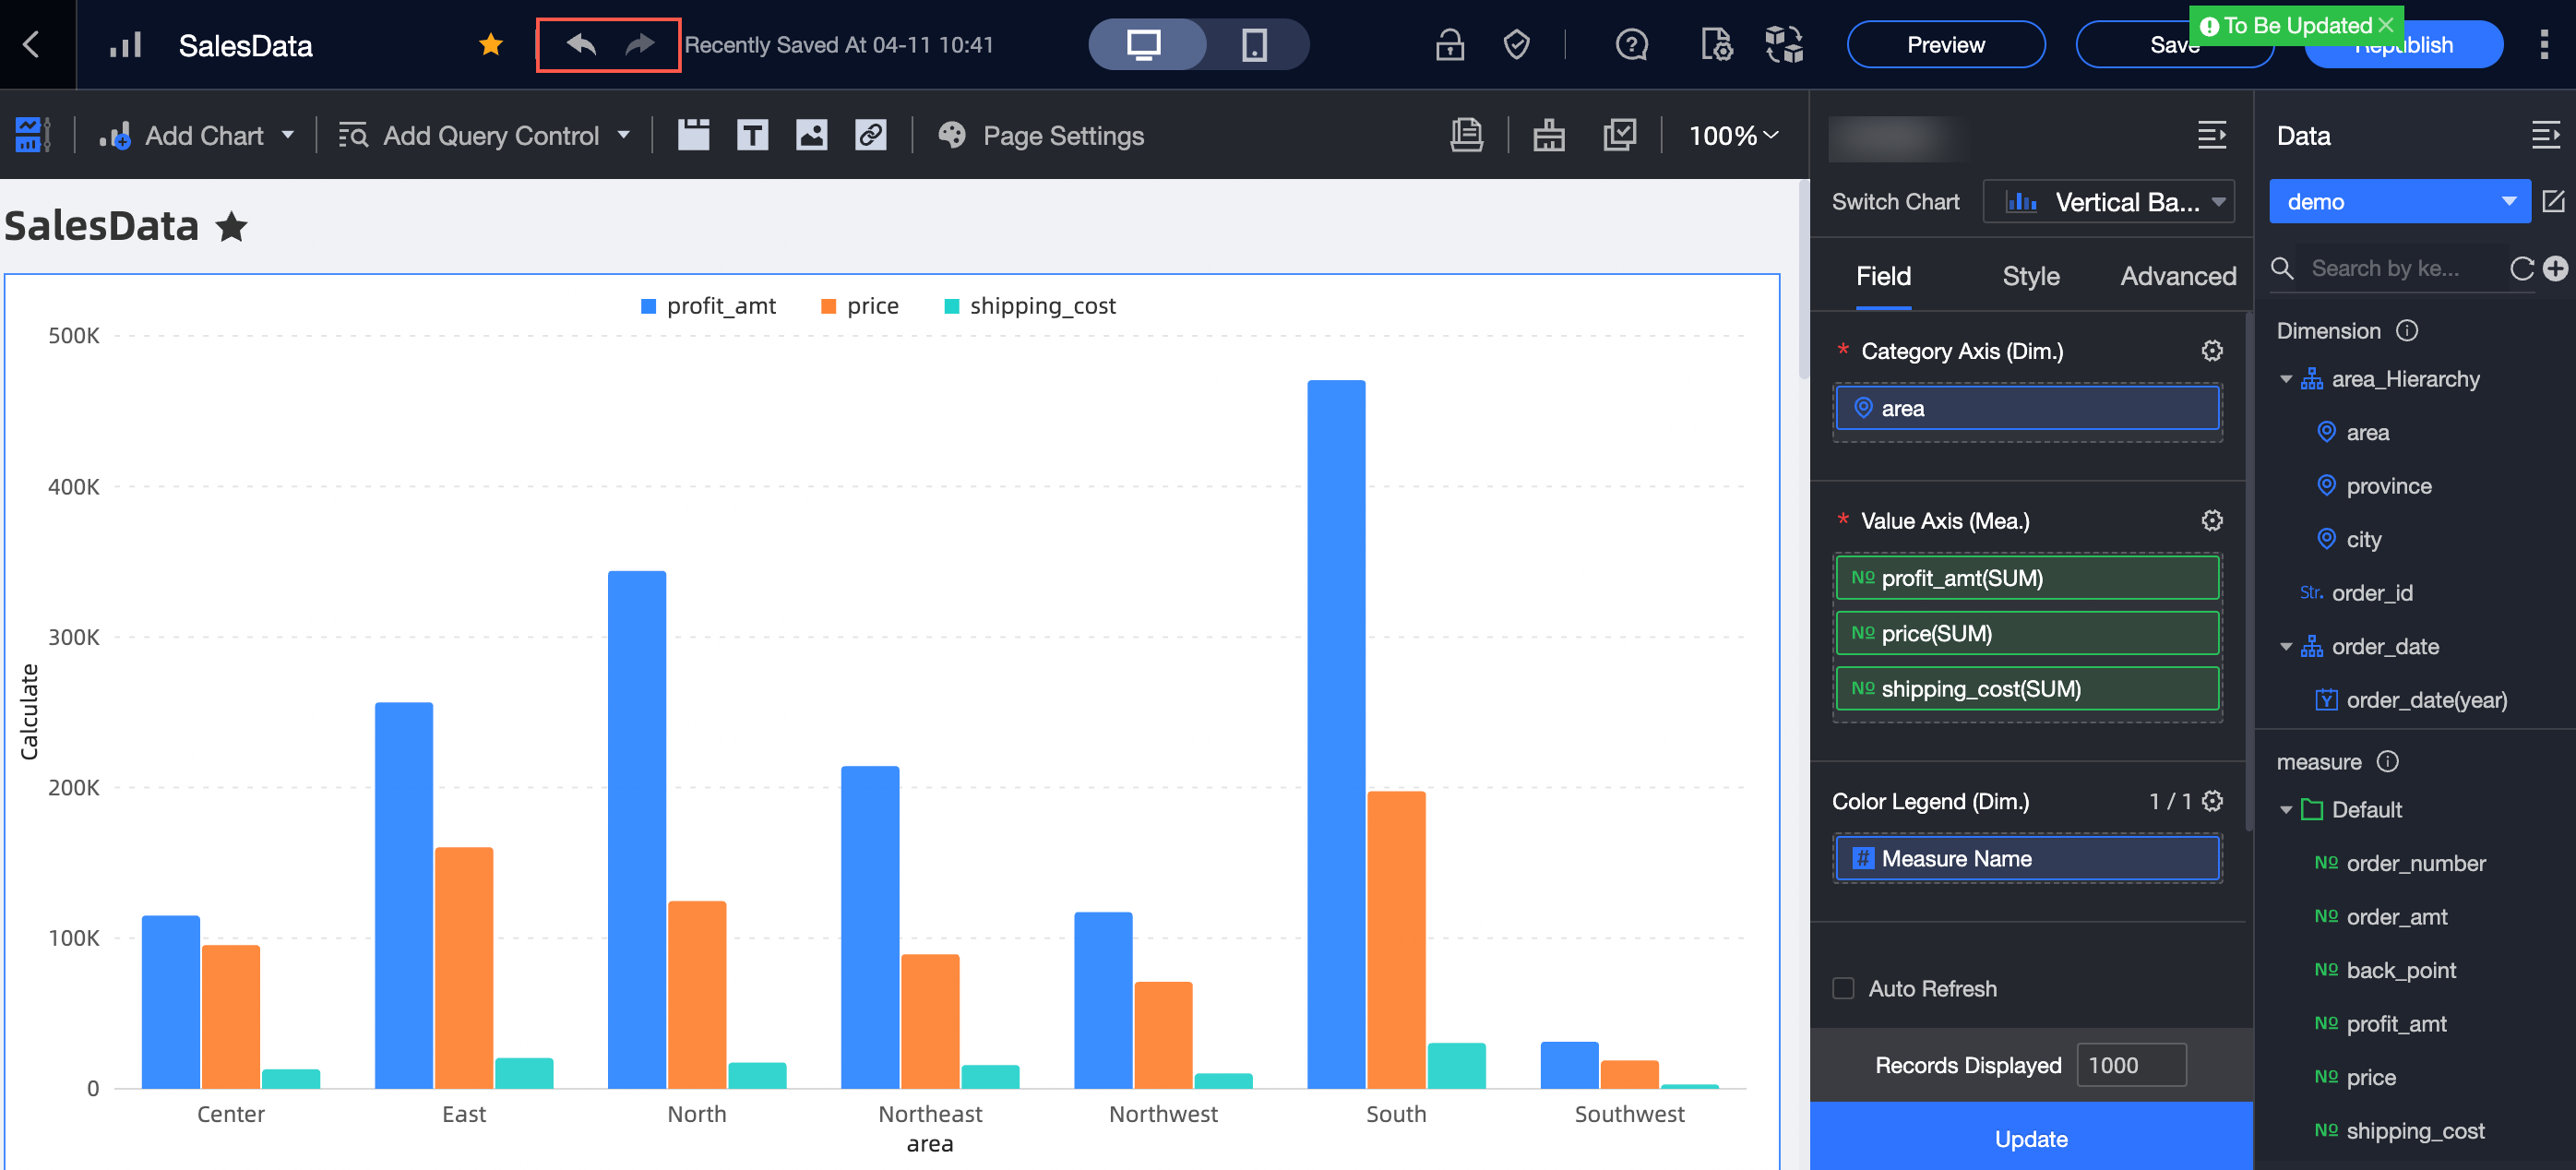
For more information, see Undo rollback.
Dashboards can be exported to Excel with watermarks.
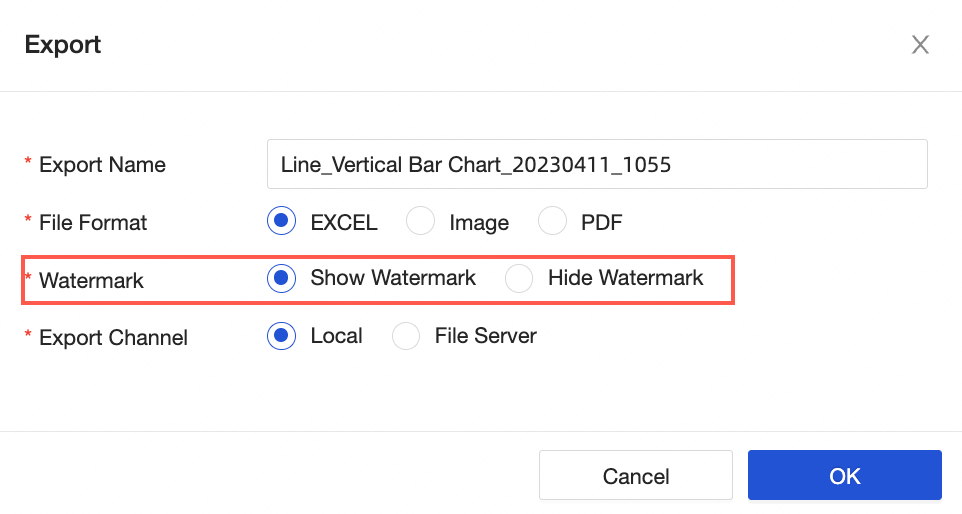
For more information, see Watermark settings.
Global parameters support query control metric and time types, SQL parameters, and SQL placeholder types.
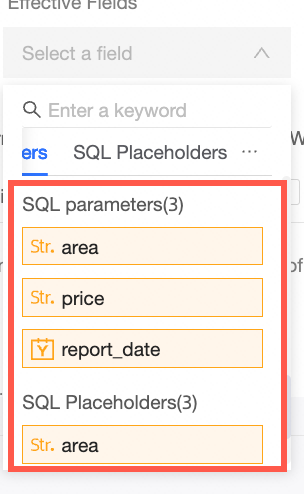
For more information, see Configure global parameters.
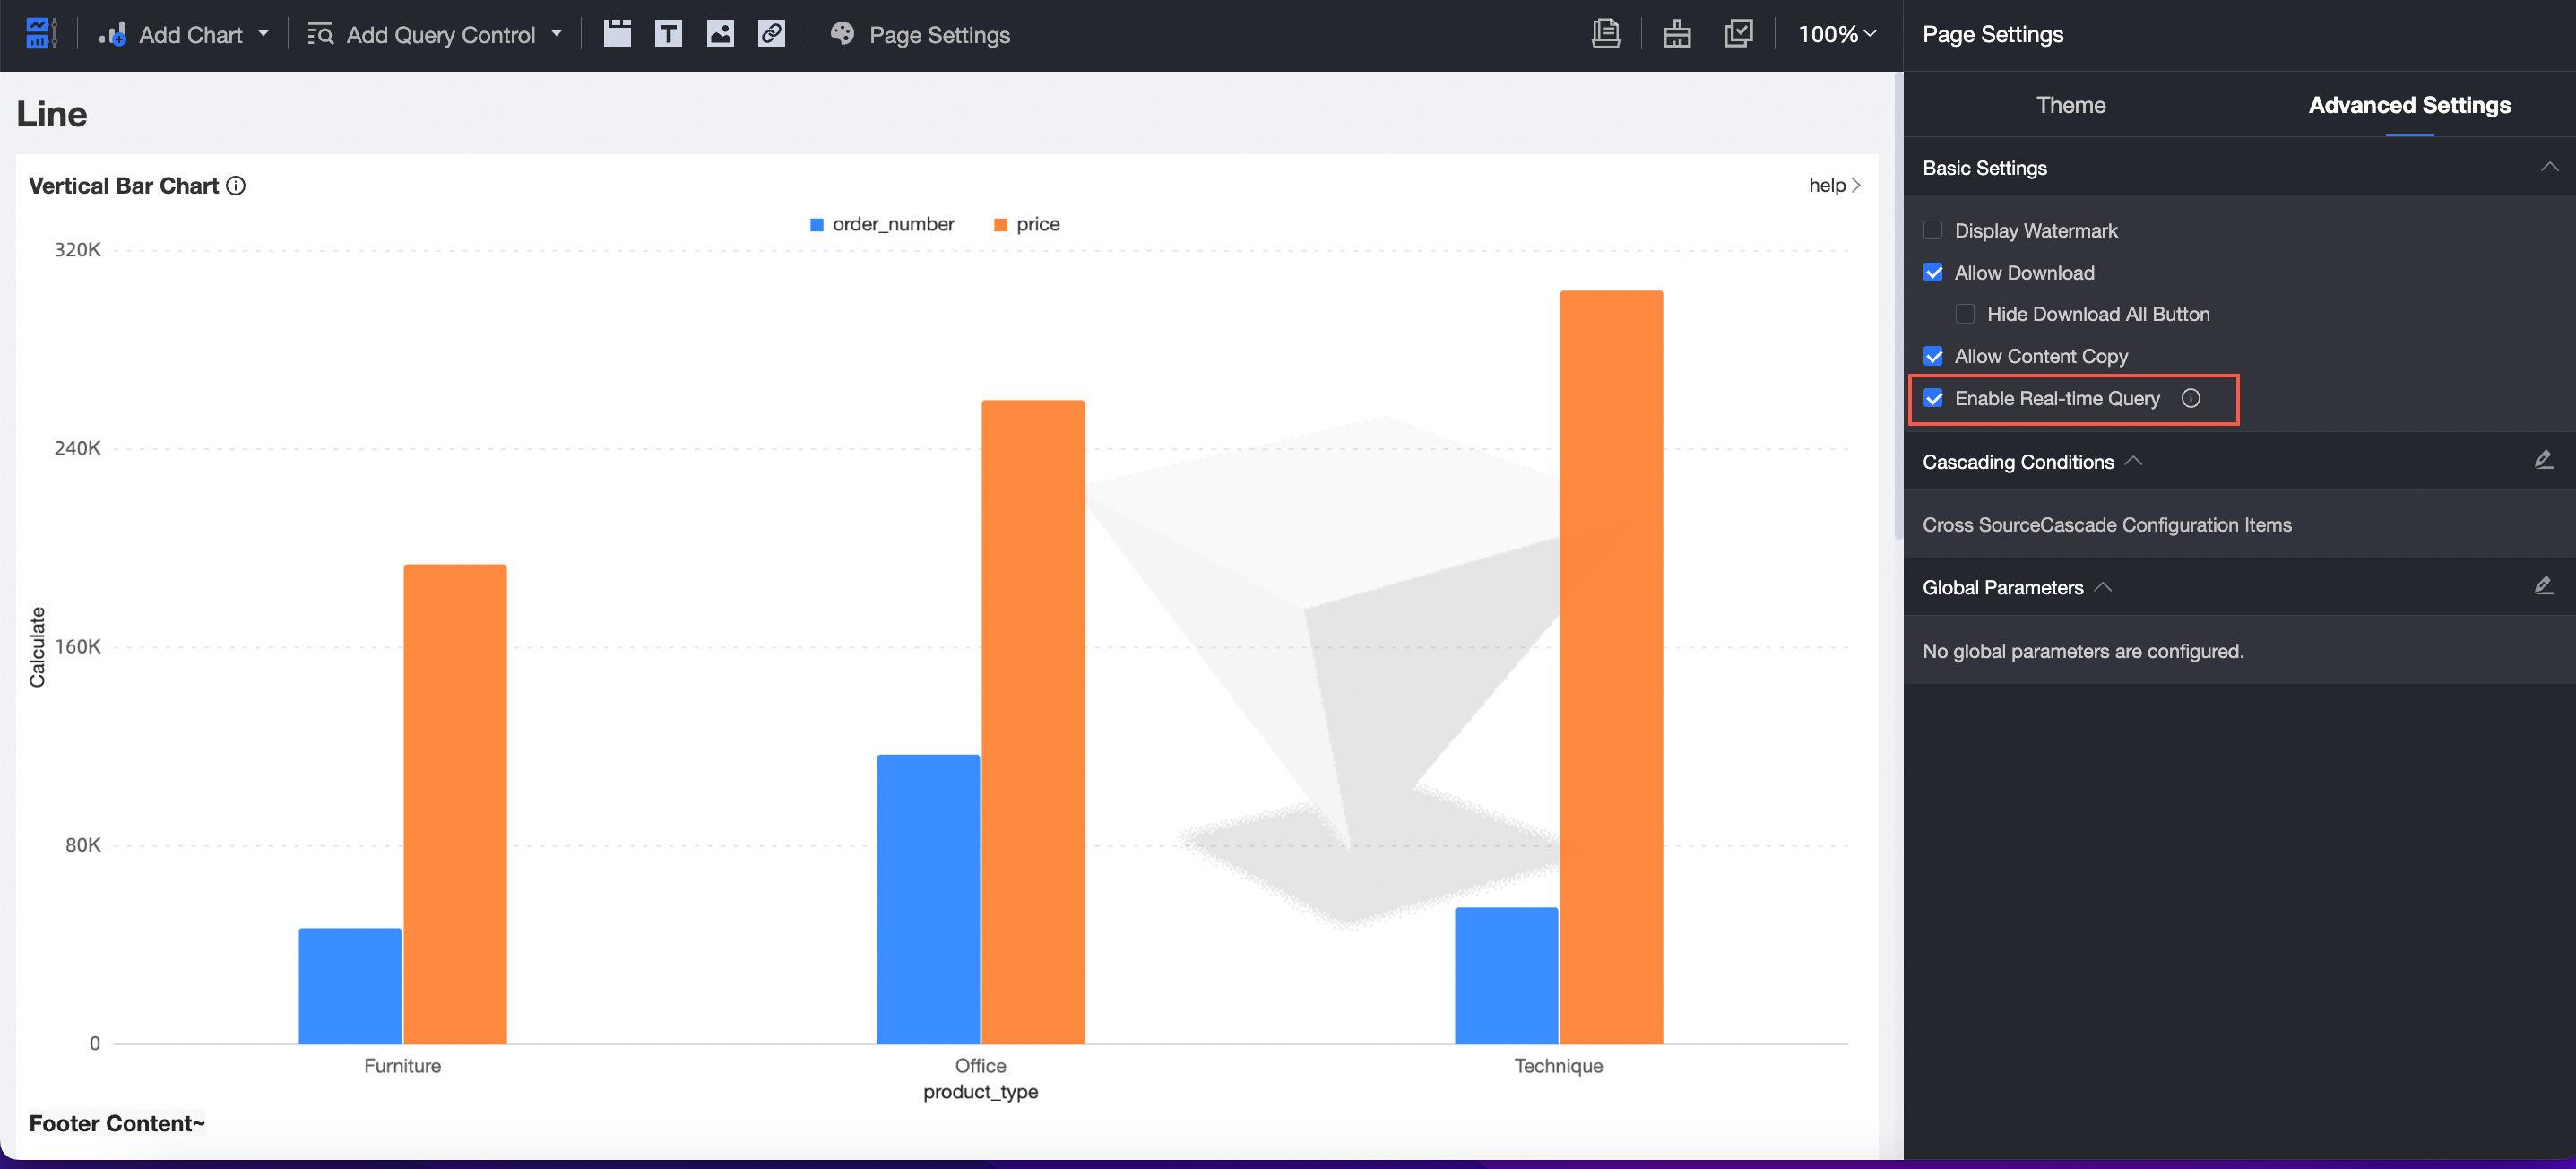
The real-time query switch is added to the dashboard.
The dashboard jump capability is enhanced. The query control carried by the dashboard supports measures, parameters, and placeholders.
For more information, see Redirect.
You can reset and clear tabs and controls in a chart.
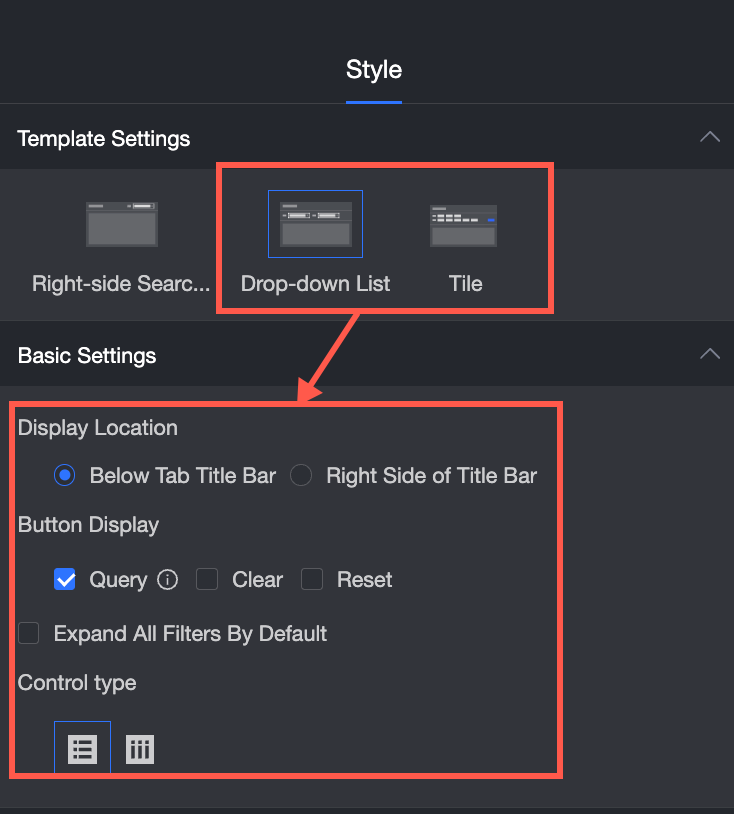
For more information, see Create a query control in a tab and Create a query condition in a chart.
The activity comparison control is added, which is suitable for data comparison between large promotion activities.
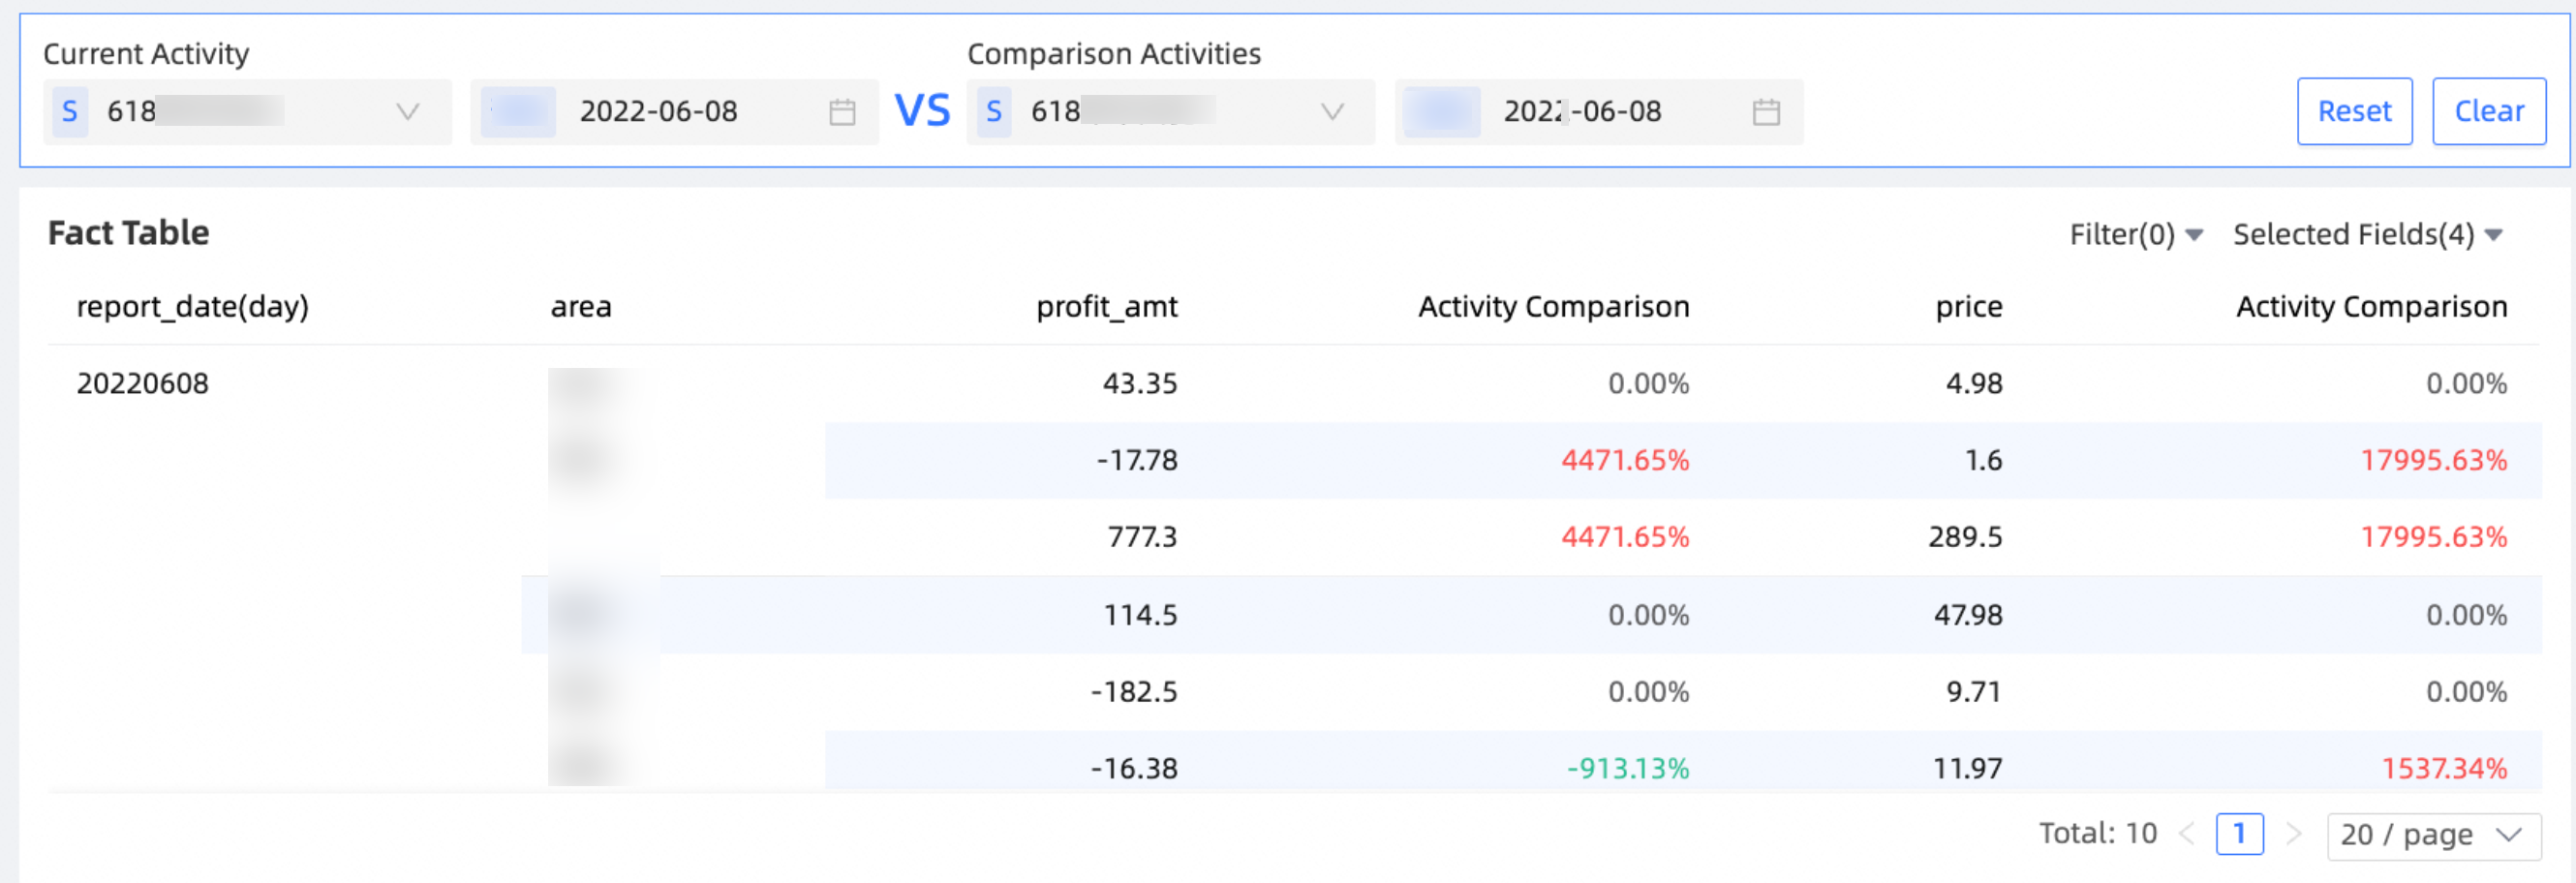
For more information, see Activity comparison control.
The time granularity selection of T is added to the query control relative time.
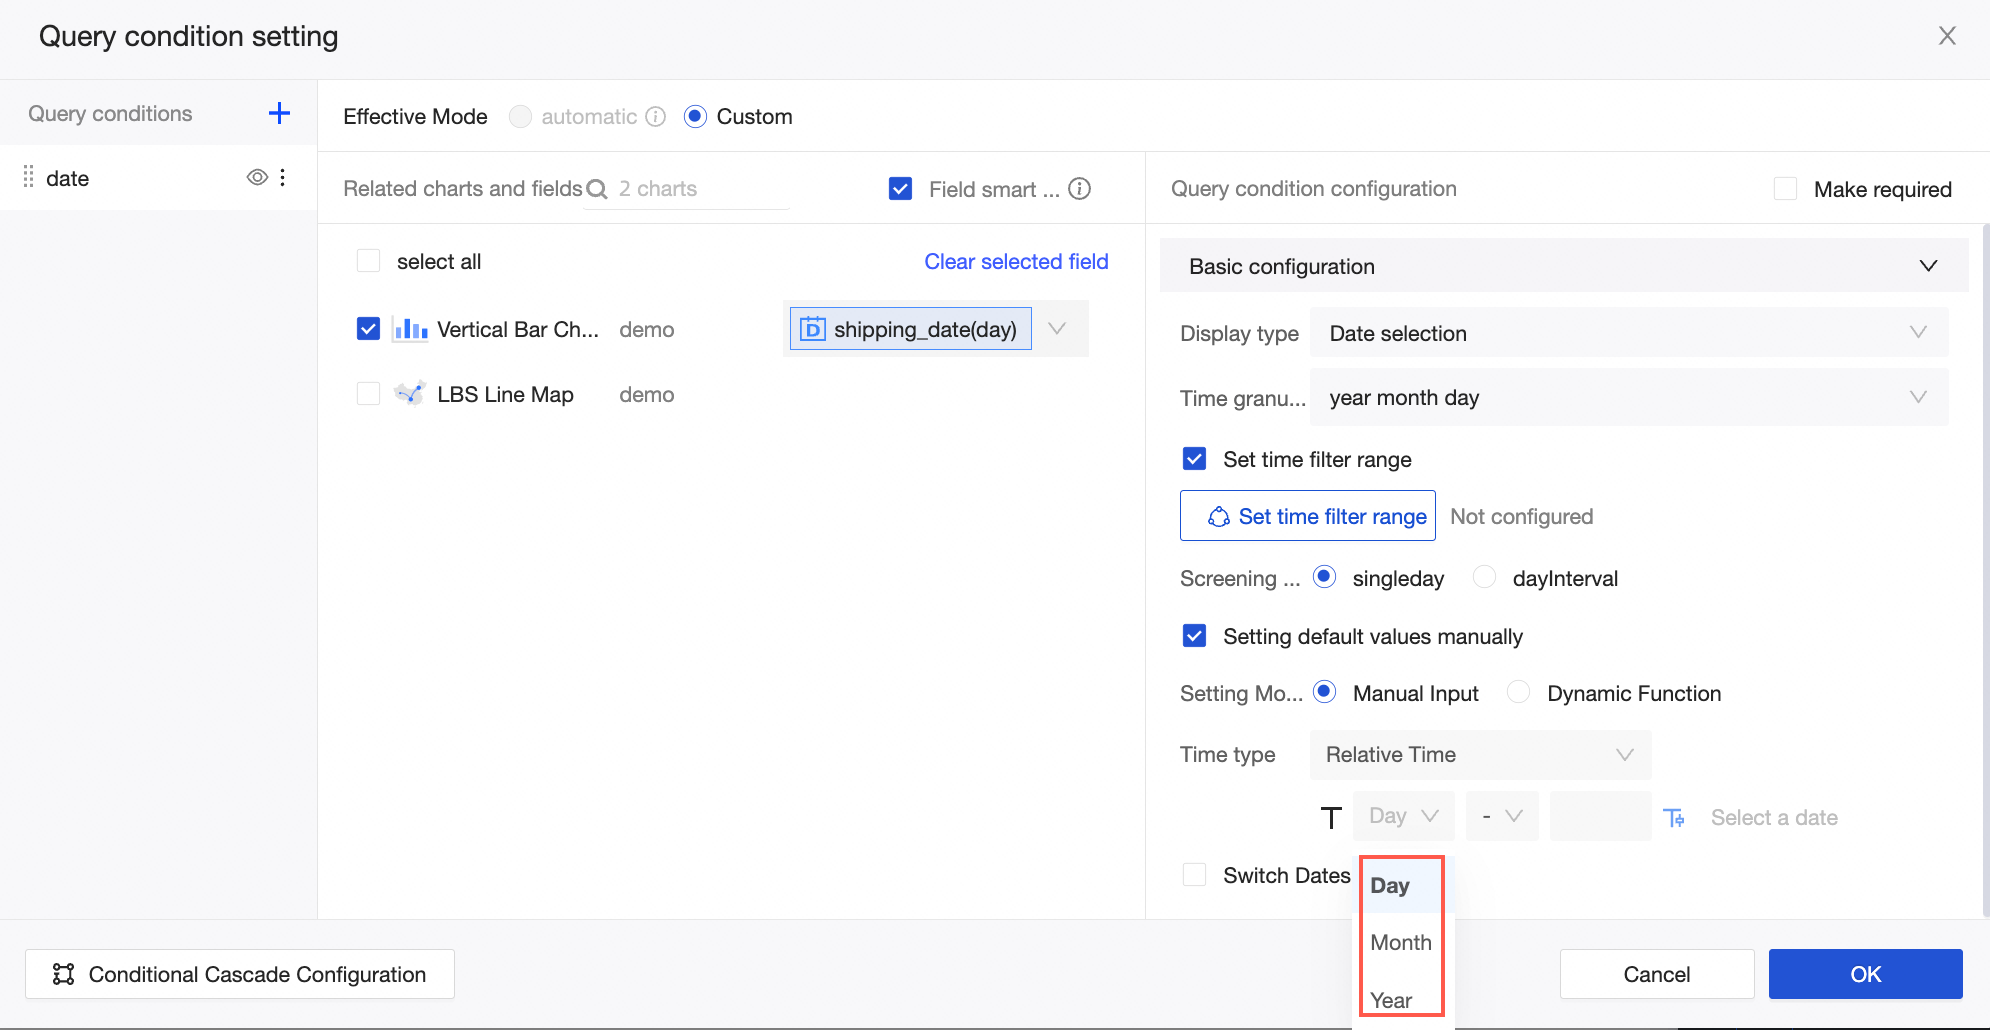
For more information, see Date query and Field filtering.
New advanced computing capabilities are supported. Cumulative, Top N, Ranking, Percentile, and Percentage calculations are supported.
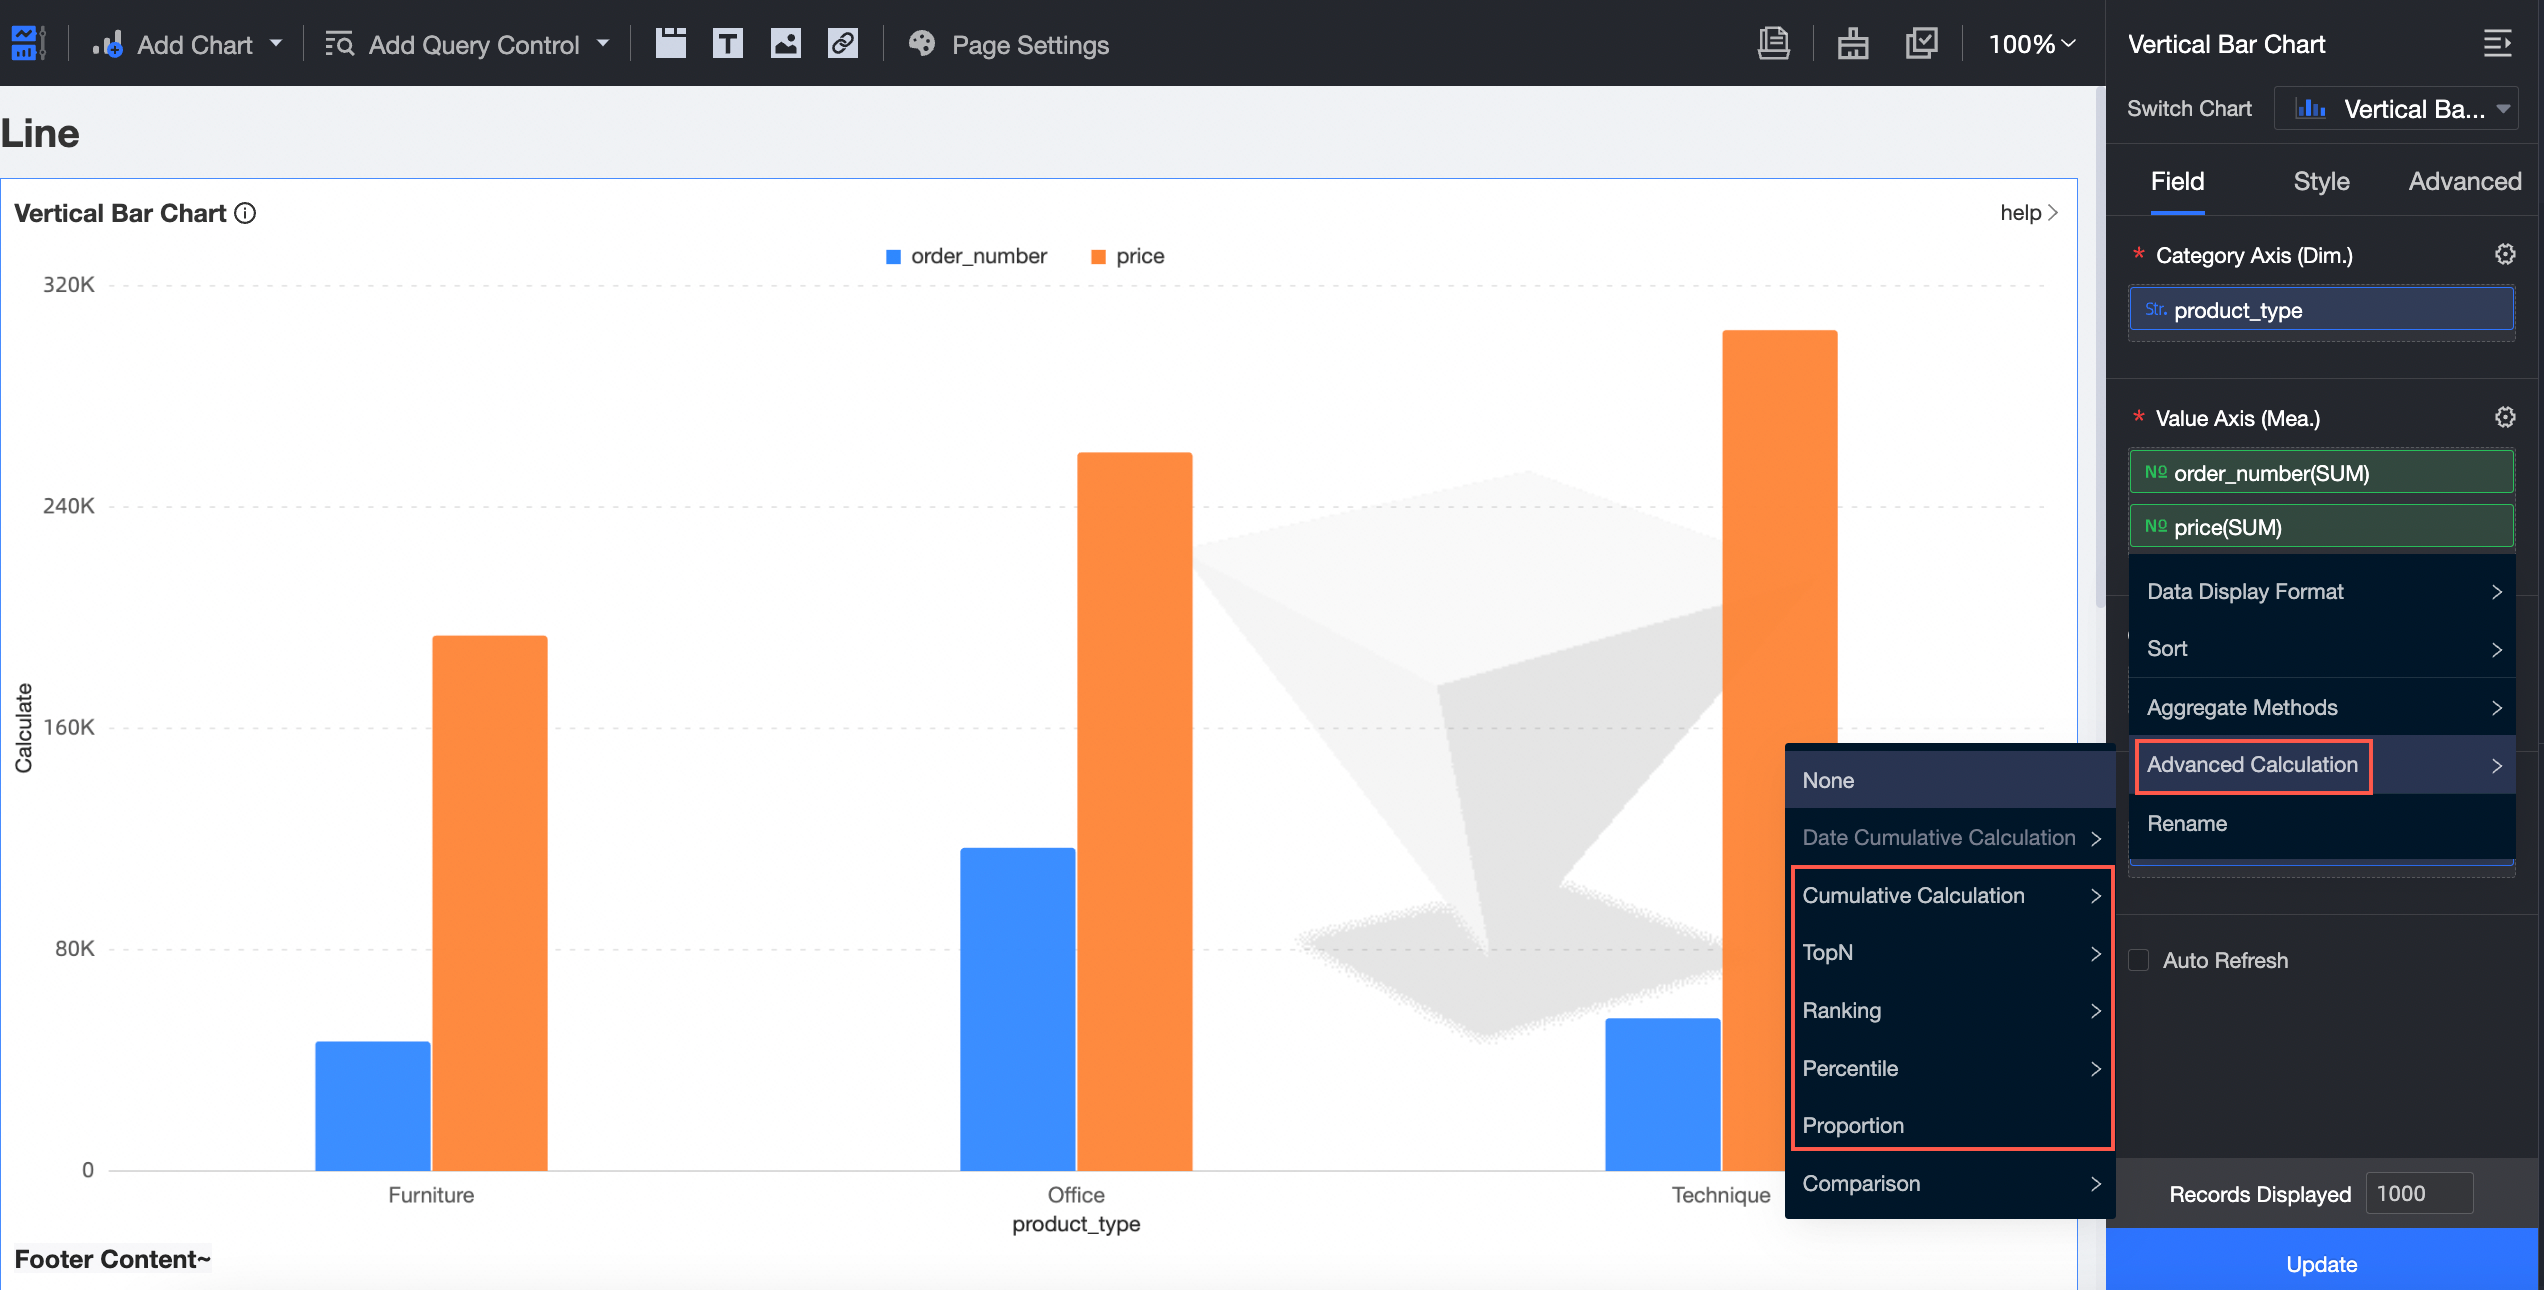
For more information, see Cumulative calculation, TopN, Data ranking, Percentile, and Percentage calculation.
Visual charts
Trend analysis tables support non-daily cumulative analysis.

For more information, see Trend analysis table.
Sankey diagrams support color settings.
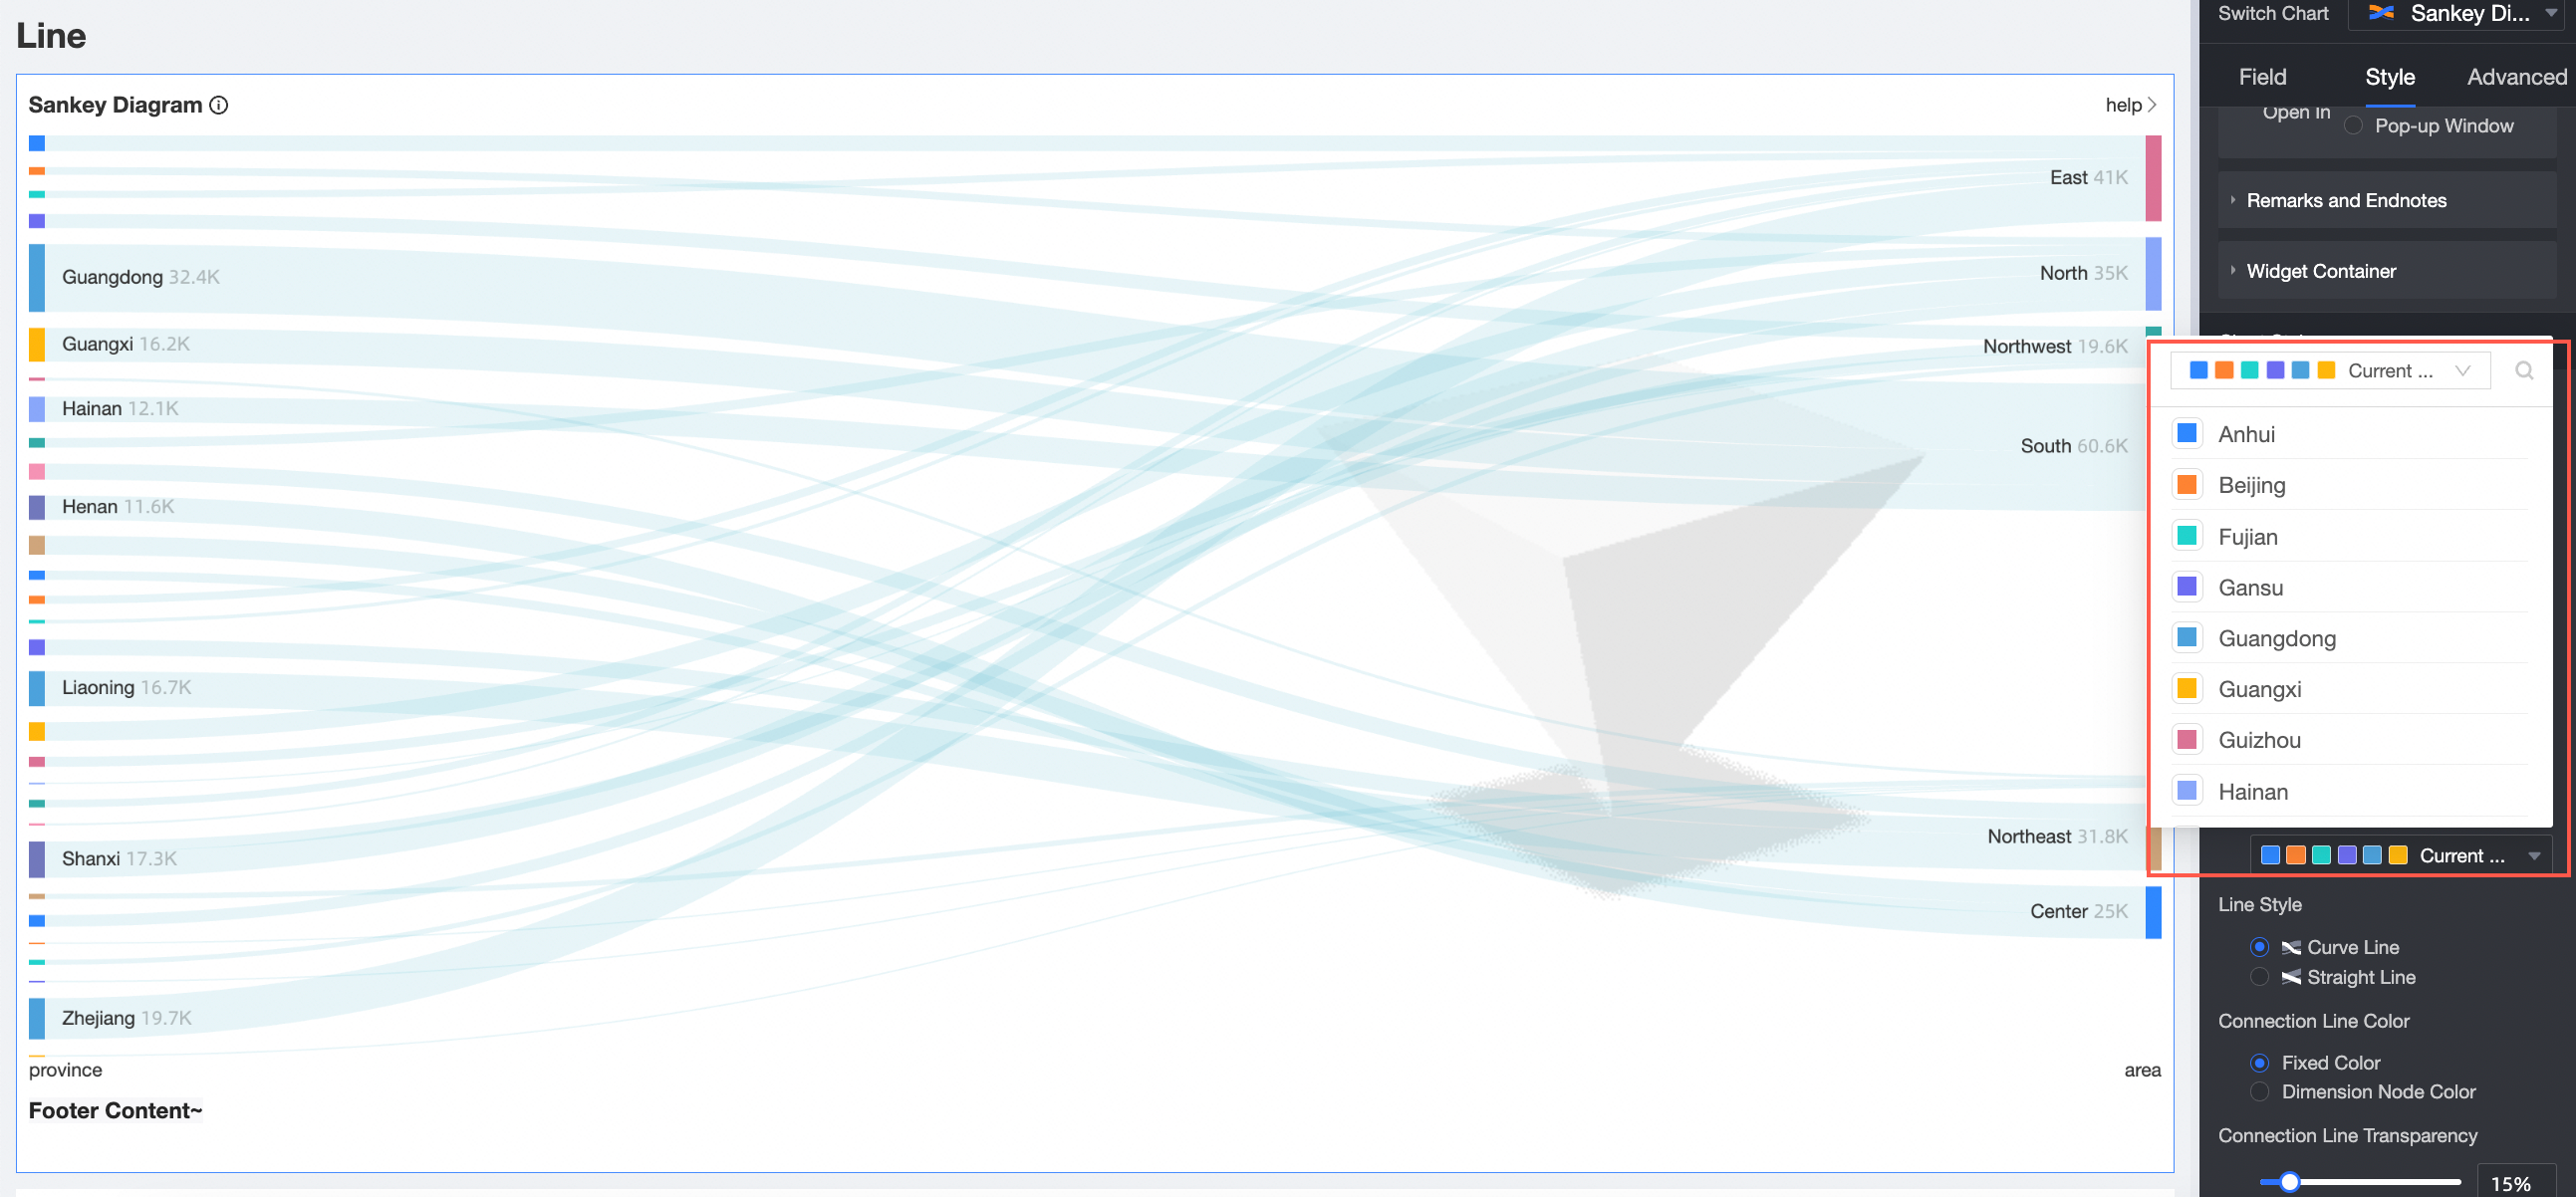
For more information, see Sankey diagram.
Cross table
Header and content style settings are enhanced. Header color and bold are supported.
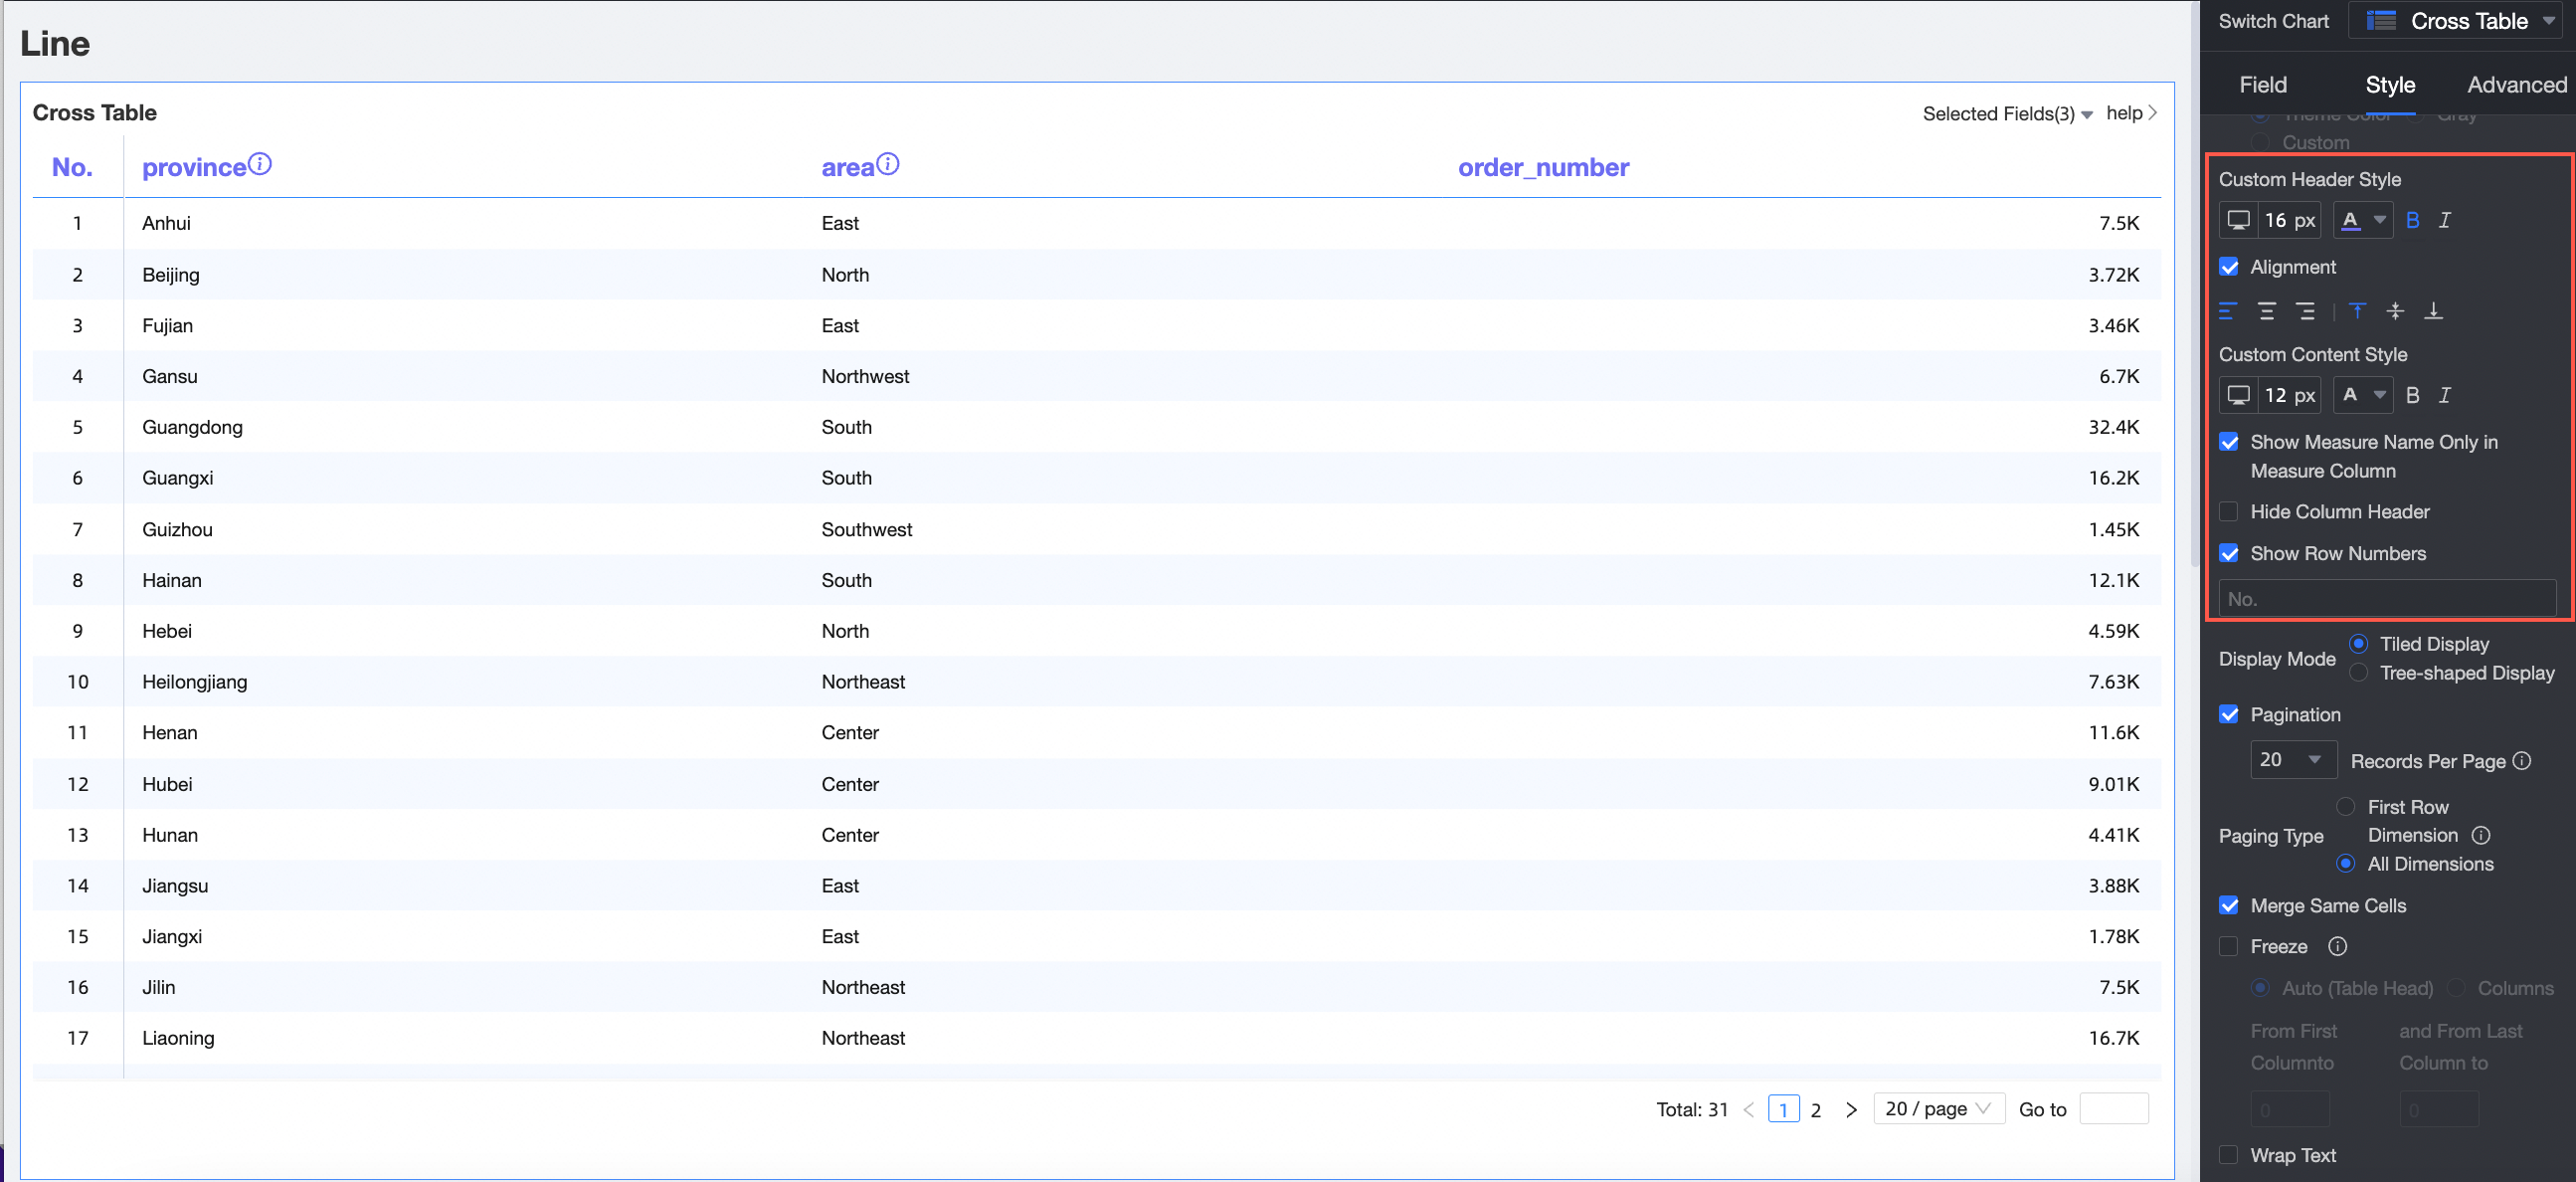
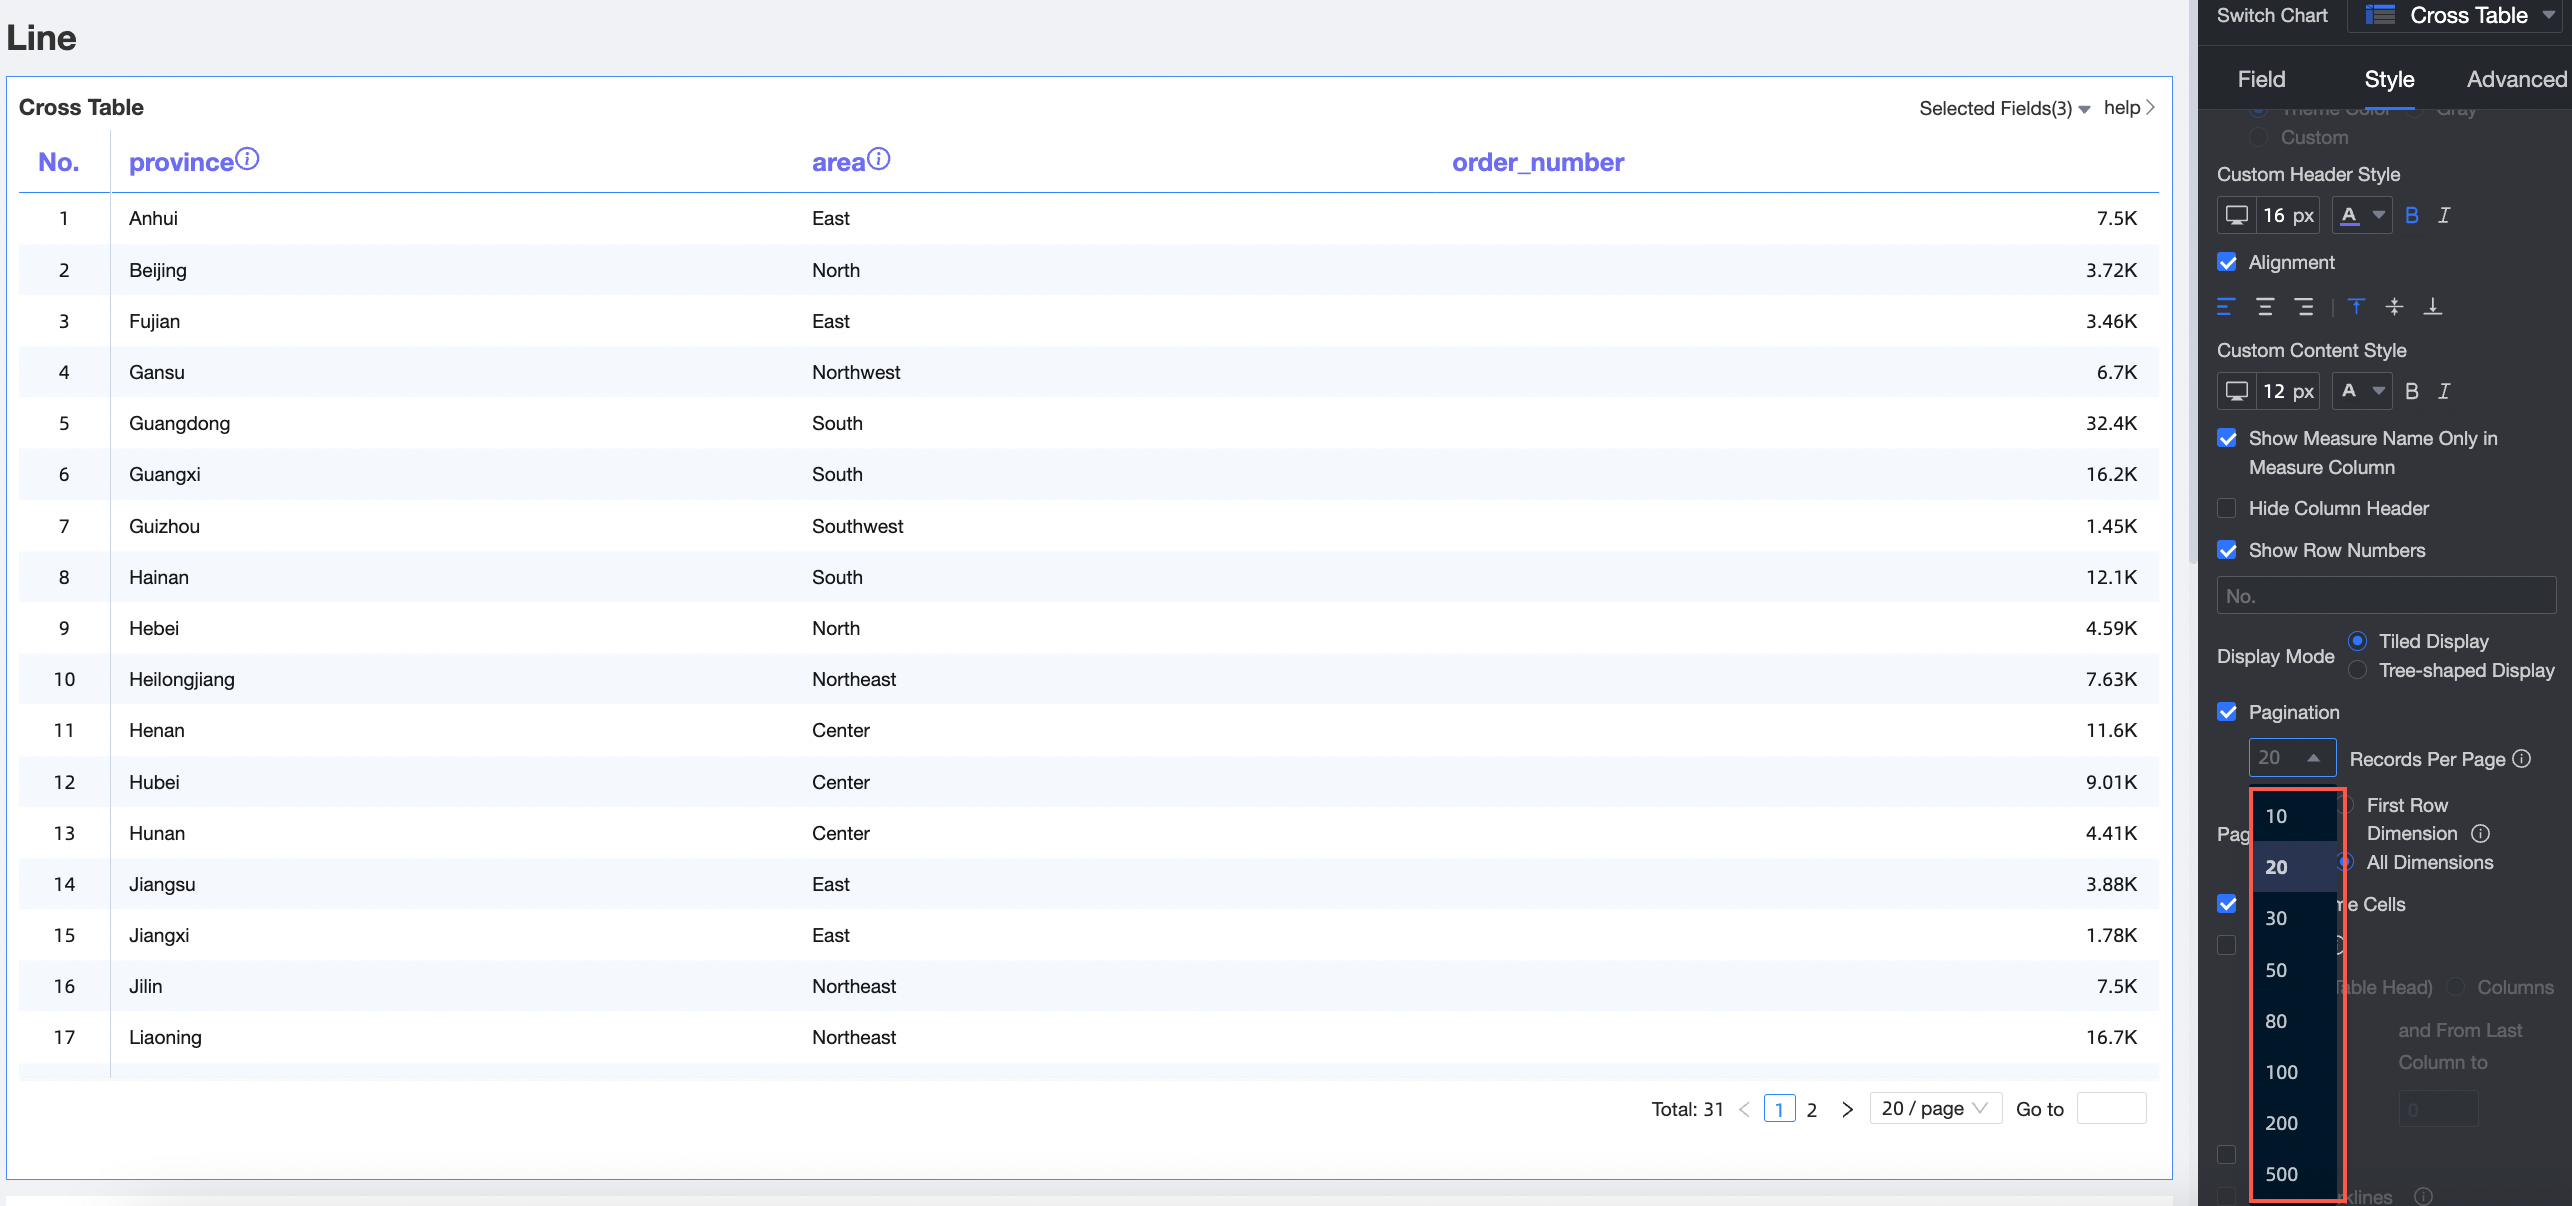
The crosstab pager supports custom paging levels.
The advanced sorting experience of cross tables is optimized.
For more information, see Cross tables.
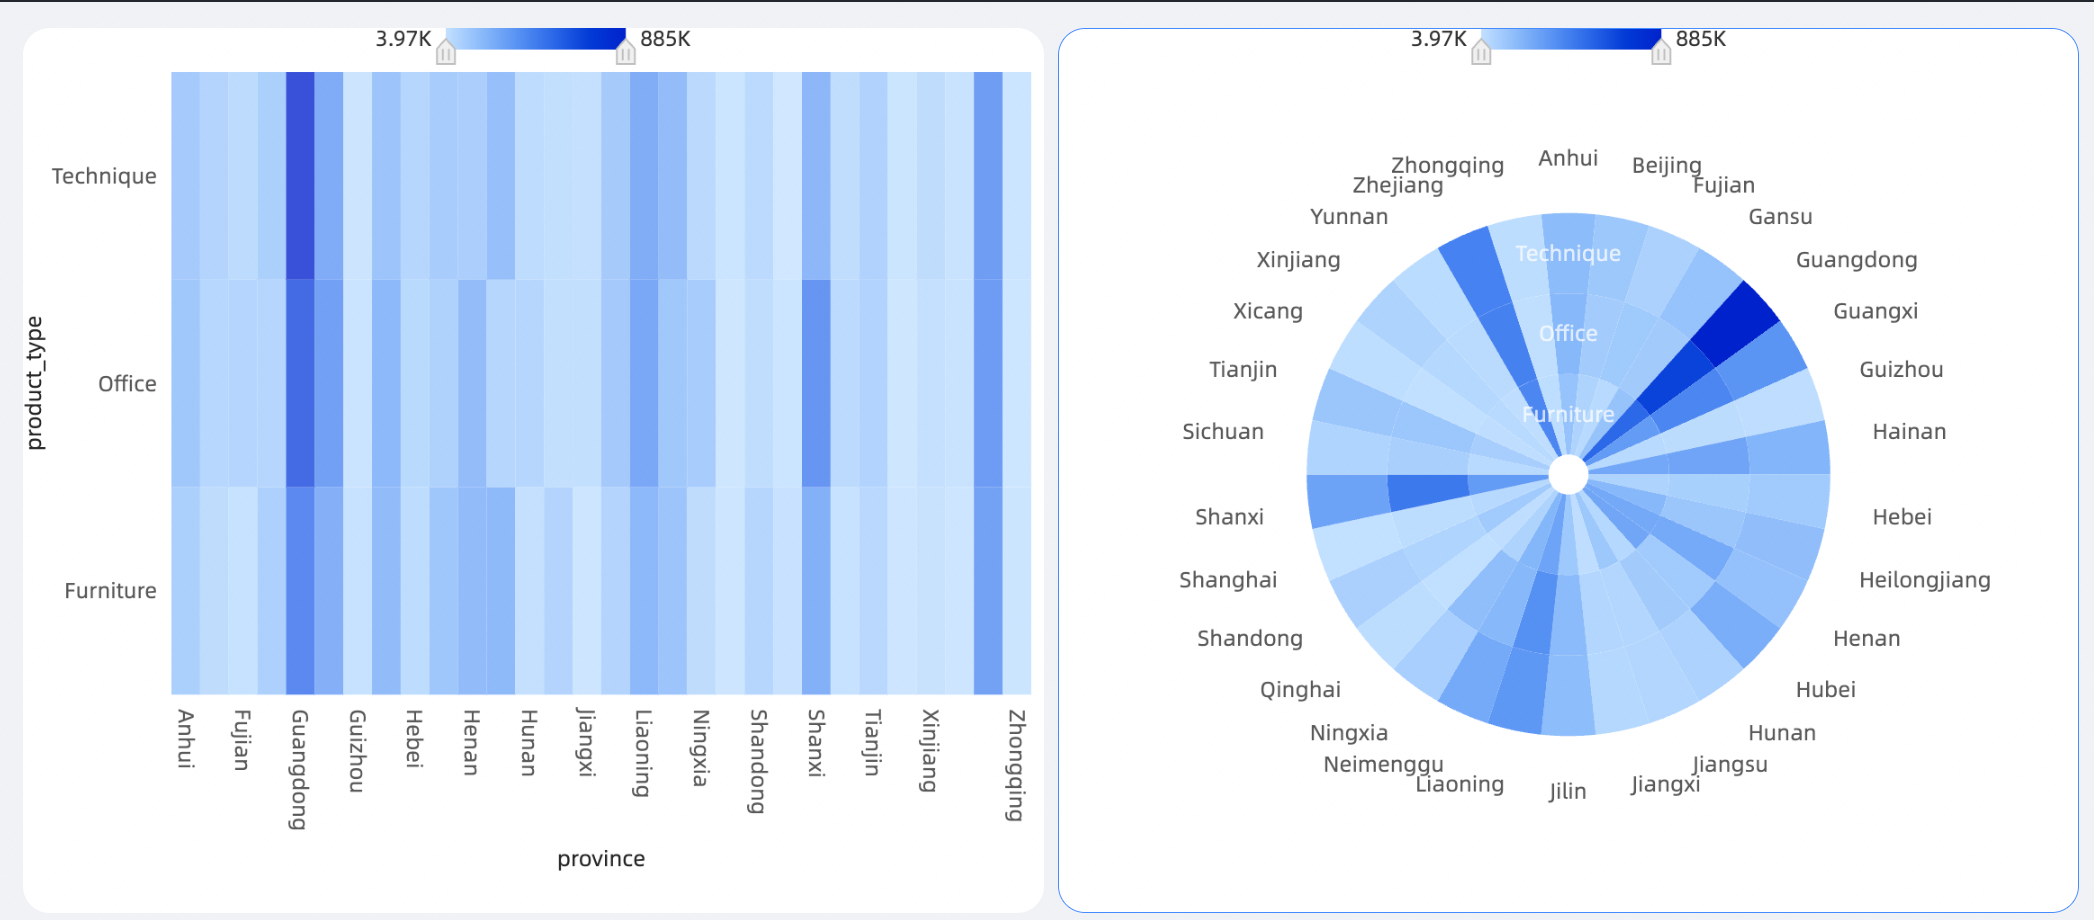
Added heatmap to show relevant scenarios in different dimensions.
See heatmap.
A new indicator diagram is used for the DuPont analysis model.
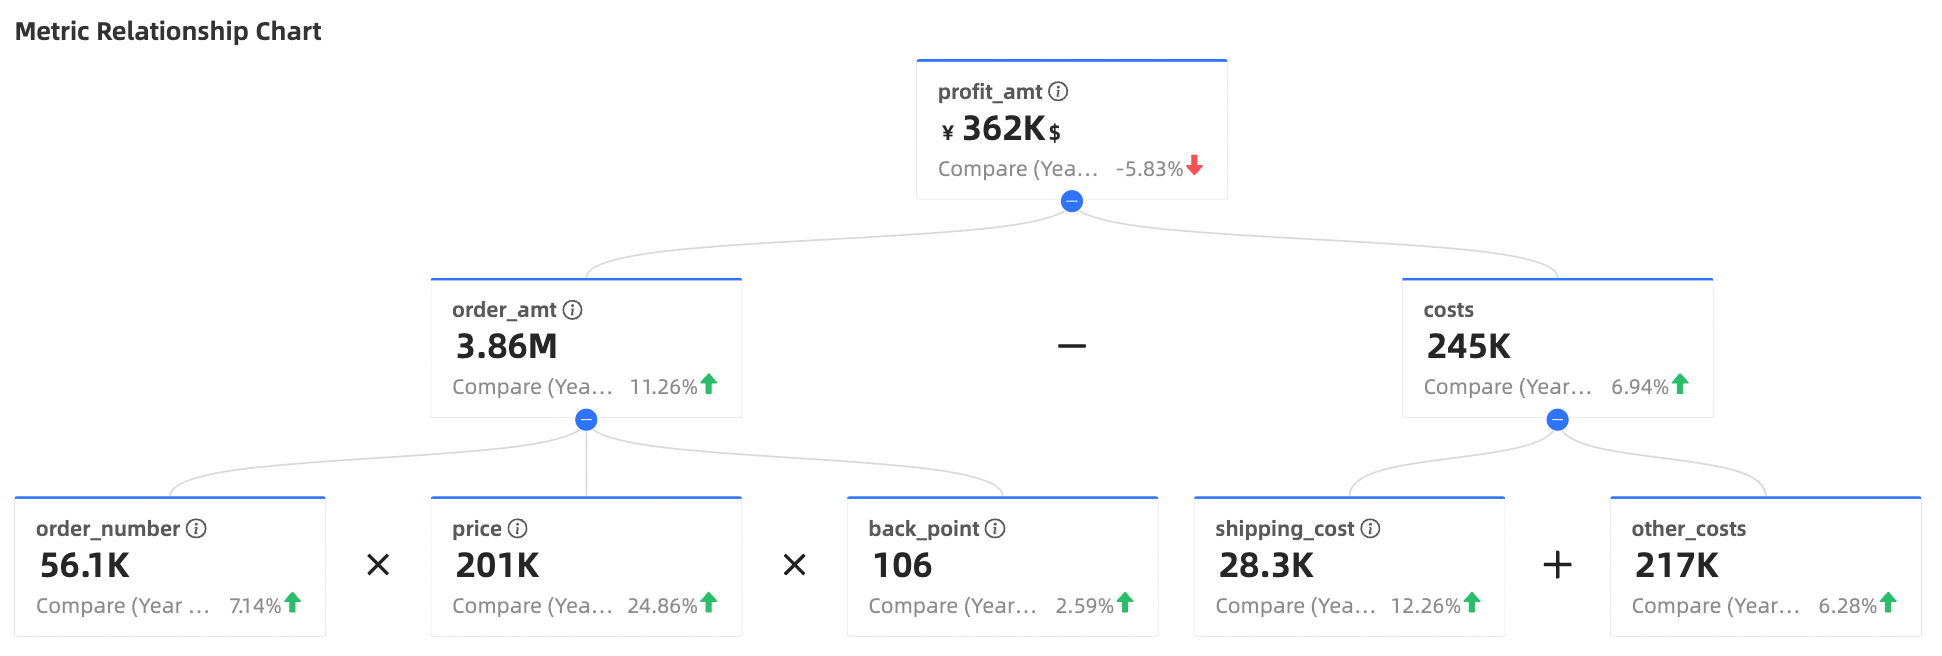
For more information, see Metric diagram.
Map
The custom map widget has been enhanced to support uploading JSON map information.
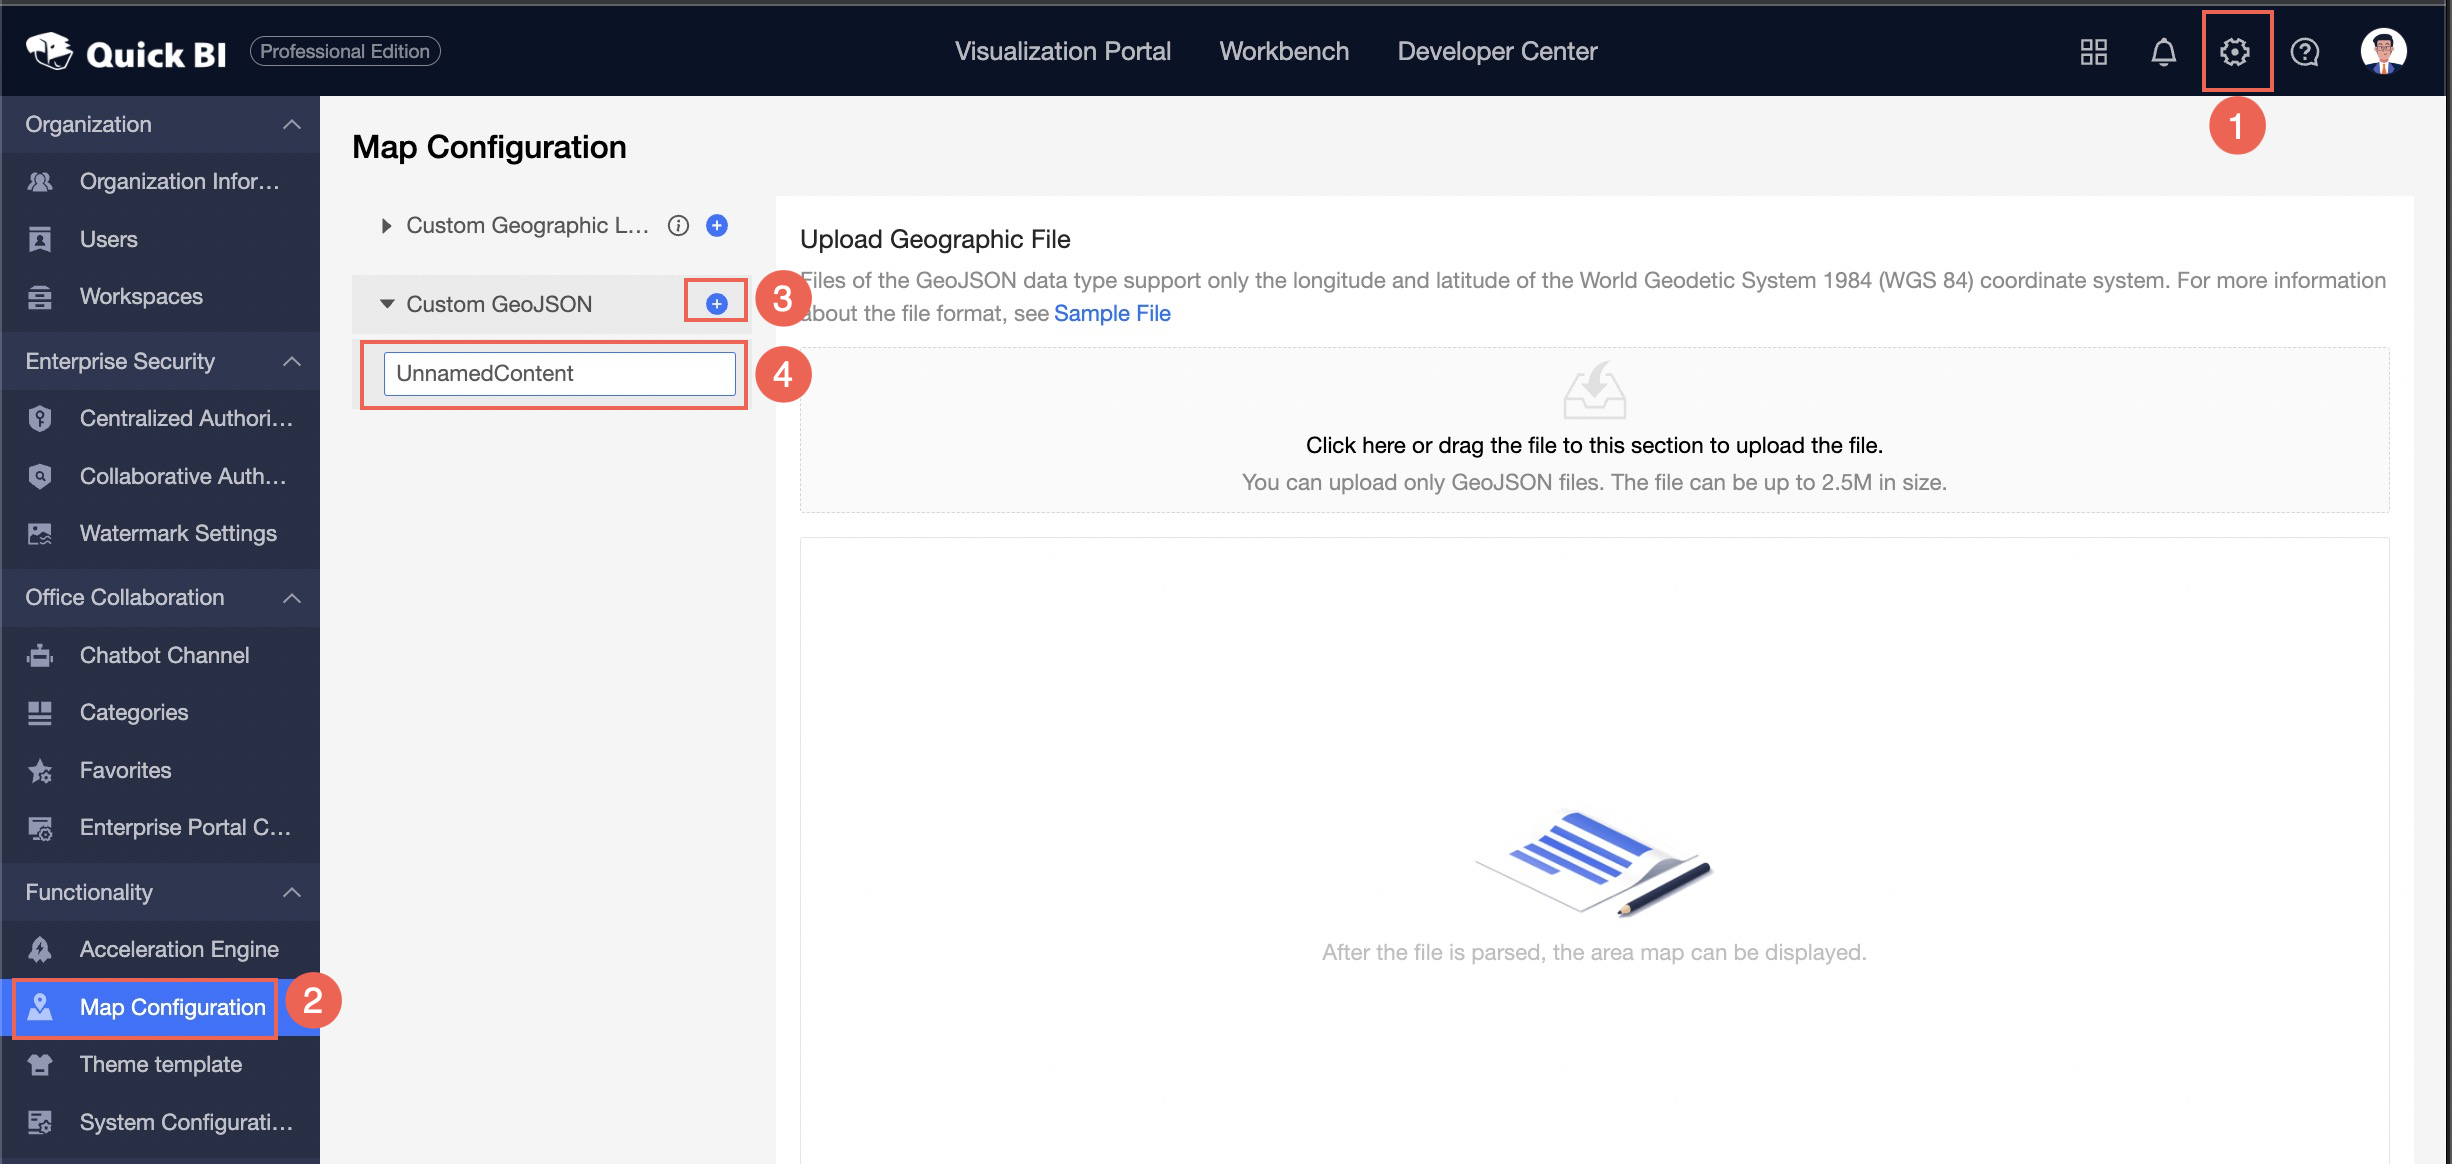
For more information, see Customize GeoJSON.
The map tunnel is expanded. The flying line map allows you to control the flying line thickness and color by using measures.
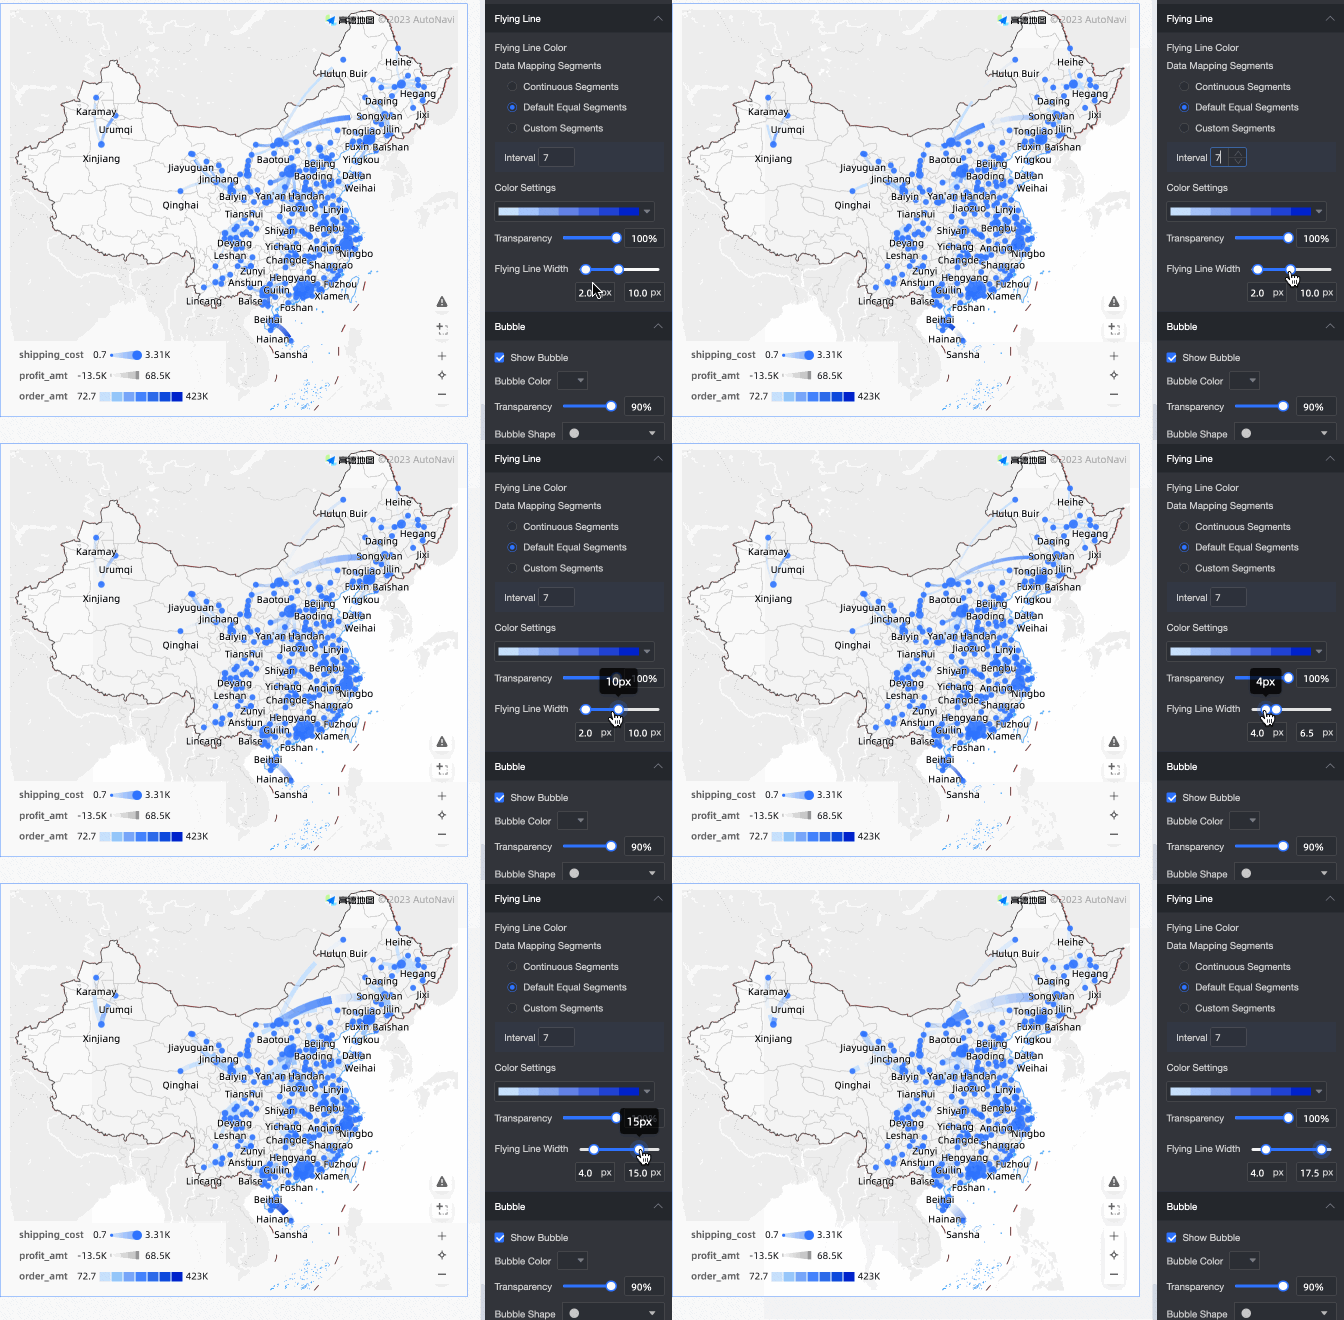
For more information, see LBS flying line map.
New shape layers for heat /flying line maps.
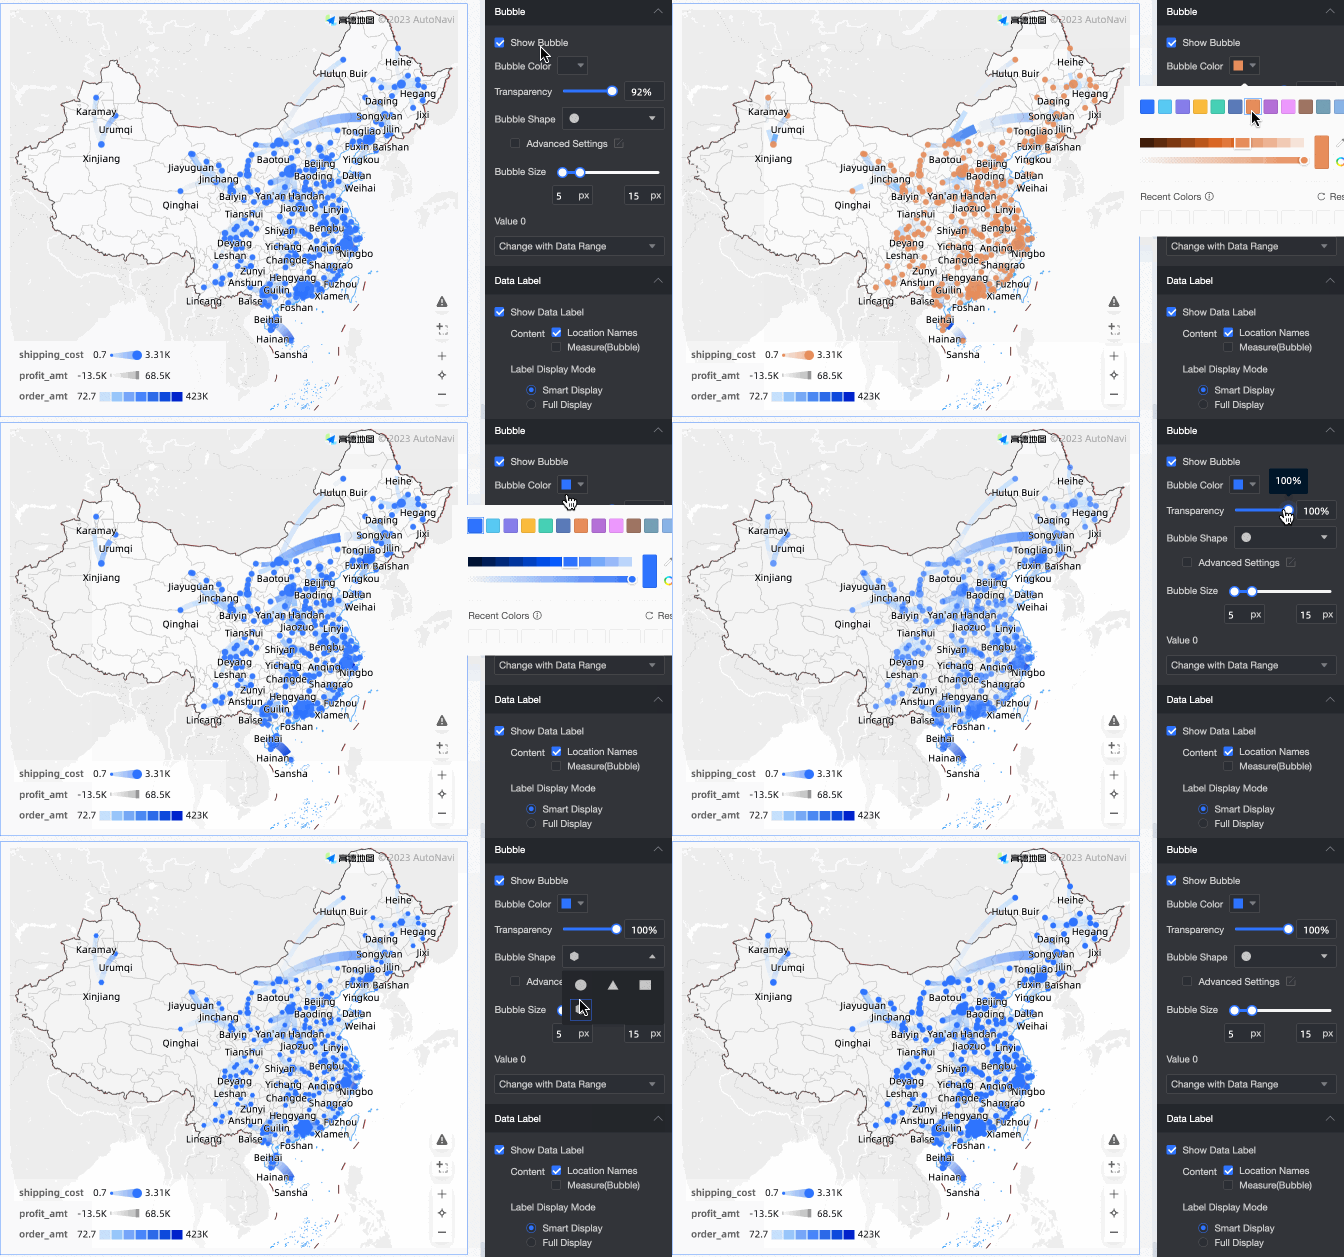
For more information, see Flying line map and Heat map.
Experience optimization
The background color of the card supports gradient color.
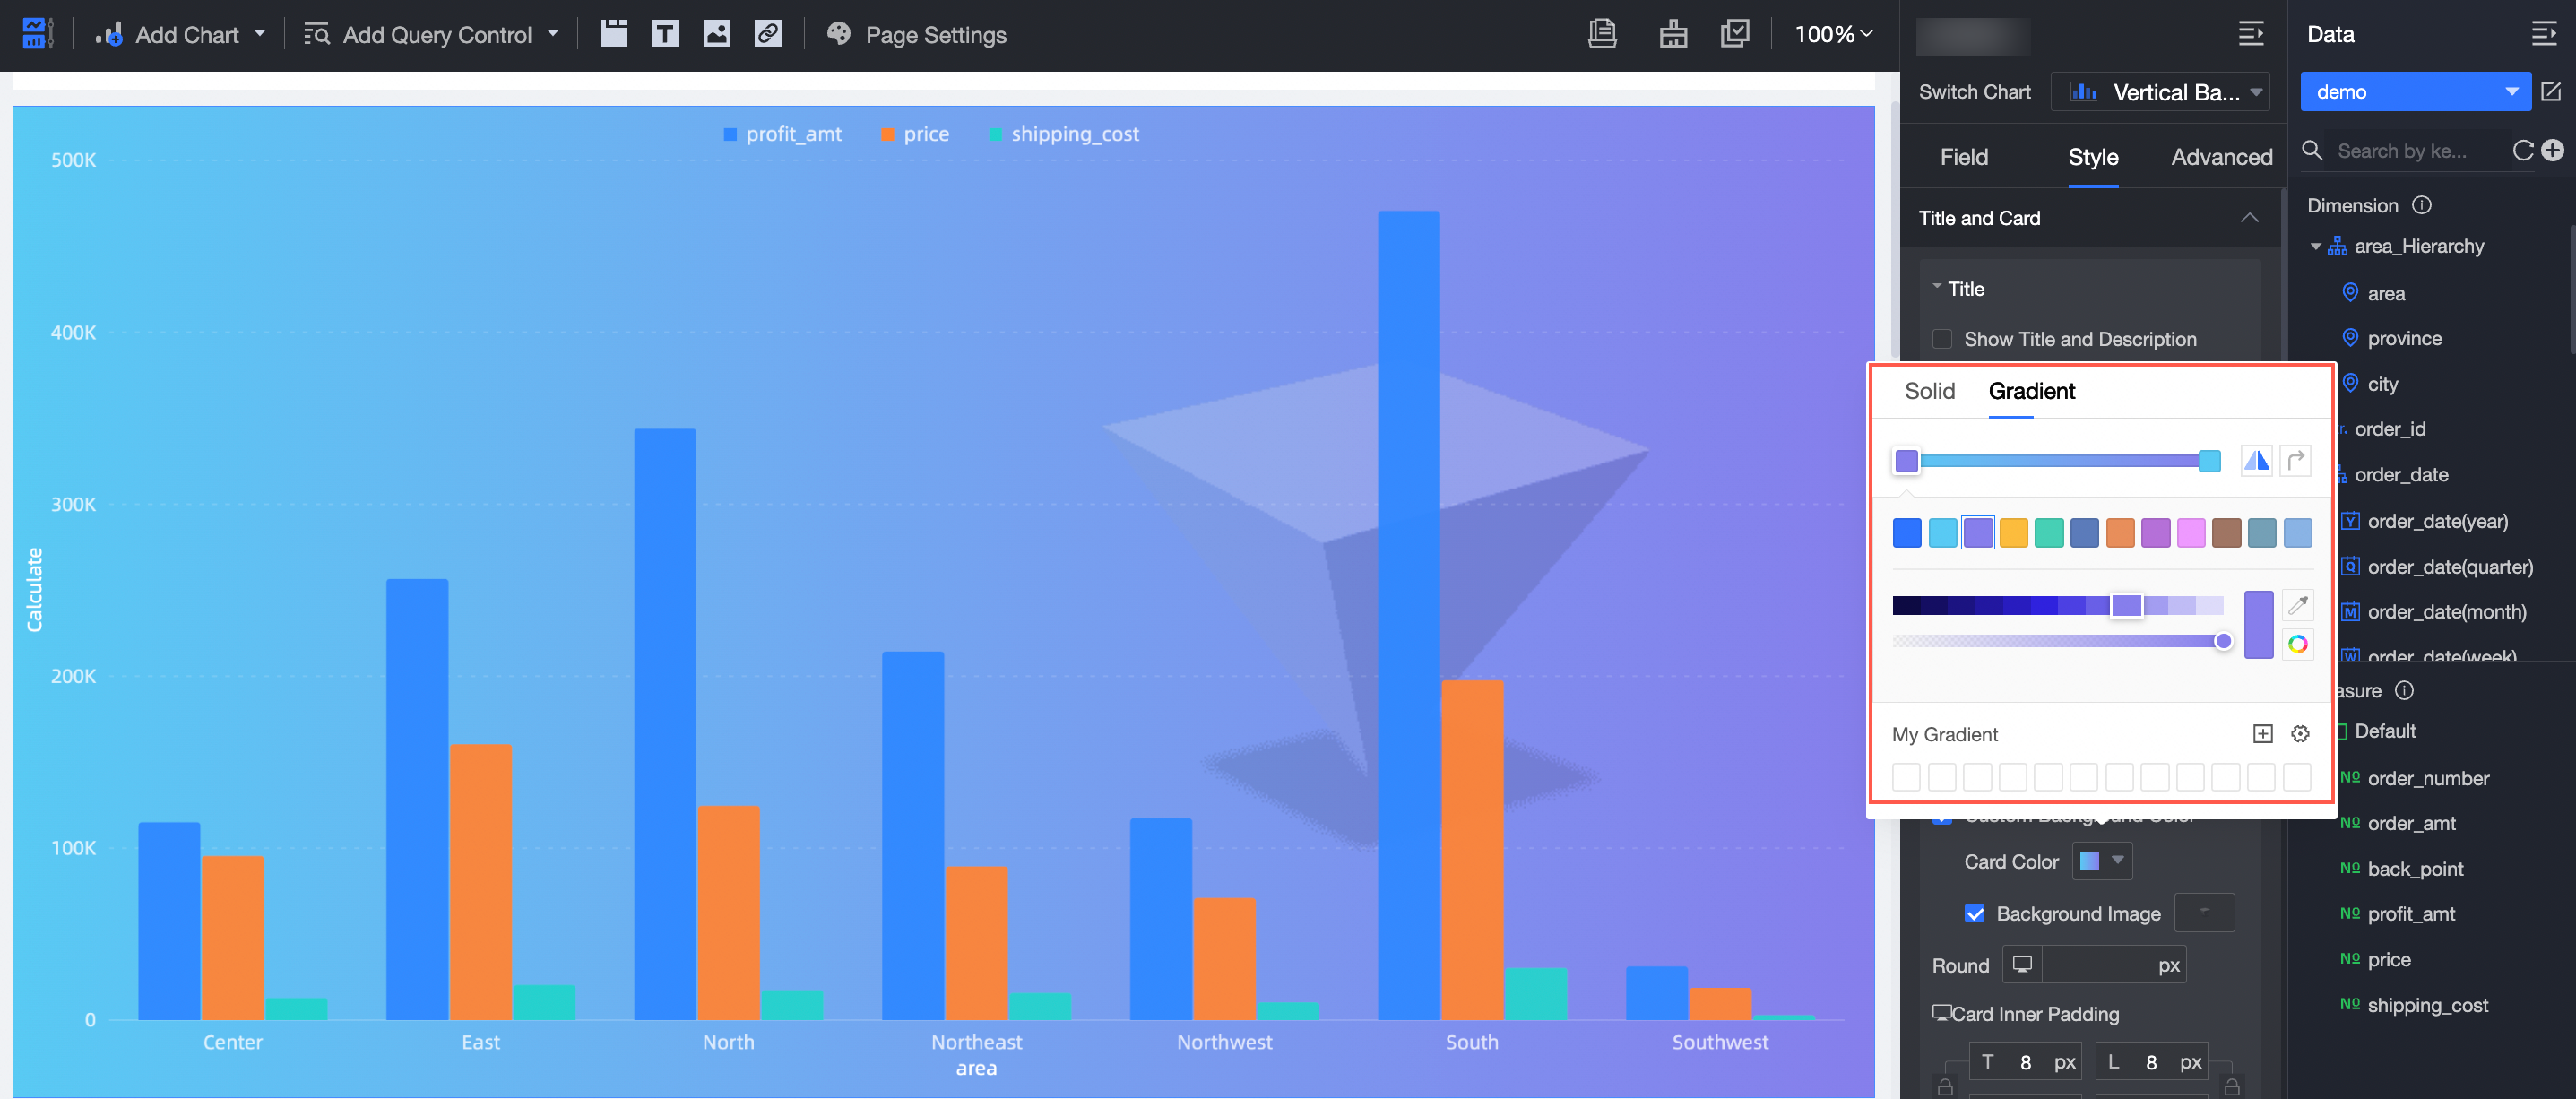
For more information, see Configure chart titles.
Brand Color /Theme Color-New&Fine-tuned.
For more information, see Theme design.
The left-side navigation pane can be hidden when Enterprise Portal is embedded as a page.
You can rename a list page by double-clicking it.
PC-side home page report viewing supports thousands of people and thousands of faces.
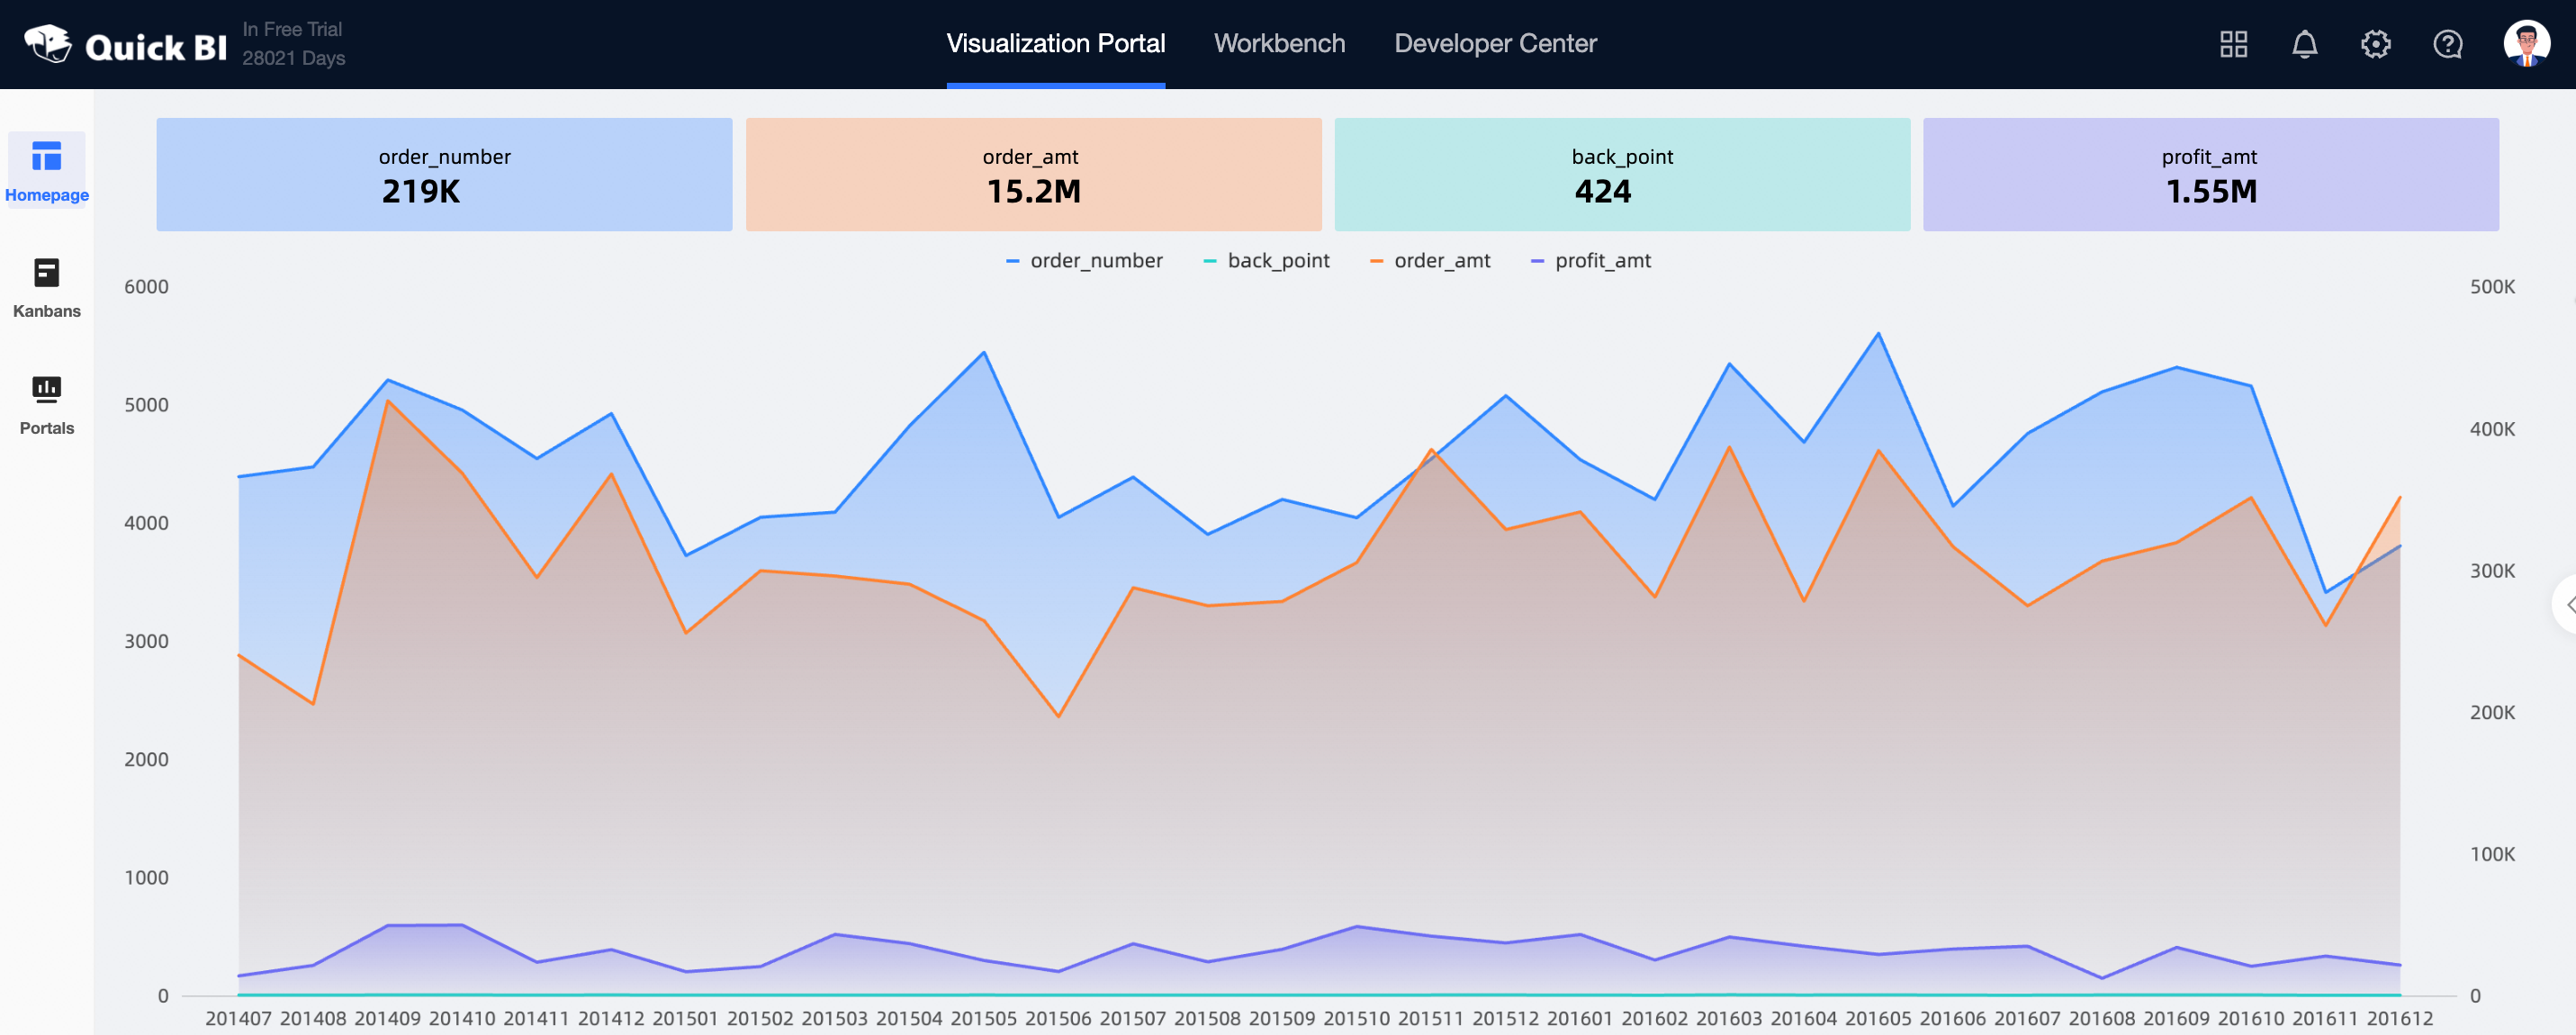
For more information, see Configure a custom enterprise portal on a PC.
Spreadsheet
The cell theme feature is added to support custom theme colors and border types.
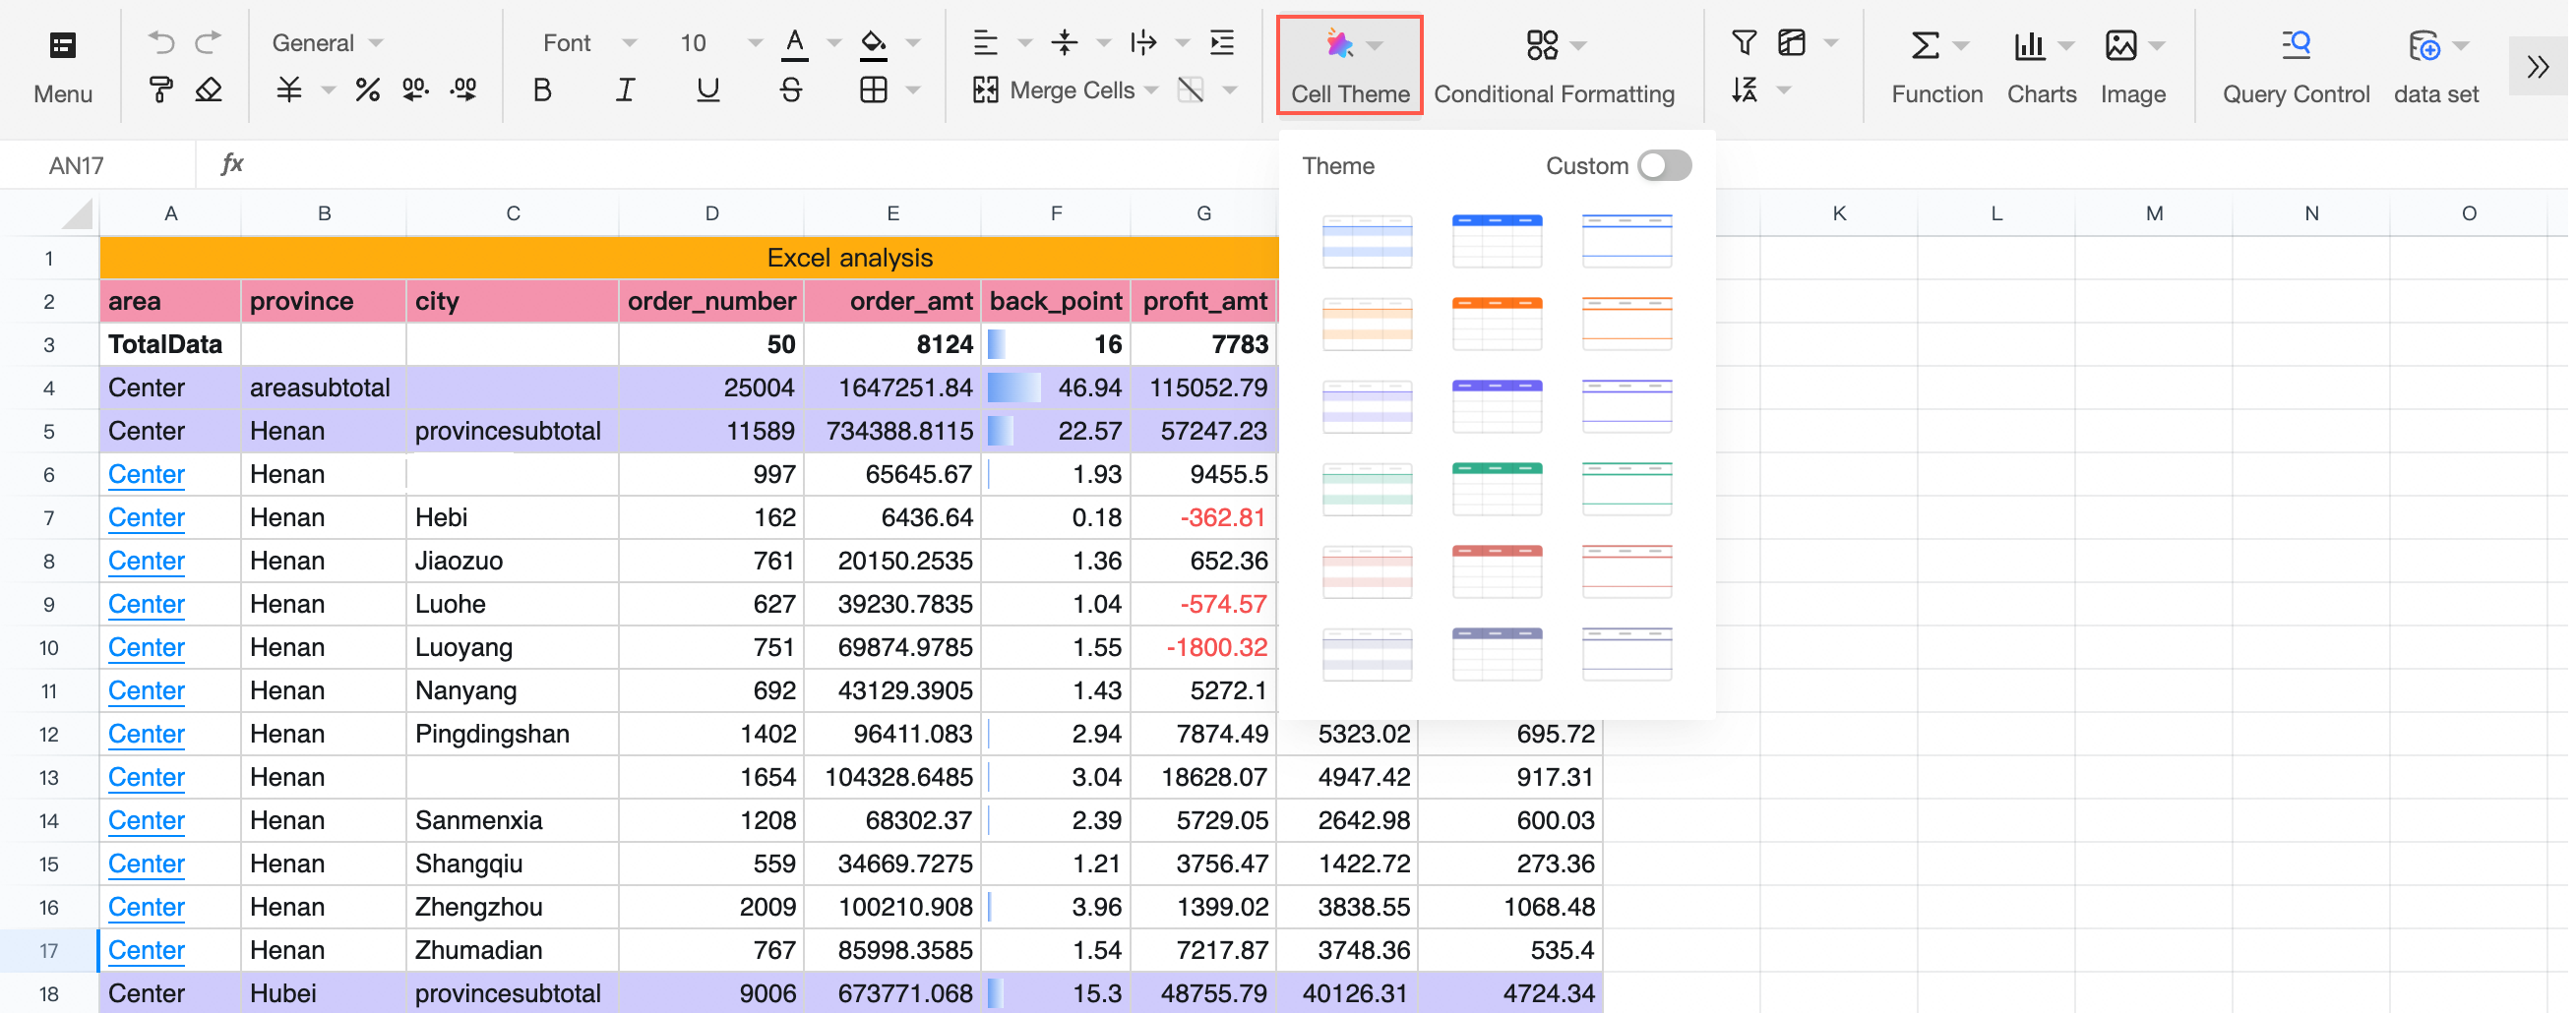
The toolbar is upgraded and visual icons are added to facilitate the positioning of feature portals.
Subscription
The mail subscription global parameter generator supports configuration time, value, and other types.
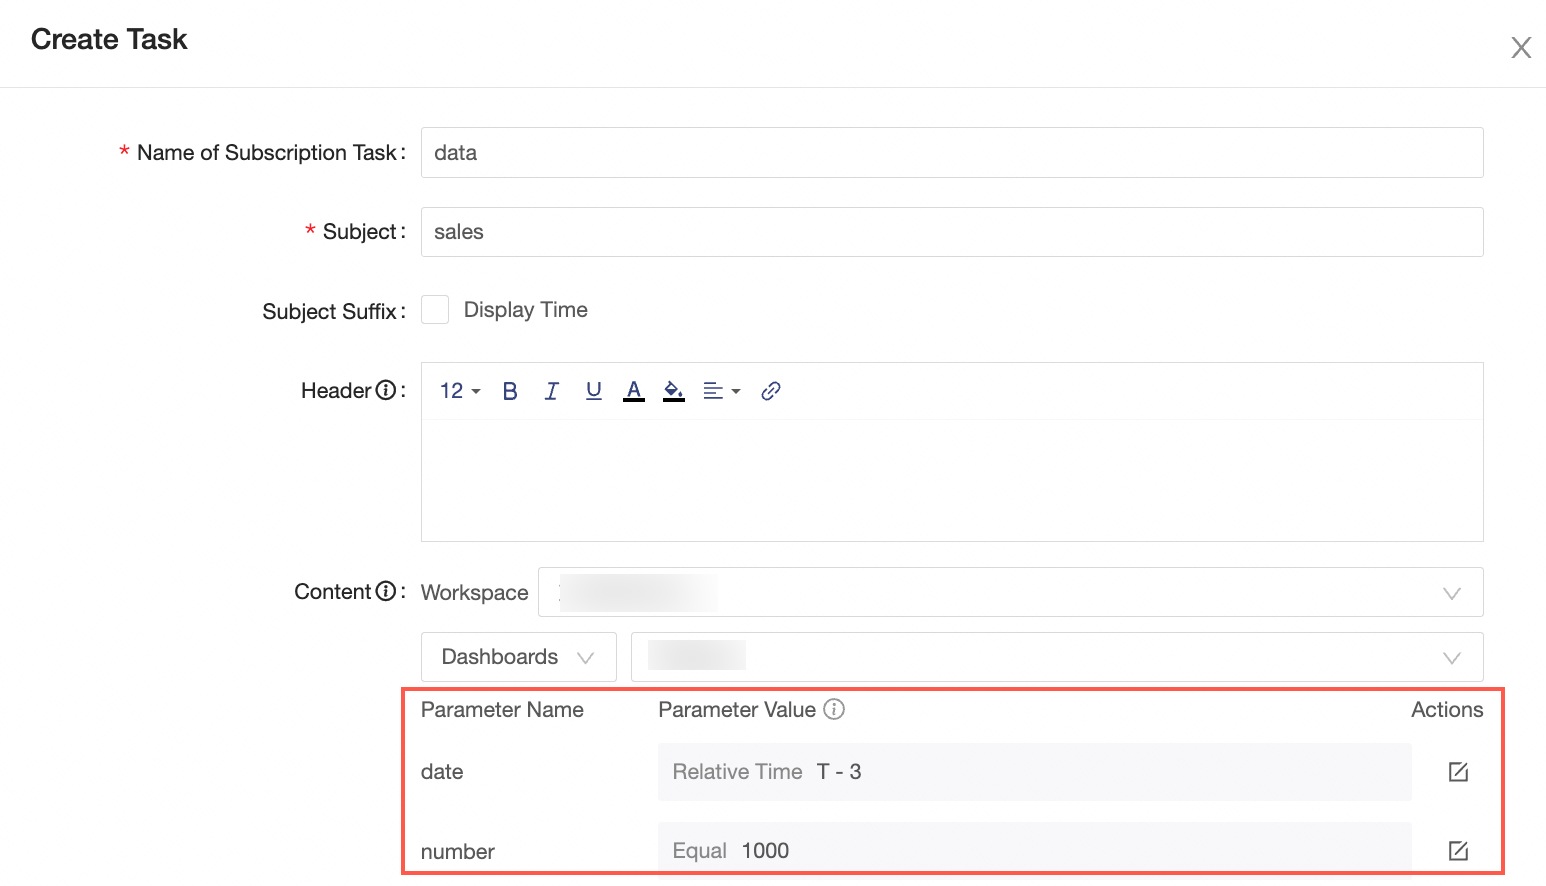
For more information, see Create a subscription task.
Subscription push, detailed error logs, support users can quickly locate the chart configuration, accept channel configuration and other issues.
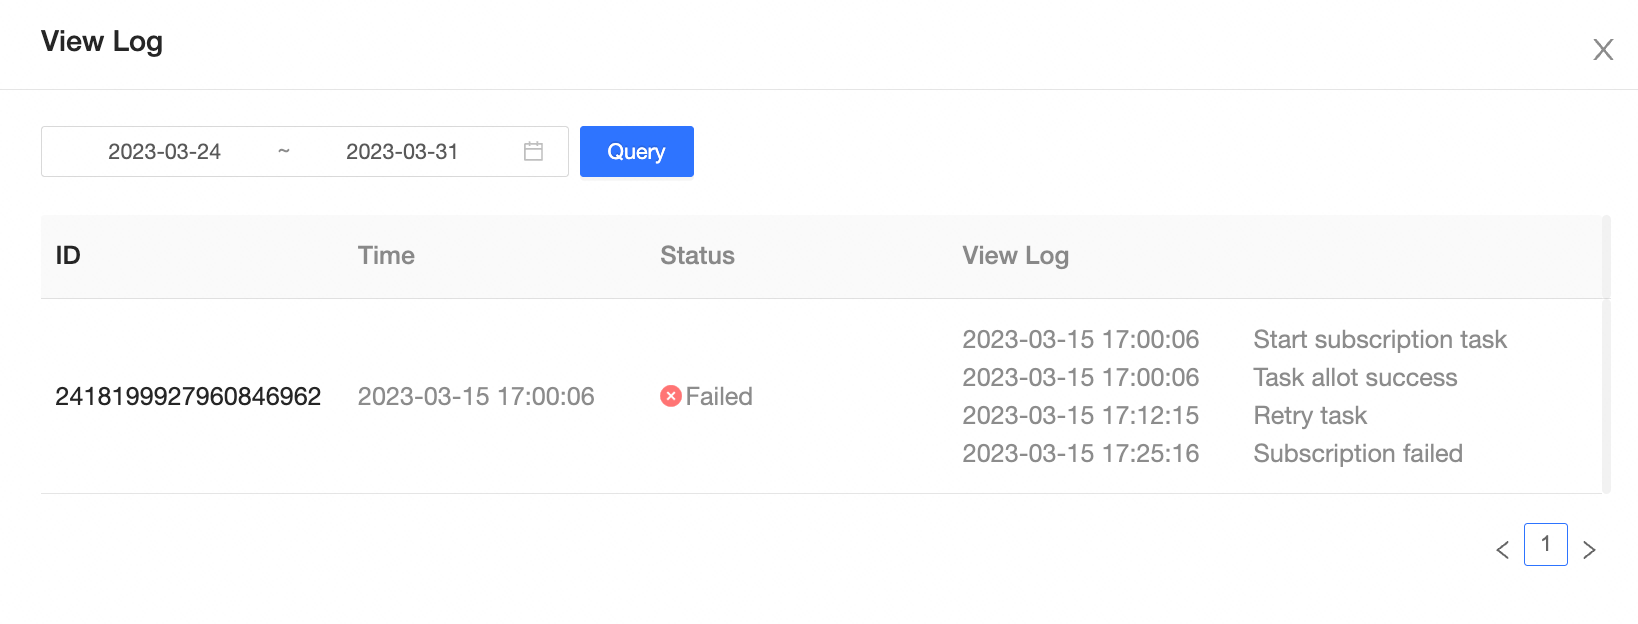
For more information, see Manage subscription tasks.
Organization Management
The user list supports global sorting.
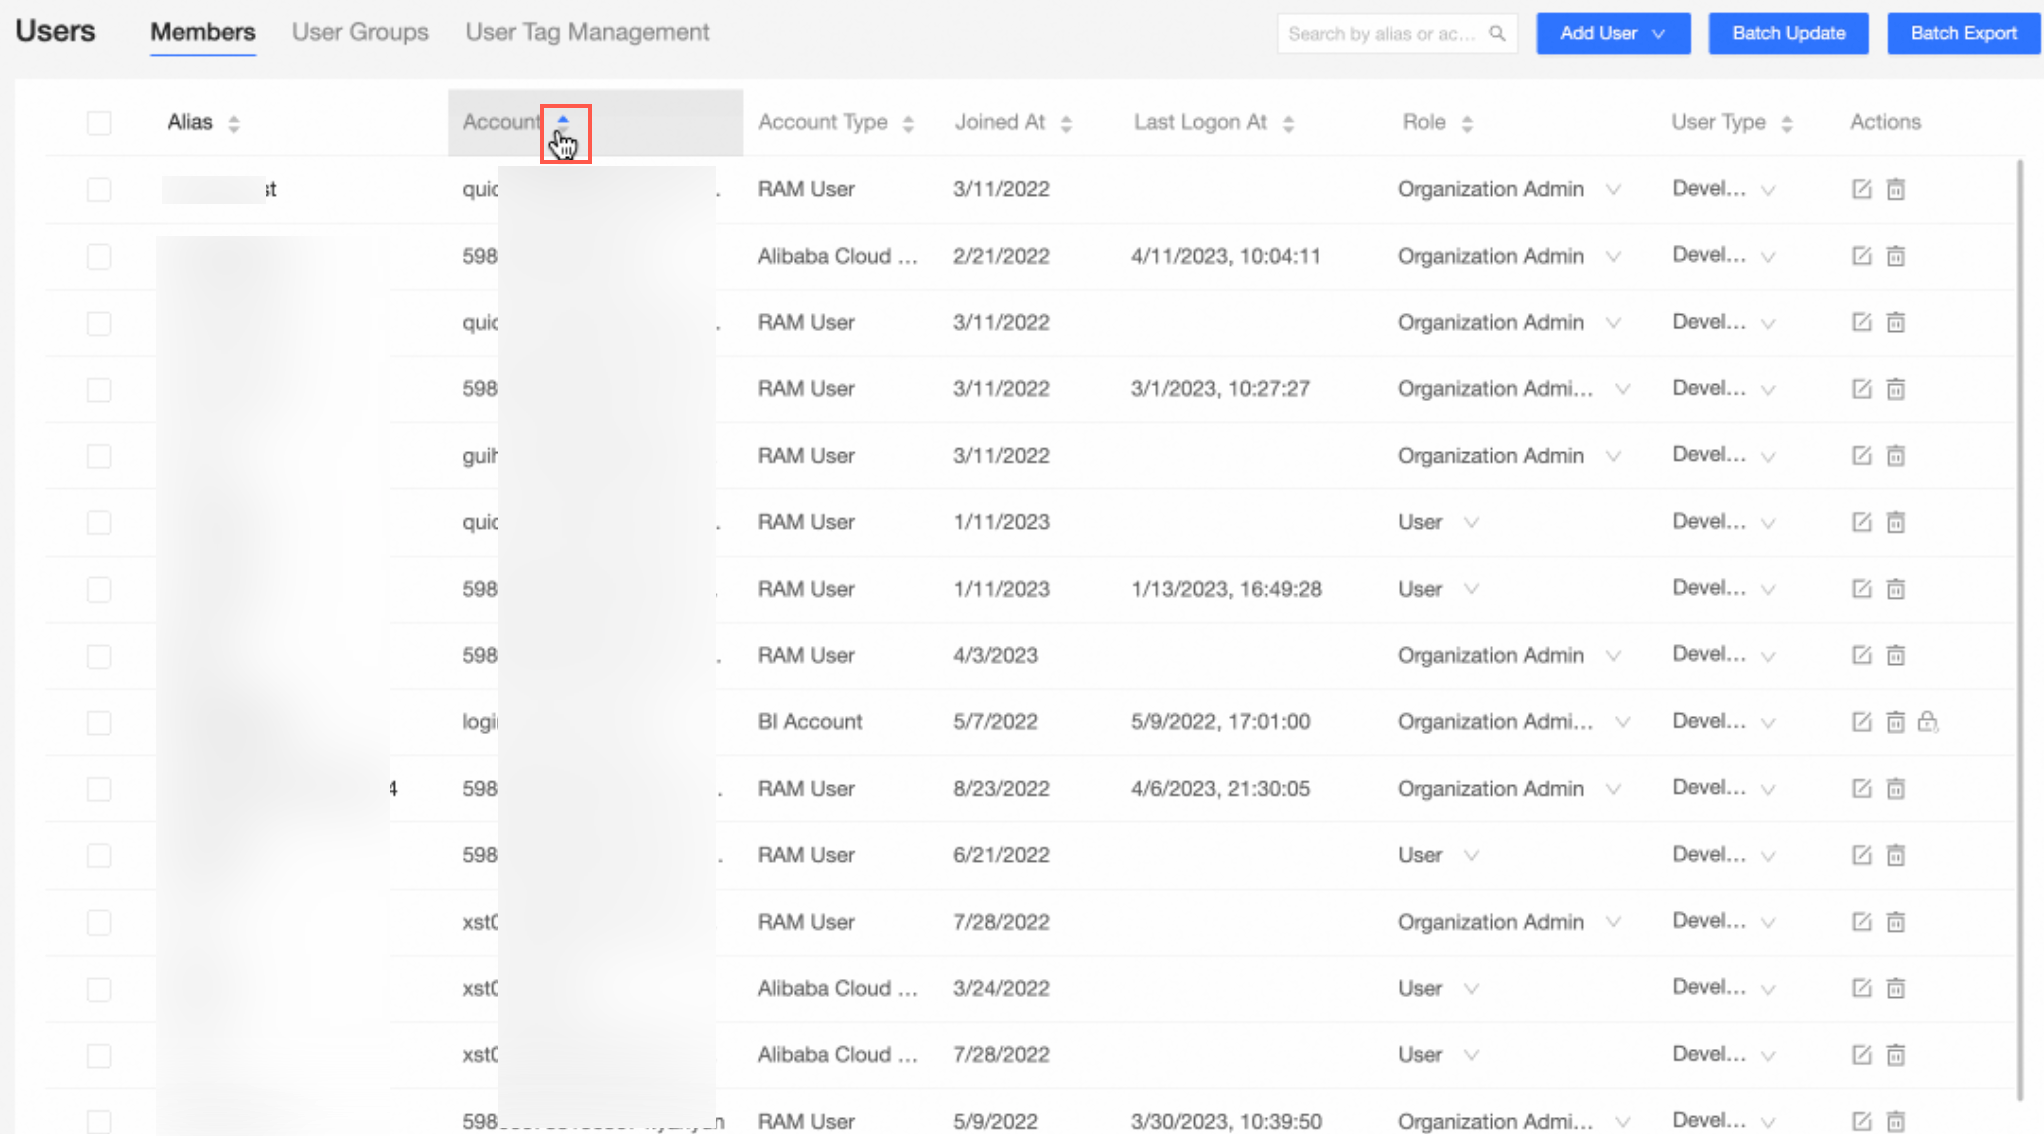
For more information, see Manage organization users.
Audit logs
The Resource Analysis and Usage Analysis pages are added at the organization level, and the Resource Analysis page is added at the space level.
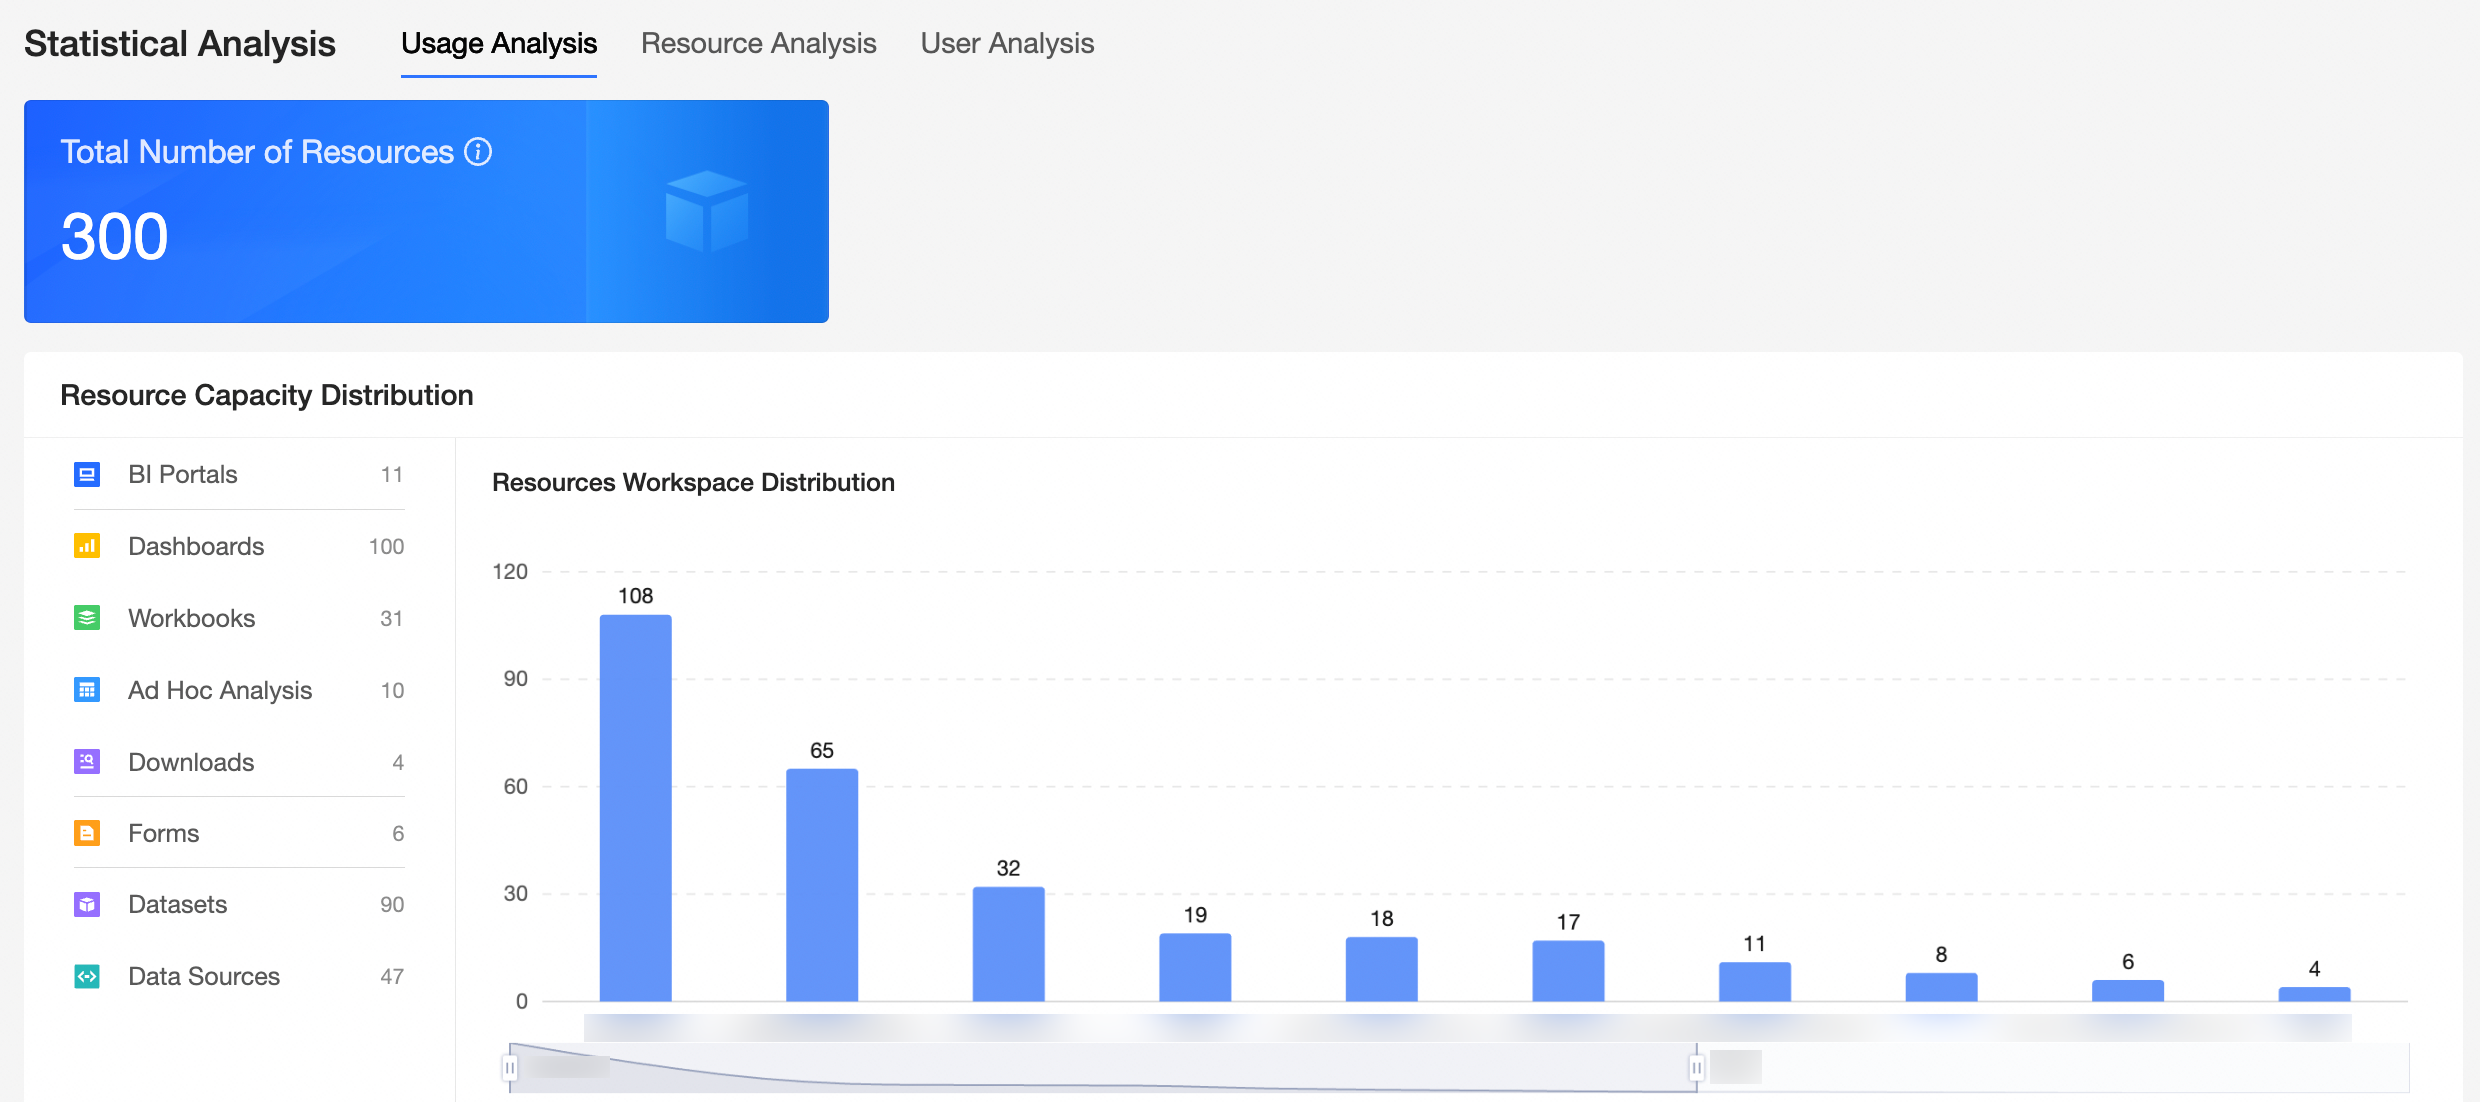
For more information, see Usage analysis and Resource analysis.
User analysis allows you to select all users and export access statistics based on all users at a time.
For more information, see User analysis.