RFM analysis evaluates user RFM metrics in an RFM model and shows the distribution of RFM user types.
Procedure
-
Go to the RFM Analysis page by using one of the following methods:
-
In the left-side navigation pane, choose User Insight > User Analysis > RFM Analysis.
-
Choose Workspace > User Insight > Marketing Models > RFM Models, find the target RFM model, and click Analyze in the Actions column.
-
-
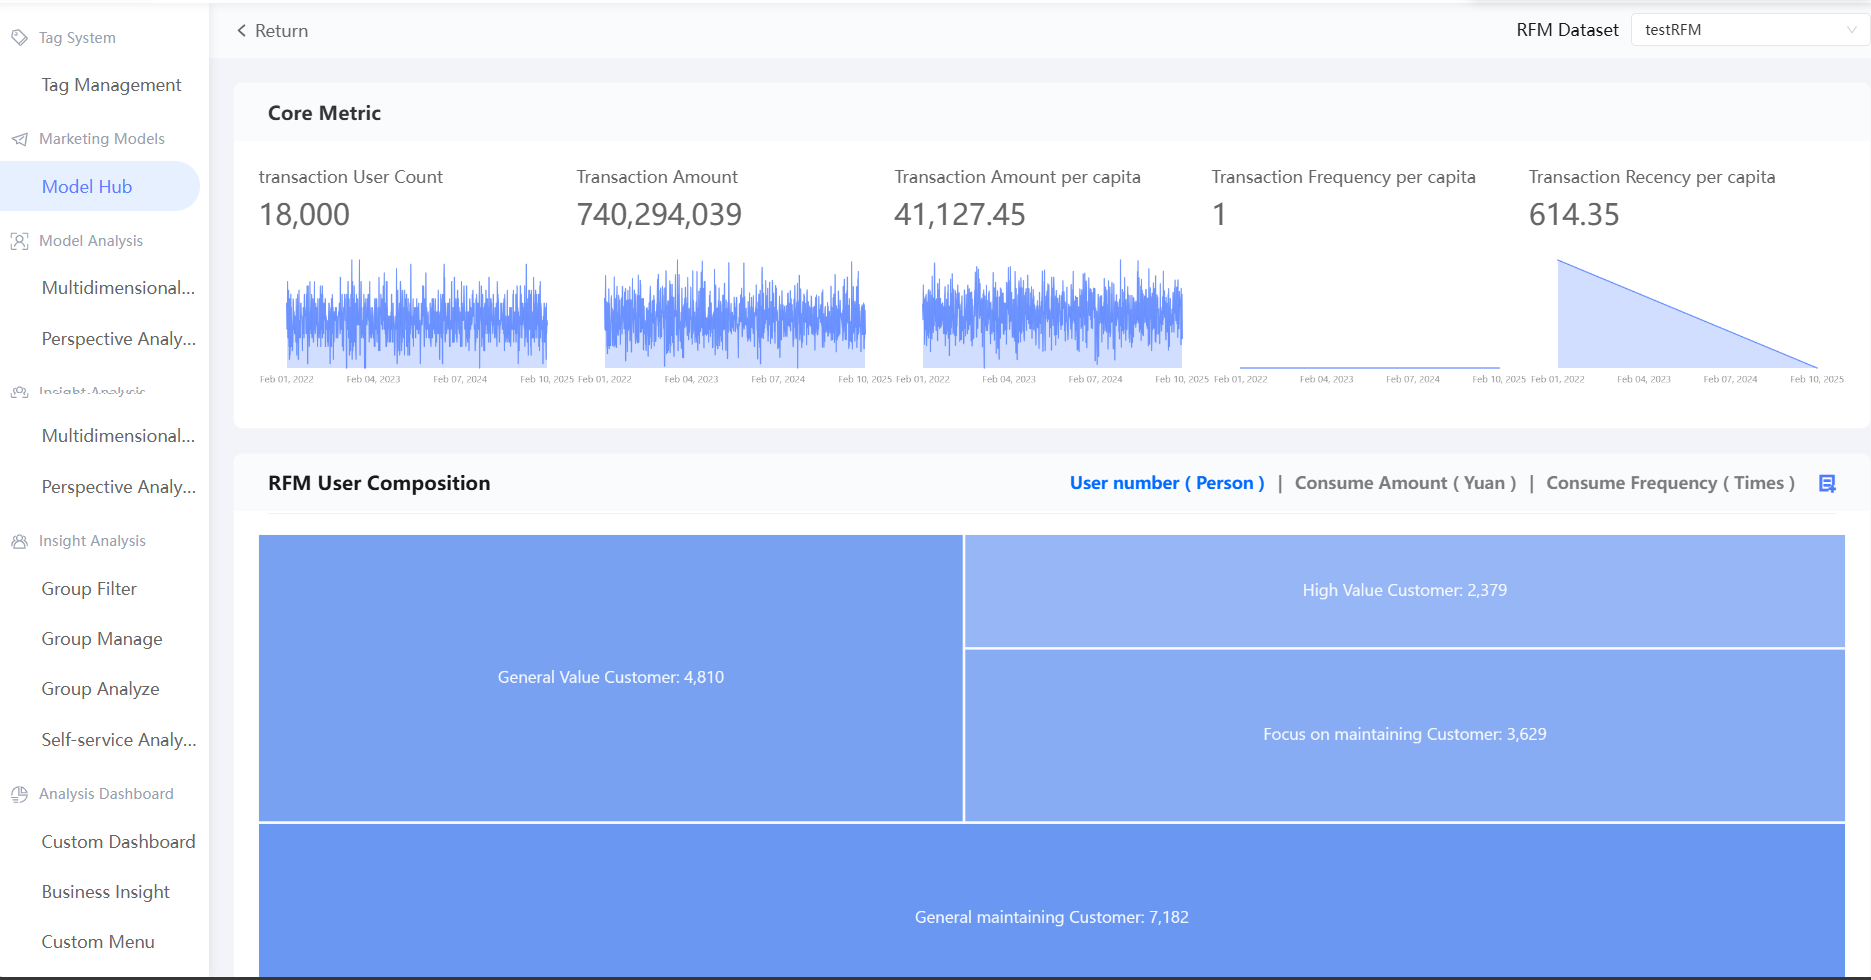
Select an RFM model from the drop-down list in the upper-right corner. The corresponding analysis chart appears below.
NoteIf you go to the RFM Analysis page from the RFM Models page, the corresponding RFM model is selected by default.
The analysis result consists of two parts:
-
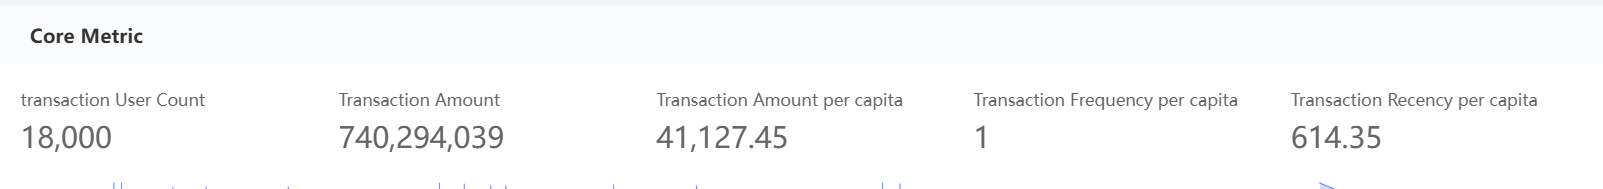
Core indicators
-
If the analysis type is Order Summary Data, the following metrics are displayed: transaction users, transaction amount, per-capita transaction amount, and per-capita transaction frequency.
-
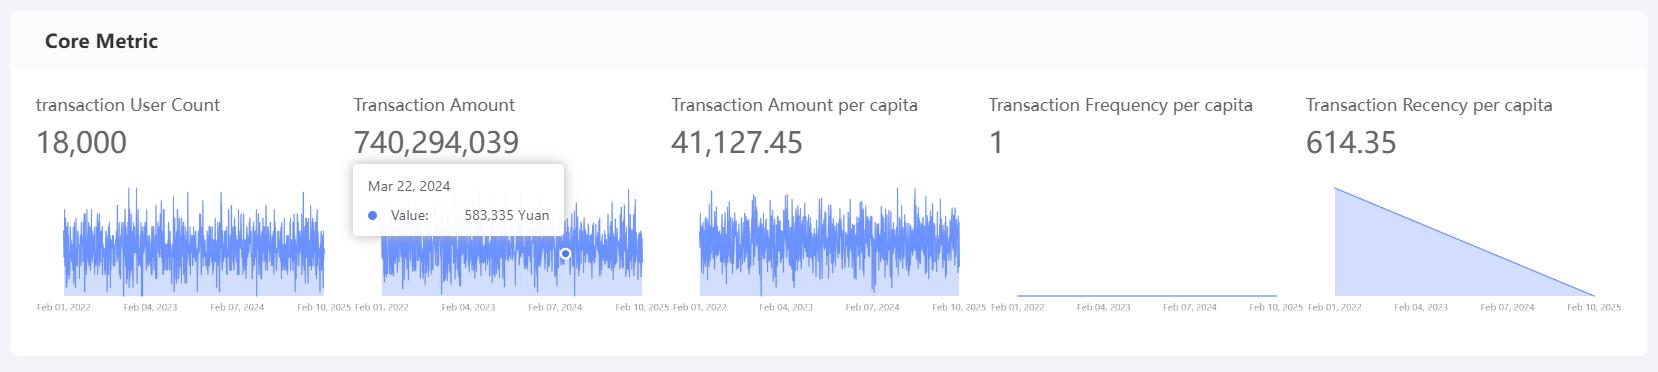
If the analysis type is Order Detail Data, the metrics and trend charts of Transaction Users, Transaction Amount, Transaction Amount per Capita, and Transaction Frequency per Capita are displayed.
-
-
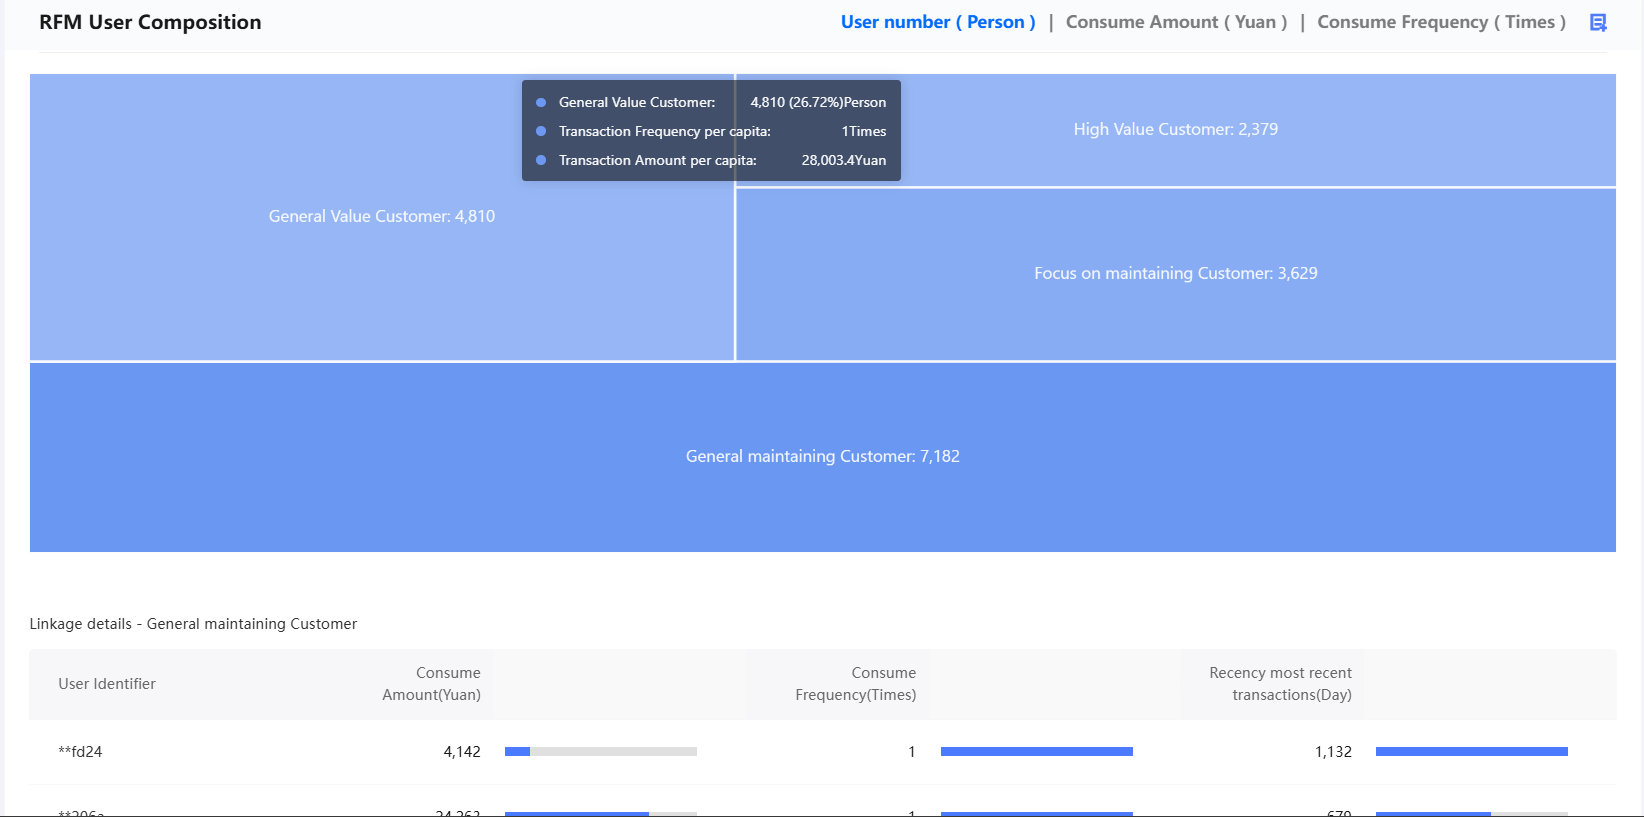
RFM user composition (user type)
Shows the distribution of user types based on the model's classification rules. See RFM User Types and Division Rules.
-
Select User Number, Consumption Amount, or Consumption Frequency in the upper-right corner to view user type distributions.
-
Hover over a user type in the graph to view the user count, proportion, per-capita transaction amount, and per-capita transaction frequency.
-
To create a group from specific user types, click the
 icon in the upper-right corner of the chart. In the dialog box, select one or more user types, enter the group name and description, configure visibility and directory settings, and select the associated sub-campaign. Marketing Campaign Documentation. Then, click OK.
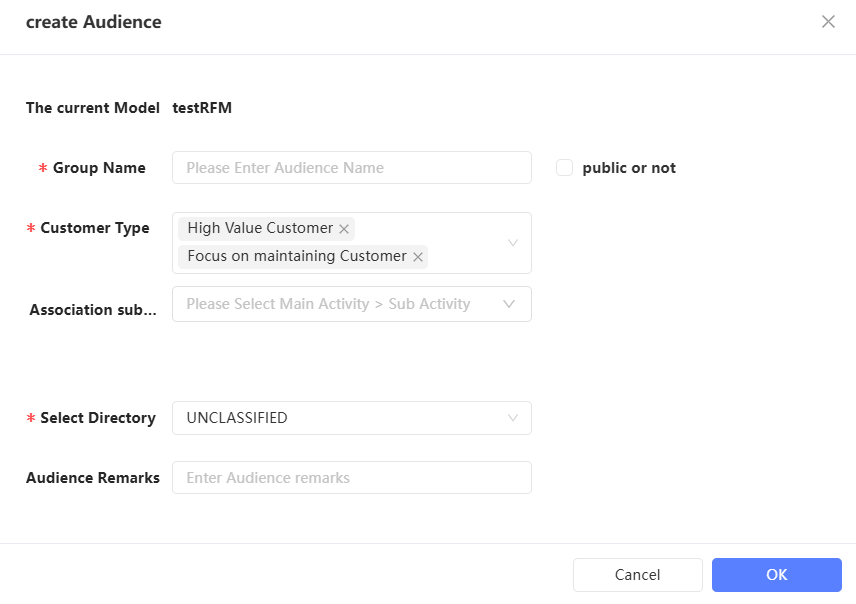
-
-
Linkage Details
Click a user type in the graph to display consumption details of five sample users below.
-
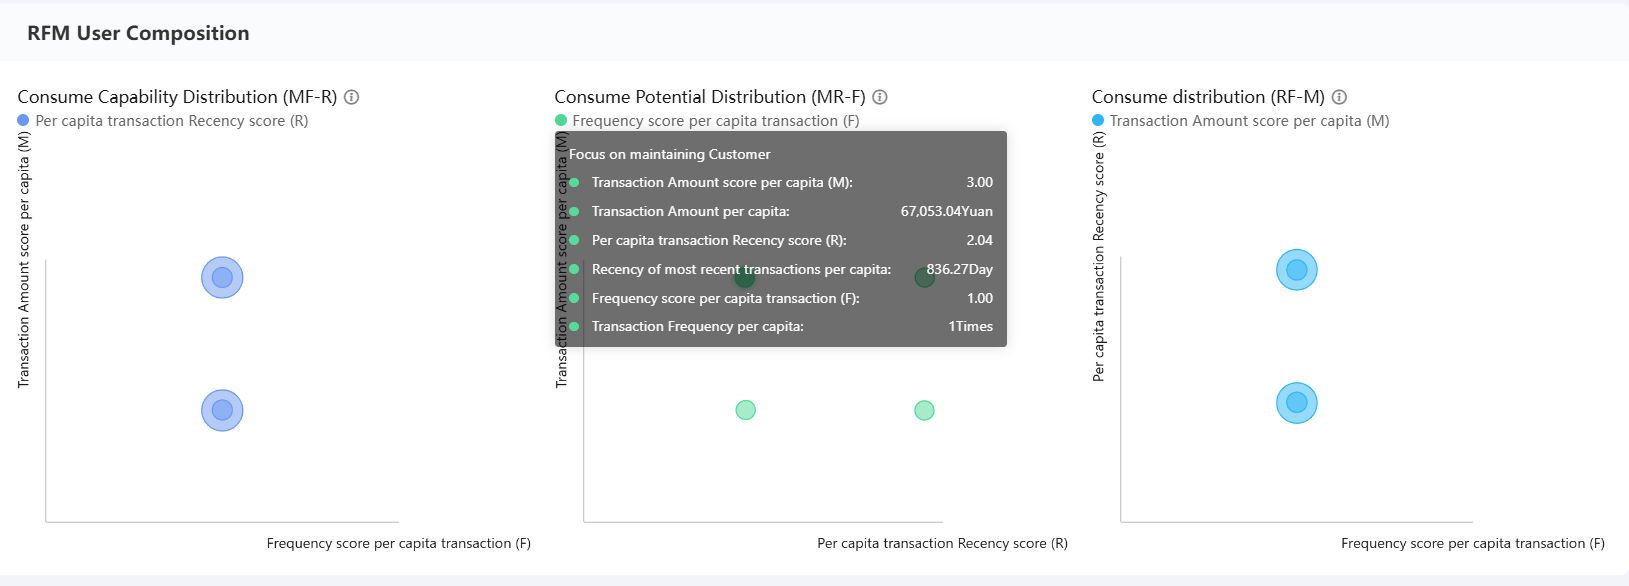
RFM user composition (consumption distribution)
-
Consumption power distribution (MF-R): X-axis represents F (transaction frequency), Y-axis represents M (transaction amount), and point size represents R (last transaction interval). The MF distribution visualizes users' spending power, while R indicates loyalty. Larger points indicate higher loyalty.
-
Consumption potential distribution (MR-F): X-axis represents R (last transaction interval), Y-axis represents M (transaction amount), and point size represents F (transaction frequency). The MR distribution reveals users' consumption potential, while F identifies high-value users. Larger points indicate higher value.
-
Consumption distribution (RF-M): X-axis represents F (transaction frequency), Y-axis represents R (last transaction interval), and point size represents M (transaction amount). The RF distribution shows consumption trends, while M identifies users worth re-engaging. Larger points indicate greater need for re-engagement.
Hover over a user type in the graph to view per-capita transaction data for that type.
-
-
RFM User Types and Classification Rules
Compare a user's RS, FS, and MS scores against the RS, FS, and MS comparison values to determine the user's relative value level in the group:
-
Score greater than the comparison value = high.
-
Score less than the comparison value = low.
-
RS, FS, and MS represent the consumption interval, consumption frequency, and consumption amount scores of a user.
-
The RS, FS, and MS comparison values are the weighted averages of the consumption interval, consumption frequency, and consumption amount scores of all users in the RFM model, or custom values.
To set scoring rules and comparison values in an RFM model, see Create RFM Model.
Each R, F, and M dimension is classified as high or low. Based on their combined performance, users are divided into 8 types as shown below.

|
RFM customer type |
RS |
FS |
MS |
Description |
|
High-value users |
Greater than or equal to RS comparison value |
Greater than or equal to FS comparison value |
Greater than or equal to MS contrast value |
Users with recent transactions, high frequency, and high spending. |
|
Focus on keeping users |
Low |
Greater than or equal to FS comparison value |
Greater than or equal to MS contrast value |
Users with infrequent recent transactions but high frequency and high spending. |
|
Focus on user development |
Greater than or equal to RS comparison value |
Low |
Greater than or equal to MS contrast value |
Users with recent transactions and high spending but low frequency. |
|
Focus on retaining users |
Low |
Low |
Greater than or equal to MS contrast value |
Users with infrequent recent transactions, low frequency, but high spending. |
|
General Value User |
Greater than or equal to RS comparison value |
Greater than or equal to FS comparison value |
Low |
Users with recent transactions and high frequency but low spending. |
|
generally keep users |
Low |
Greater than or equal to FS comparison value |
Low |
Users with infrequent recent transactions and low spending but high frequency. |
|
General development users |
Greater than or equal to RS comparison value |
Low |
Low |
Users with recent transactions but low frequency and low spending. |
|
Potential users |
Low |
Low |
Low |
Users with infrequent recent transactions, low frequency, and low spending. |