Managed Service for Prometheus allows you to monitor a SQL Server database, and use the out-of-the-box dashboards to visualize the monitoring data. This topic describes how to monitor a SQL Server database.
Prerequisites
Container cluster
Managed Service for Prometheus is activated. For more information, see Instance billing.
A Container Service for Kubernetes (ACK) cluster is created. For more information, see Create an ACK managed cluster.
Alibaba Cloud Resource Center is activated. For more information, see Activate Resource Center.
ECS instance
Managed Service for Prometheus is activated. For more information, see Instance billing.
An Elastic Compute Service (ECS) instance is created. For more information, see Create and manage an ECS instance by using the ECS console (express version).
Alibaba Cloud Resource Center is activated. For more information, see Activate Resource Center.
Procedure
Log on to the Managed Service for Prometheus console. In the left-side navigation pane, click Integration Center.
Click SQLServer and set the parameters as prompted. The following table describes the key parameters.
Parameter
Description
SQLServer Host
The endpoint of the database.
SQLServer Port
The port number of the database. The value ranges from 1 to 65535.
SQLServer username
The username of the database.
SQLServer password
The password of the database.
View and manage the monitoring data of the SQL Server database
The installed component is displayed on the Integration Management page in the Managed Service for Prometheus console. The Integration Management page consists of the Integrated Environments, Integrated Addons, and Query Dashboards tabs, where you can view information such as targets, metrics, dashboards, and alerts.
Targets
In the Targets section of the Self-Monitoring tab, you can view the list of targets discovered by the default jobs.
Metric Scraping
On the Metric Scraping tab, you can view or discard metrics. For more information, see Configure discarded metrics.
Dashboards
In the Dashboards section of the Component Management tab, you can click a dashboard name to go to Grafana and view more dashboard data.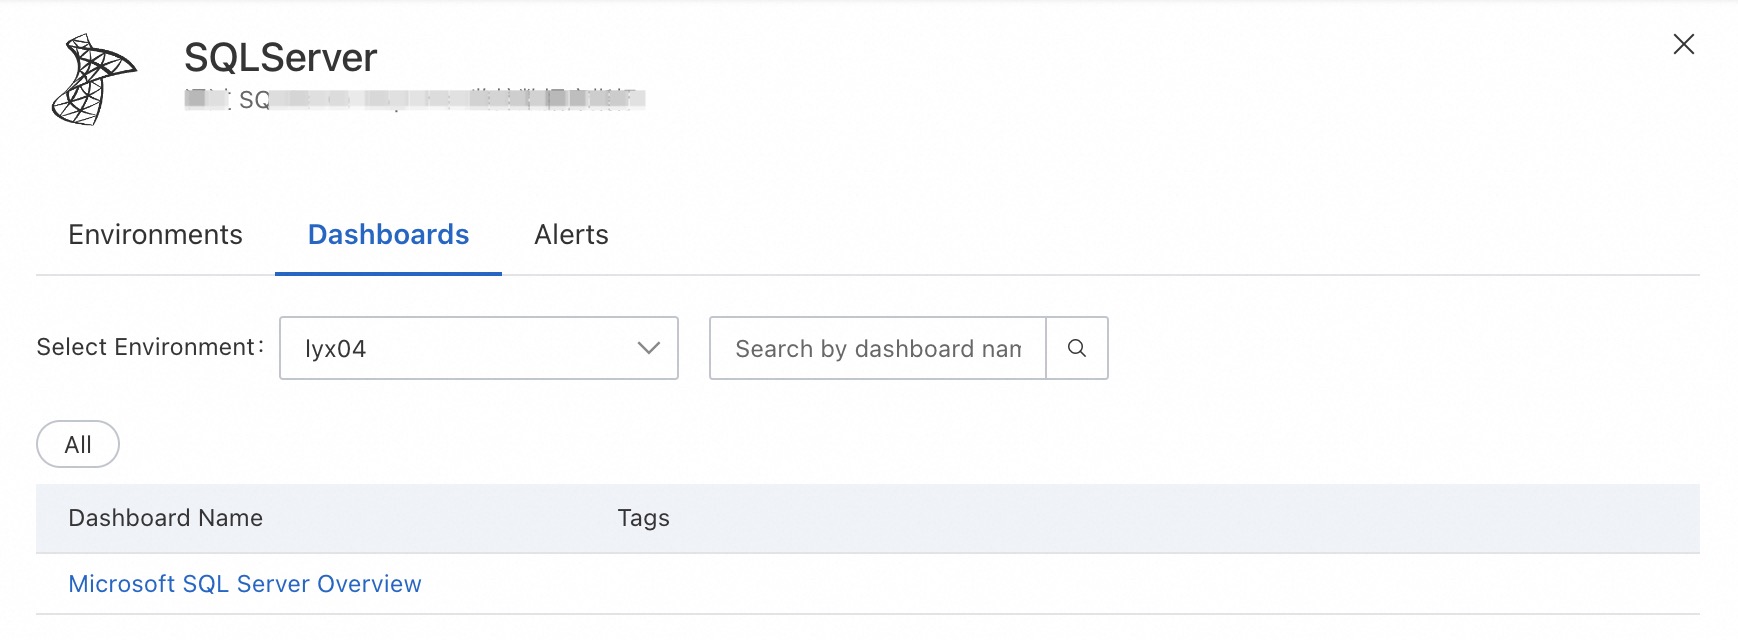
Alerts
In the Alerts section of the Component Management tab, you can view the alert rules of the SQL Server database. For information about how to create alert rules, see Create an alert rule for a Prometheus instance.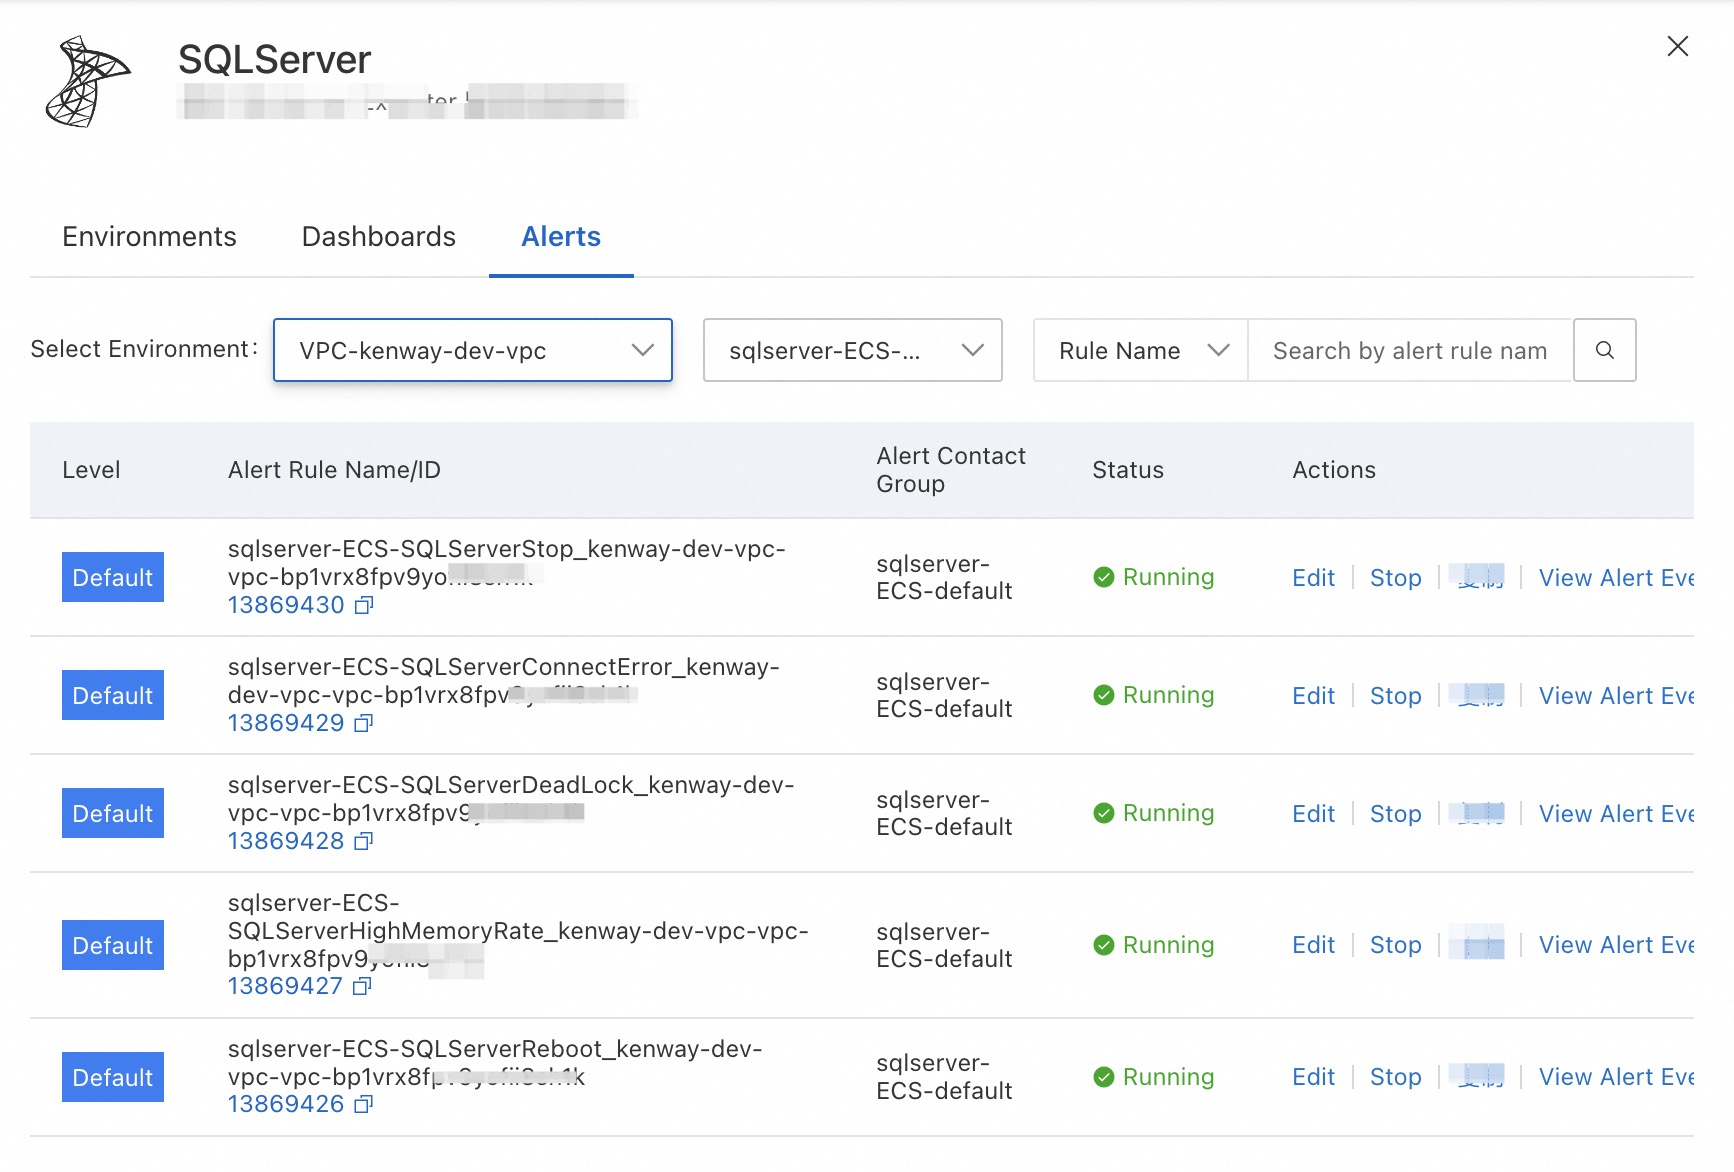
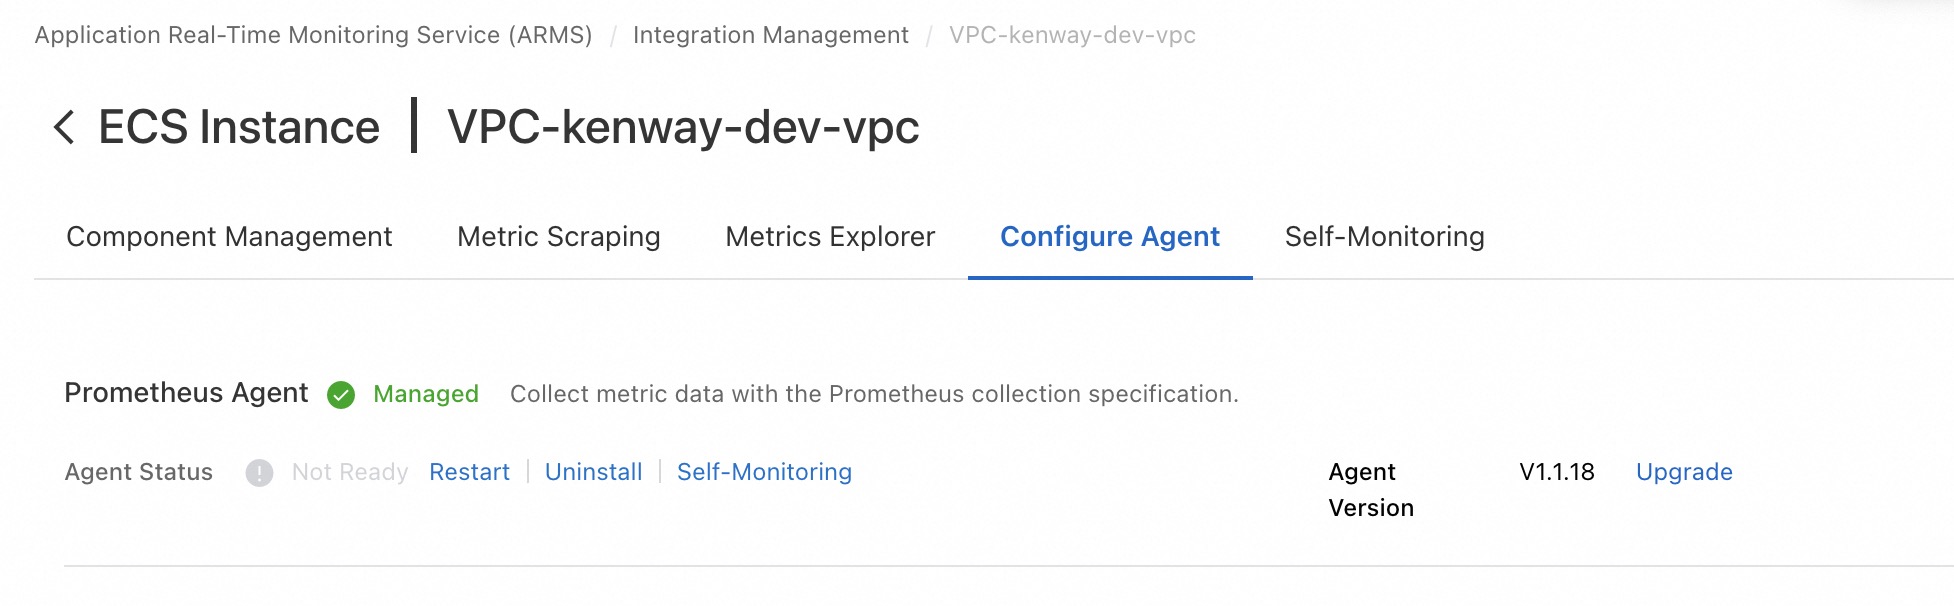
Configure Agent
On the Configure Agent tab, you can view the version number of your Prometheus agent.