Managed Service for Prometheus allows you to monitor the health status of a service deployed in a Container Service for Kubernetes (ACK) cluster. It regularly inspects the service connectivity and provides insight into the health status. This way, you can discover and handle exceptions in a timely manner.
Prerequisites
Managed Service for Prometheus is activated. For more information, see Billing overview.
An ACK cluster is created. For more information, see Create an ACK managed cluster.
Alibaba Cloud Resource Center is activated. For more information, see Activate Resource Center.
Procedure
Log on to the Managed Service for Prometheus console. In the left-side navigation pane, click Integration Center.
Click Service Check Monitor and set the parameters as prompted. The following table describes the key parameters.
Parameter
Description
Task Name
The unique name of the inspection task.
Target Address
The endpoint of the service.
Probe Method
The inspection method. Valid values:
HTTP_2XX
PING
TCP
Detection Interval (seconds)
The time interval between two inspections. Unit: seconds.
View and manage the monitoring data of the service
View dashboards
On the Integrated Addons tab of the Integration Management page, click Service Check Monitor. On the Dashboards tab of the panel that appears, click a dashboard name to view details.
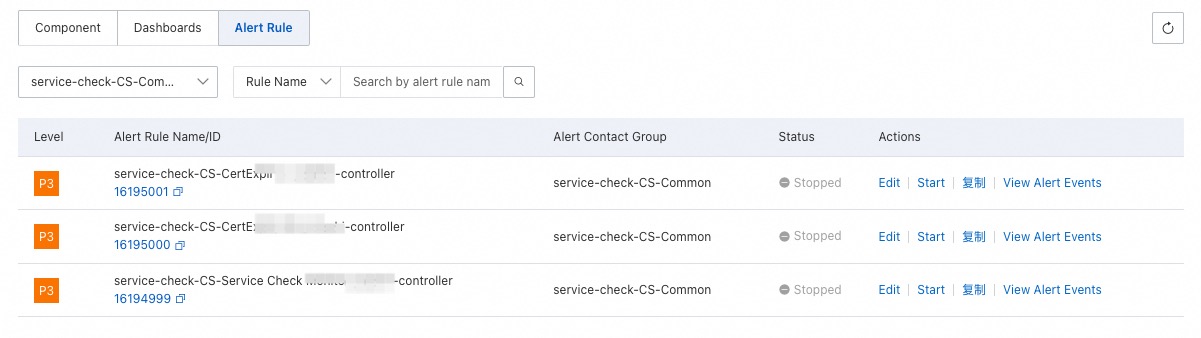
Modify an alert rule
On the Integrated Addons tab of the Integration Management page, click Service Check Monitor. On the Alerts tab of the panel that appears, find an alert rule and click Edit in the Actions column to modify it.