Managed Service for Prometheus actively pulls performance data from your PostgreSQL database based on the specified parameters. This way, you can monitor the database in real time and flexibly analyze the monitoring data. This topic describes how to monitor a PostgreSQL database.
Prerequisites
Container cluster
Managed Service for Prometheus is activated. For more information, see Billing overview.
An Elastic Compute Service (ECS) instance is created. For more information, see Create and manage an ECS instance in the console (express version).
Alibaba Cloud Resource Center is activated. For more information, see Activate Resource Center.
ECS instance
Managed Service for Prometheus is activated. For more information, see Billing overview.
An ECS instance is created. For more information, see Create and manage an ECS instance in the console (express version).
Alibaba Cloud Resource Center is activated. For more information, see Activate Resource Center.
Procedure
Log on to the Managed Service for Prometheus console. In the left-side navigation pane, click Integration Center.
Click PostgreSQL and set the parameters as prompted. The following tables describe the key parameters.
Container cluster
Parameter
Description
PostgreSQL address
The endpoint of the database.
PostgreSQL port
The port number of the database. Example: 5432.
UserName
The username of the database.
Password
The password of the database.
ECS instance
Parameter
Description
PostgreSQL address
The endpoint of the database.
PostgreSQL port
The port number of the database.
UserName
The username of the database.
Password
The password of the database.
Custom Labels
Add tags to the metrics of the ECS instance. Then, you can monitor, manage, query, or analyze the metric data in a fine-grained manner when you use tools such as Grafana. For more information, see Add tags to the metrics of an ECS instance using a VPC.
NoteA tag key cannot contain special characters used in the Prometheus functionality, such as hyphens (-), periods (.), or percent signs (%).
Tags must be specified in the key-value format required by Prometheus.
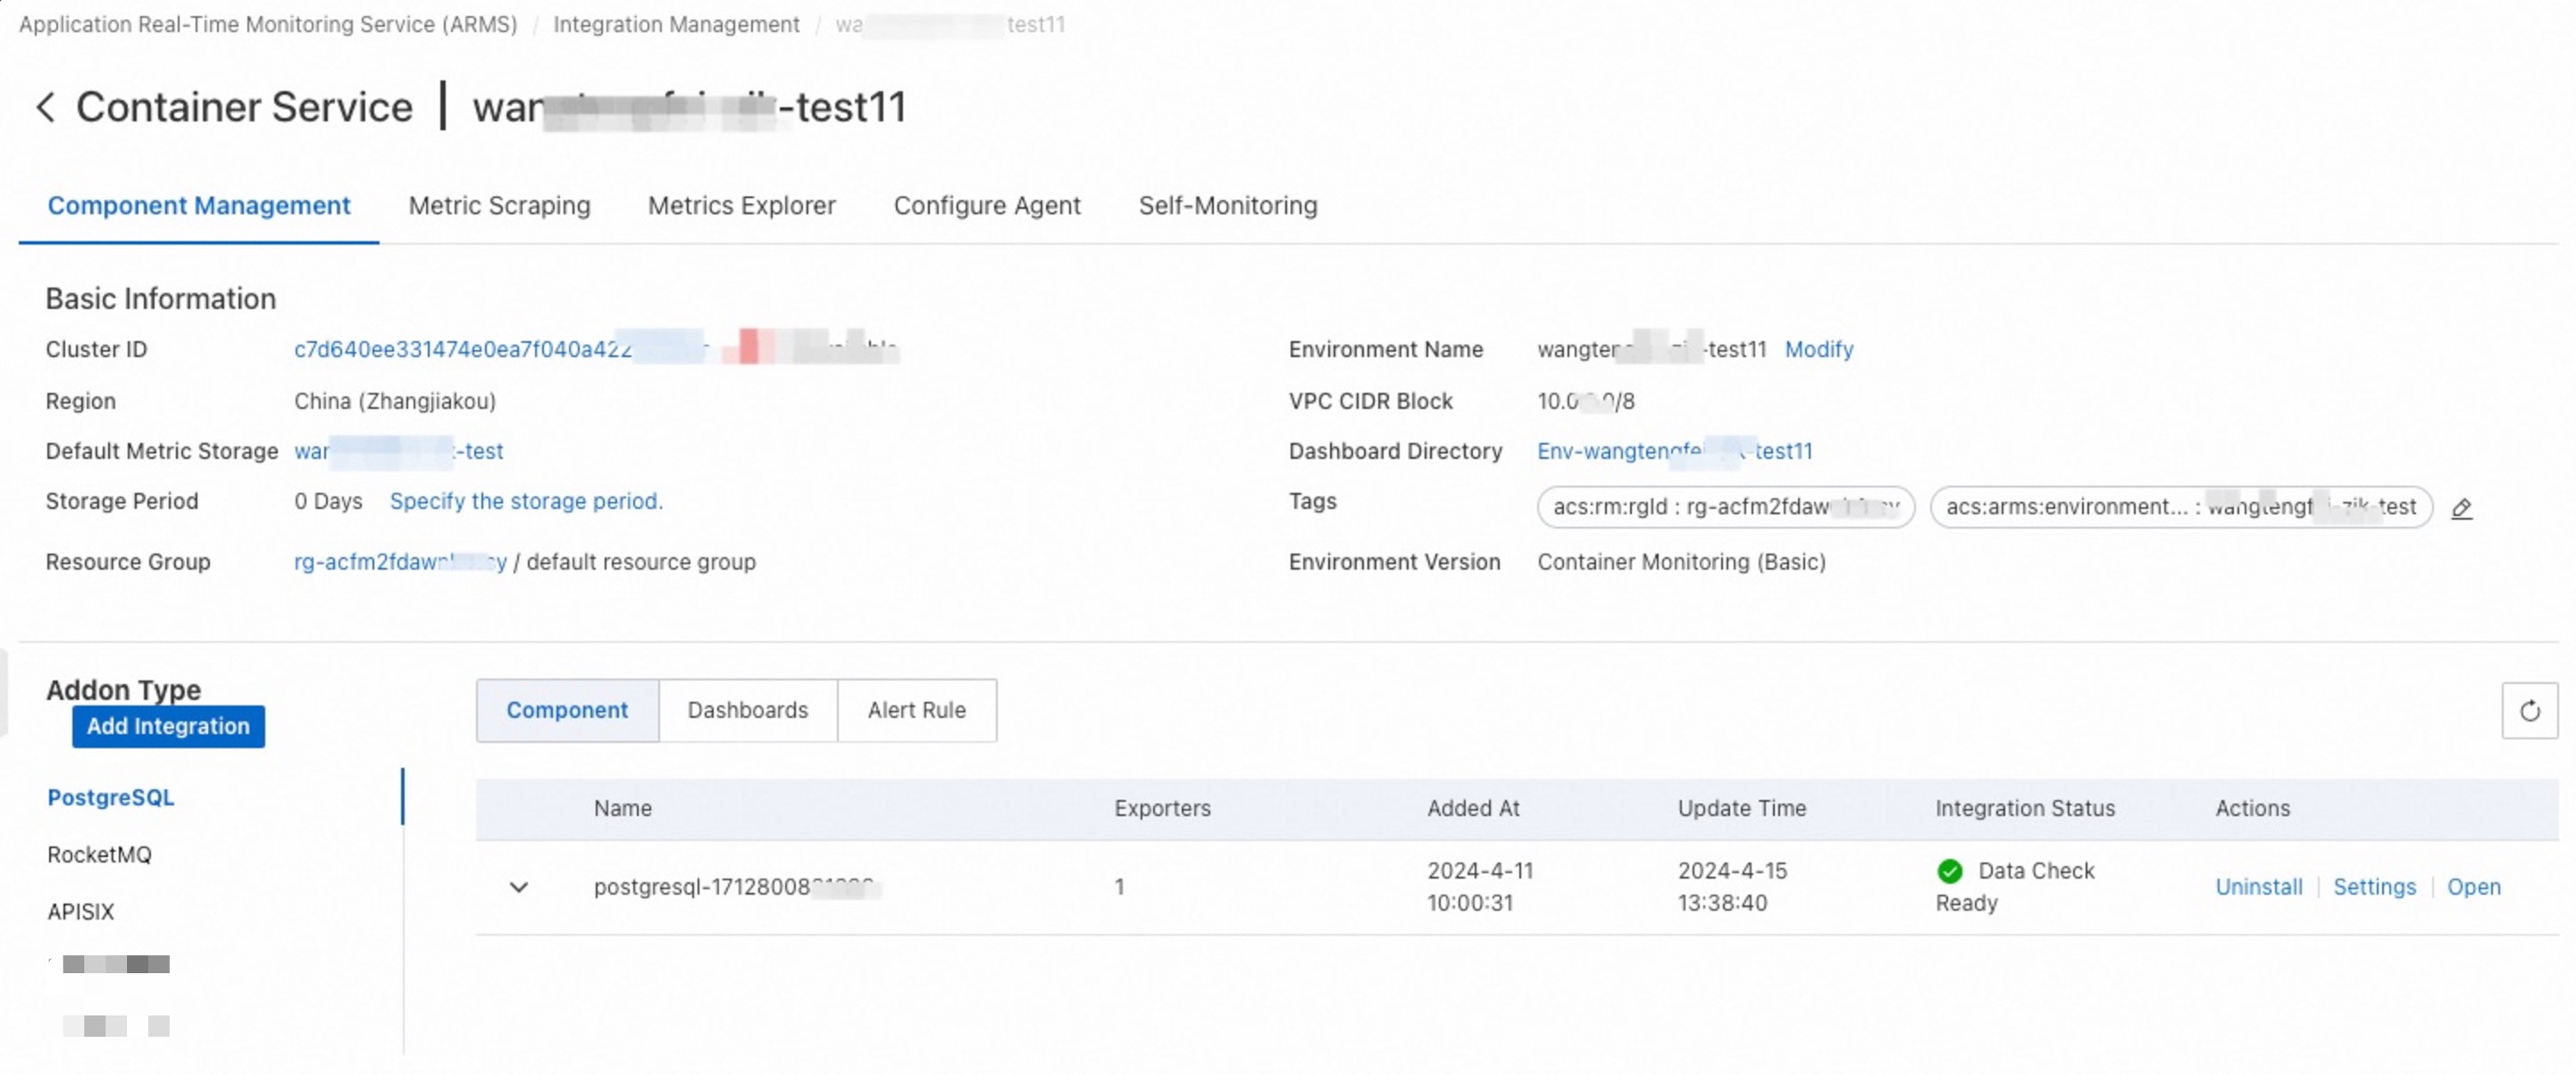
View and manage the monitoring data of the PostgreSQL database
The installed component is displayed on the Integration Management page in the Managed Service for Prometheus console. The Integration Management page consists of the Integrated Environments, Integrated Addons, and Query Dashboards tabs, where you can view information such as targets, metrics, dashboards, and alerts.
Related steps
You can configure alert rules for the database to monitor the health status of key metrics in real time. This way, you can discover and handle exceptions in a timely manner. For more information, see Create an alert rule for a Prometheus instance.