This topic describes how to monitor a Docker container to help enterprises better manage and maintain containerized applications.
Prerequisites
Managed Service for Prometheus is activated. For more information, see Billing overview.
An ECS instance is created. For more information, see Create and manage an ECS instance by using the ECS console (express version).
Alibaba Cloud Resource Center is activated. For more information, see Activate Resource Center.
Step 1: Integrate a Docker container
Log on to the Managed Service for Prometheus console. In the left-side navigation pane, click Integration Center.
Click Docker Container. In the panel that appears, set the parameters as prompted. The following describes the key parameters.
Parameter
Description
cAdvisor Installation Mode
Container Advisor (cAdvisor) is an open source container monitoring tool developed by Google. It collects resource usage metrics such as CPU, memory, network, and disk utilization for containers.
Automatic installation: Automatic service discovery is performed based on the filter conditions you provide, identifying ECS instances and installing the cAdvisor service on the discovered instances.
Manual installation: Before integrating the container, you need to manually install the cAdvisor service on your ECS instance and open the corresponding ports to allow access within the virtual private cloud (VPC).
NoteThe ECS instance whitelist must open specified ports for the VPC.
Host Service Discovery Mode
Specify the following options to select the ECS instances.
Stain Label Selection
ECS Stain Label: excludes the ECS instances using the taints.
Unconditional (Select all Windows instances in the current VPC)
-
Tag Label Selection
ECS Instance Label: matches the ECS instances using the tags.
IP CIDR
ECS IP CIDR: matches the ECS instances that share the specified IP prefix or certain bits. If you specify the CIDR block of the VPC, all ECS instances in the VPC are selected.
Instance ID
ECS Instance ID: the IDs of the ECS instances. Separate multiple instance IDs with commas (,).
cAdvisor Service Port
Default value: 8080.
Metric Scrape interval (unit/second)
Default value: 15.
Security Groups Are Automatically Configured
Specify whether to automatically add security group rules if the security group check fails.
Custom ECS Tag Injection
Specify tag keys of the ECS instances. Then, the whole key value pairs are added to the metrics.
Step 2: View the dashboards
Managed Service for Prometheus provides multiple built-in dashboards, to show monitoring details, such as container overview, core components, nodes, and pods. You can view these dashboards in the Container Service for Kubernetes, Application Real-Time Monitoring Service, or Managed Service for Prometheus console. Perform the following steps to view the dashboards:
Log on to the Managed Service for Prometheus console. In the left-side navigation pane, click Integration Management.
On the Integration Management page, click the Query Dashboards tab. Select the VPC to view the dashboards of the container.


Step 3: Configure alerting
Log on to the Managed Service for Prometheus console. In the left-side navigation pane, click Integration Management.
On the Integration Management page, click the Integrated Environments tab. On the ECS Instance tab, click the name of the VPC.
On the Component Management tab, view the built-in alert rules in the Alert Rule section.
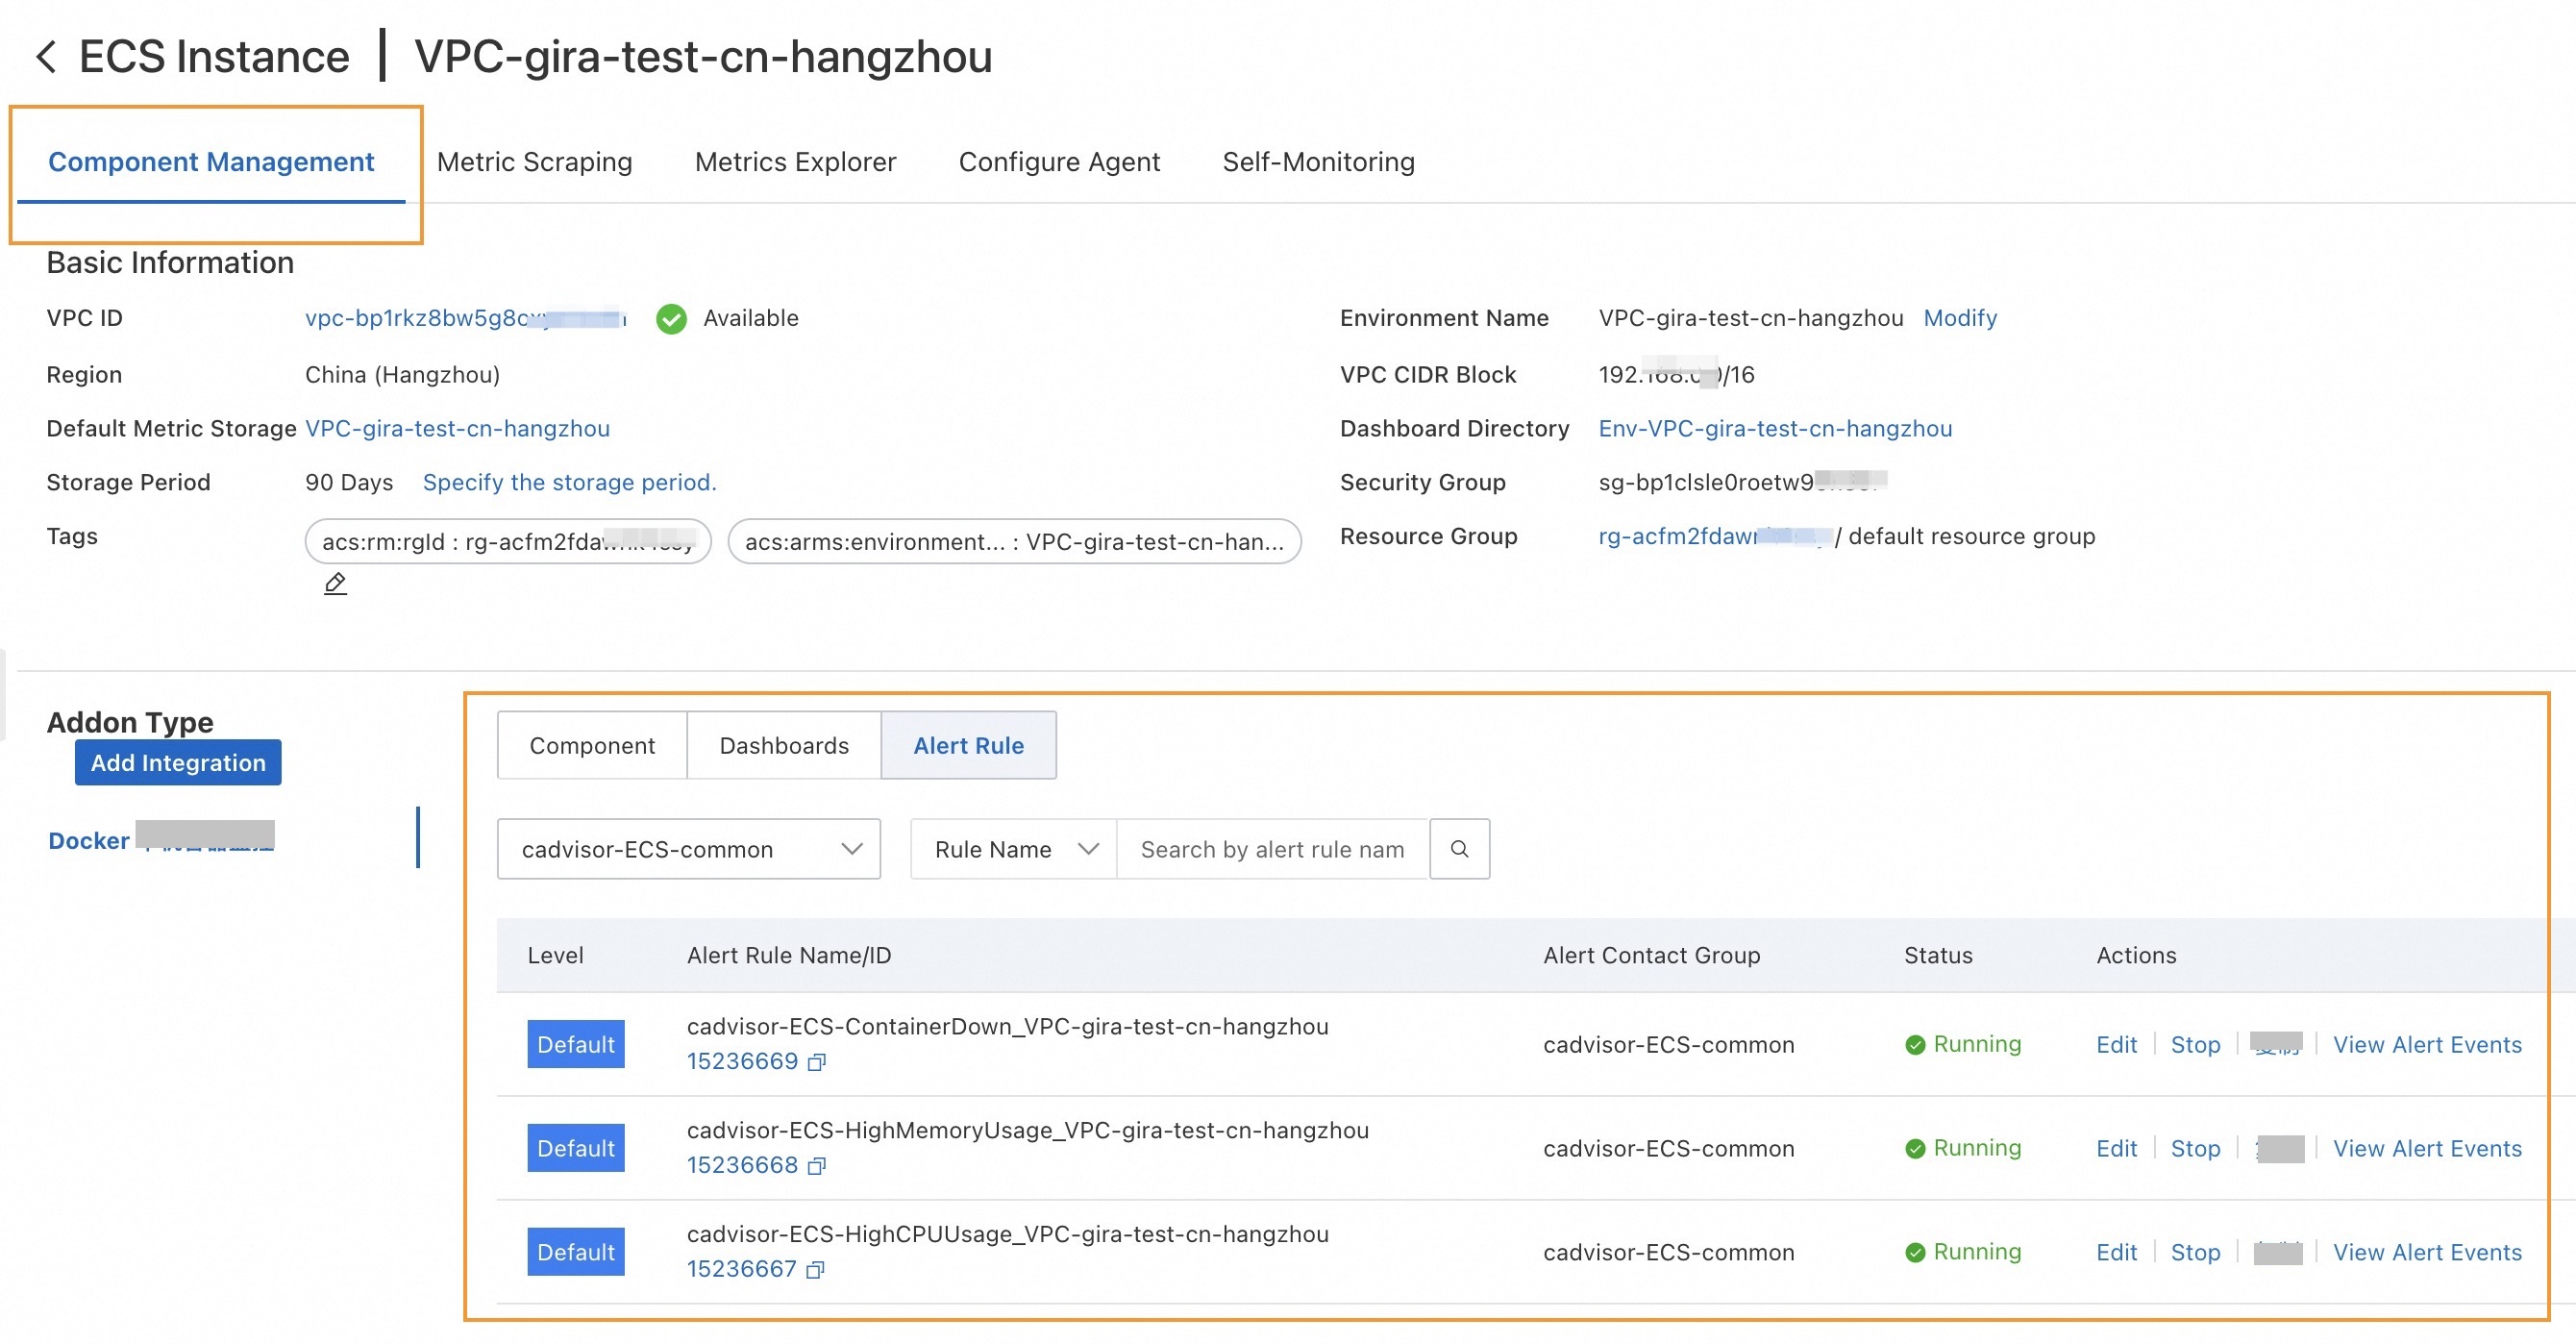
The built-in alert rules generate alert events without sending alert notifications. If you want to configure notification methods for an alert rule, click Edit in the Actions column.
On the Edit Prometheus Alert Rule page, you can configure custom alert thresholds, duration, and alert content. For more information, see Create an alert rule for a Prometheus instance.

Metrics
Metric | Measurement | Description |
container_blkio_device_usage_total | COUNTER | The block I/O device bytes usage. |
container_cpu_cfs_periods_total | COUNTER | The number of elapsed enforcement period intervals. |
container_cpu_cfs_throttled_periods_total | COUNTER | The number of throttled period intervals. |
container_cpu_cfs_throttled_seconds_total | COUNTER | The total time duration for which the container has been throttled. |
container_cpu_load_average_10s | GAUGE | The value of container CPU load average over the last 10 seconds. |
container_cpu_schedstat_run_periods_total | COUNTER | The number of times the control group (cgroup) processes have run on the CPU. |
container_cpu_schedstat_runqueue_seconds_total | COUNTER | The time duration for which the container processes have been waiting on a run queue. |
container_cpu_schedstat_run_seconds_total | COUNTER | The time duration for which the container processes have run on the CPU. |
container_cpu_system_seconds_total | COUNTER | The cumulative time consumed by the system CPU. |
container_cpu_usage_seconds_total | COUNTER | The cumulative CPU time consumed. |
container_cpu_user_seconds_total | COUNTER | The cumulative time consumed by the user CPU. |
container_file_descriptors | GAUGE | The number of open file descriptors for the container. |
container_fs_inodes_free | GAUGE | The number of available Inodes. |
container_fs_inodes_total | GAUGE | The total number of Inodes. |
container_fs_io_current | GAUGE | The number of I/Os in progress. |
container_fs_io_time_seconds_total | COUNTER | The cumulative count of seconds spent by I/Os. |
container_fs_io_time_weighted_seconds_total | COUNTER | The cumulative weighted I/O time. |
container_fs_limit_bytes | GAUGE | The number of bytes that can be consumed by the container on the file system. |
container_fs_read_seconds_total | COUNTER | The cumulative count of seconds spent reading. |
container_fs_reads_bytes_total | COUNTER | The cumulative count of read bytes. |
container_fs_reads_merged_total | COUNTER | The cumulative count of merged reads. |
container_fs_reads_total | COUNTER | The cumulative count of reads completed. |
container_fs_sector_reads_total | COUNTER | The cumulative count of completed sector reads. |
container_fs_sector_writes_total | COUNTER | The cumulative count of completed sector writes. |
container_fs_usage_bytes | GAUGE | The number of bytes consumed by the container on the file system. |
container_fs_write_seconds_total | COUNTER | The cumulative count of seconds spent writing. |
container_fs_writes_bytes_total | COUNTER | The cumulative count of written bytes. |
container_fs_writes_merged_total | COUNTER | The cumulative count of merged writes. |
container_fs_writes_total | COUNTER | The cumulative count of writes completed. |
container_hugetlb_failcnt | COUNTER | The number of times the hugepage usage reaches the limit. |
container_hugetlb_max_usage_bytes | GAUGE | The maximum hugepage usage recorded. |
container_hugetlb_usage_bytes | GAUGE | The current hugepage usage. |
container_last_seen | GAUGE | The time when the container was last seen. |
container_llc_occupancy_bytes | GAUGE | The last level cache usage for the container counted with Resource Director Technology (RDT) Memory Bandwidth Monitoring (MBM). |
container_memory_bandwidth_bytes | GAUGE | The total memory bandwidth usage for the container counted with RDT MBM. |
container_memory_bandwidth_local_bytes | GAUGE | The local memory bandwidth usage for the container counted with RDT MBM. |
container_memory_cache | GAUGE | The total page cache memory. |
container_memory_failcnt | COUNTER | The number of times the memory usage exceeds the limit. |
container_memory_failures_total | COUNTER | The cumulative count of memory allocation failures. |
container_memory_mapped_file | GAUGE | The size of memory mapped files. |
container_memory_max_usage_bytes | GAUGE | The maximum memory usage. |
container_memory_migrate | GAUGE | The memory migration status. |
container_memory_numa_pages | GAUGE | The number of used pages per Non-Uniform Memory Access (NUMA) node. |
container_memory_rss | GAUGE | The Resident Set Size (RSS) size. |
container_memory_swap | GAUGE | The container swap usage. |
container_memory_usage_bytes | GAUGE | The current memory usage. |
container_memory_working_set_bytes | GAUGE | The current working set. |
container_network_advance_tcp_stats_total | GAUGE | The total count of advanced TCP connections for the container. |
container_network_receive_bytes_total | COUNTER | The cumulative number of bytes received. |
container_network_receive_errors_total | COUNTER | The cumulative count of errors encountered while receiving. |
container_network_receive_packets_dropped_total | COUNTER | The cumulative count of packets dropped while receiving. |
container_network_receive_packets_total | COUNTER | The cumulative count of packets received. |
container_network_tcp6_usage_total | GAUGE | The count of TCP6 connections for the container. |
container_network_tcp_usage_total | GAUGE | The count of TCP connections for the container. |
container_network_transmit_bytes_total | COUNTER | The cumulative count of bytes transmitted. |
container_network_transmit_errors_total | COUNTER | The cumulative count of errors encountered while transmitting. |
container_network_transmit_packets_dropped_total | COUNTER | The cumulative count of packets dropped while transmitting. |
container_network_transmit_packets_total | COUNTER | The cumulative count of packets transmitted. |
container_network_udp6_usage_total | GAUGE | The count of UDP6 connections for the container. |
container_network_udp_usage_total | GAUGE | The count of UDP connections for the container. |
container_oom_events_total | COUNTER | The count of out of memory events observed for the container. |
container_perf_events_scaling_ratio | GAUGE | The scaling ratio for perf event counter. |
container_perf_events_total | COUNTER | The scaled counter of perf core events. |
container_perf_uncore_events_scaling_ratio | GAUGE | The scaling ratio for perf uncore event counter. Events can be identified by event label. The "PMU" and "socket" labels indicate the Performance Monitoring Unit (PMU) and the CPU socket for which an event was measured. |
container_perf_uncore_events_total | COUNTER | The scaled counter of perf uncore events. Events can be identified by event label. The "PMU" and "socket" labels indicate the PMU and the CPU socket for which an event was measured. |
container_processes | GAUGE | The number of processes running in the container. |
container_referenced_bytes | GAUGE | The container referenced bytes during last measurements cycle based on the Referenced field of the /proc/smaps file. |
container_sockets | GAUGE | The number of open sockets for the container. |
container_spec_cpu_period | GAUGE | The CPU period of the container. |
container_spec_cpu_quota | GAUGE | The CPU quota of the container. |
container_spec_cpu_shares | GAUGE | The CPU share of the container. |
container_spec_memory_limit_bytes | GAUGE | The memory limit of the container. |
container_spec_memory_reservation_limit_bytes | GAUGE | The memory reservation limit for the container. |
container_spec_memory_swap_limit_bytes | GAUGE | The memory swap limit for the container. |
container_start_time_seconds | GAUGE | The start time of the container. Format: Unix timestamp. |
container_tasks_state | GAUGE | The number of tasks in given states (sleeping, running, stopped, uninterruptible, and ioawaiting) |
container_threads | GAUGE | The number of threads running in the container. |
container_threads_max | GAUGE | The maximum number of threads allowed in the container. |
container_ulimits_soft | GAUGE | The soft ulimit value of the root process of the container. |
machine_cpu_cache_capacity_bytes | GAUGE | The cache size in bytes assigned to the NUMA node and CPU cores. |
machine_cpu_cores | GAUGE | The number of logical CPU cores. |
machine_cpu_physical_cores | GAUGE | The number of physical CPU cores. |
machine_cpu_sockets | GAUGE | The number of CPU sockets. |
machine_dimm_capacity_bytes | GAUGE | The total Random Access Memory (RAM) Dual Inline Memory Module (DIMM) capacity of all memory modules. |
machine_dimm_count | GAUGE | The number of RAM DIMM. |
machine_memory_bytes | GAUGE | The amount of memory installed on the machine. |
machine_swap_bytes | GAUGE | The amount of swap memory available on the machine. |
machine_node_distance | GAUGE | The distance between the NUMA node and target NUMA node. |
machine_node_hugepages_count | GAUGE | The number of hugepages assigned to the NUMA node. |
machine_node_memory_capacity_bytes | GAUGE | The amount of memory assigned to the NUMA node. |
machine_nvm_avg_power_budget_watts | GAUGE | The Non-Volatile Memory (NVM) power budget. |
machine_nvm_capacity | GAUGE | The NVM capacity value. |
machine_thread_siblings_count | GAUGE | The number of CPU thread siblings. |
References
How to build an efficient and stable Docker container monitoring system?