Managed Service for Prometheus actively pulls performance data from your ClickHouse database based on the specified parameters. This way, you can monitor the database in real time and flexibly analyze the monitoring data. This topic describes how to monitor a ClickHouse database.
Prerequisites
Container cluster
Managed Service for Prometheus is activated. For more information, see Billing overview.
An ACK cluster is created. For more information, see Create an ACK managed cluster.
Alibaba Cloud Resource Center is activated. For more information, see Activate Resource Center.
ECS instance
Managed Service for Prometheus is activated. For more information, see Billing overview.
An ECS instance is created. For more information, see Create and manage an ECS instance by using the ECS console (express version).
Alibaba Cloud Resource Center is activated. For more information, see Activate Resource Center.
Procedure
Log on to the Managed Service for Prometheus console. In the left-side navigation pane, click Integration Center.
Click Clickhouse and set the parameters as prompted. The following tables describe the key parameters.
Container cluster
Parameter
Description
Clickhouse address
The endpoint of the database. Example:
http://clickhouse-simple-01.default:8123.Clickhouse username
The username of the database.
Clickhouse password
The password of the database.
Metrics collection interval (seconds)
The interval for collecting monitoring data. The default value is 15.
ECS(VPC)
Configuration Item
Description
Clickhouse address
Specify the Clickhouse Scrape address, for example:
http://clickhouse-simple-01.default:8123.Clickhouse username
The username of the database.
Clickhouse password
The password of the database.
Metrics collection interval (seconds)
The interval for collecting monitoring data. The default value is 15.
Custom Labels
Add tags to the metrics of the ECS instance. Then, you can monitor, manage, query, or analyze the metric data in a fine-grained manner when you use tools such as Grafana. For more information, see Add tags to the metrics of an ECS instance using a VPC.
NoteA tag key cannot contain special characters used in the Prometheus functionality, such as hyphens (-), periods (.), or percent signs (%).
Tags must be specified in the key-value format required by Prometheus.
View and manage the monitoring data of the database
The installed component is displayed on the Integration Management page in the Managed Service for Prometheus console. The Integration Management page consists of the Integrated Environments, Integrated Addons, and Query Dashboards tabs, where you can view information such as targets, metrics, dashboards, and alerts.
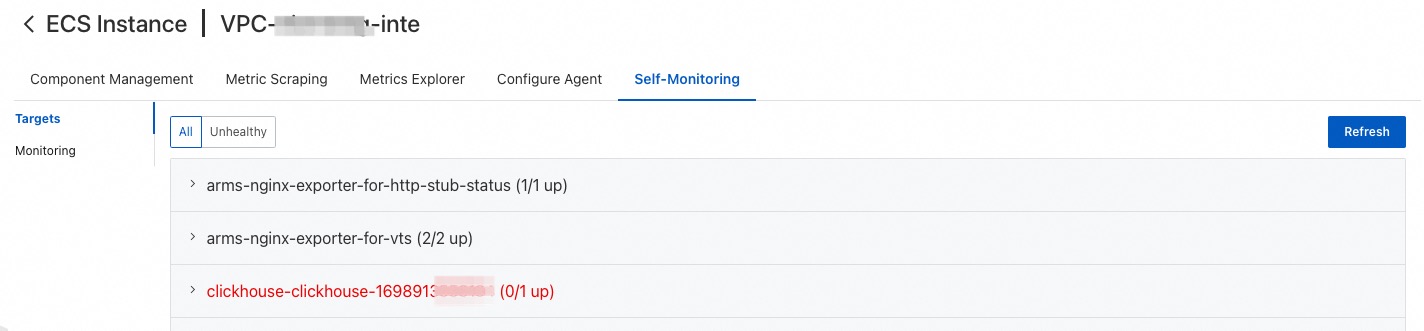
Targets
In the Targets section of the Self-Monitoring tab, you can view the list of targets discovered by the default jobs.
Metrics Scraping
On the Metric Scraping tab, you can view or discard metrics. For more information, see Discard metrics.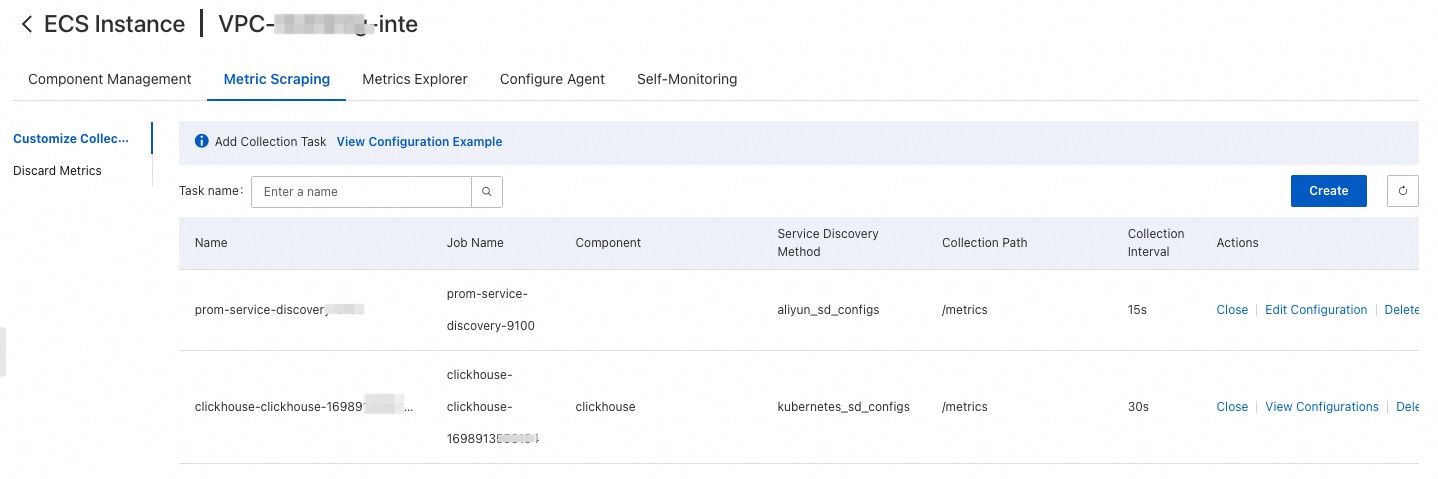
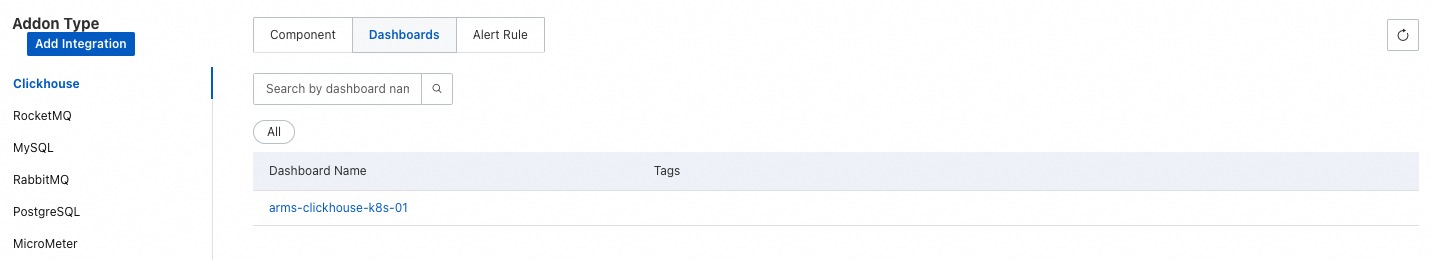
Dashboards
In the Dashboards section of the Component Management tab, you can click a dashboard name to go to Grafana and view more dashboard data.
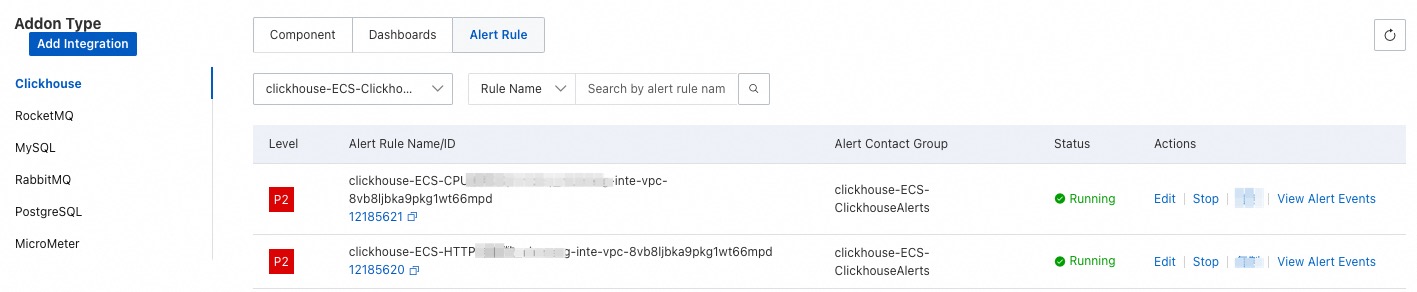
Alert Rule
In the Alert Rule section of the Component Management tab, you can view the alert rules of the database. For information about how to create alert rules, see Create an alert rule for a Prometheus instance.