Schedule garbage collection (VACUUM) to run during off-peak hours so autovacuum no longer competes with your workload during peak hours.
Prerequisites
Before you begin, ensure that you have:
-
A PolarDB for PostgreSQL (Compatible with Oracle) cluster running version 2.0, revision version 2.0.14.12.24.0 or later
Run SHOW polardb_version; to check the revision version. To upgrade, see Update the versions. You can also view the revision version in the console.
Background
PolarDB for PostgreSQL (Compatible with Oracle) uses autovacuum—PostgreSQL's built-in background cleanup process—to reclaim dead tuples, update statistics, and prevent transaction ID wraparound. Autovacuum starts automatically when the autovacuum parameter is set to true.
Autovacuum triggers when the number of changed rows or the database age crosses a threshold. For more information about the conditions, see 20.10. Automatic cleanup. During peak hours, large data volumes change quickly, which causes autovacuum to fire frequently. This creates three problems:
-
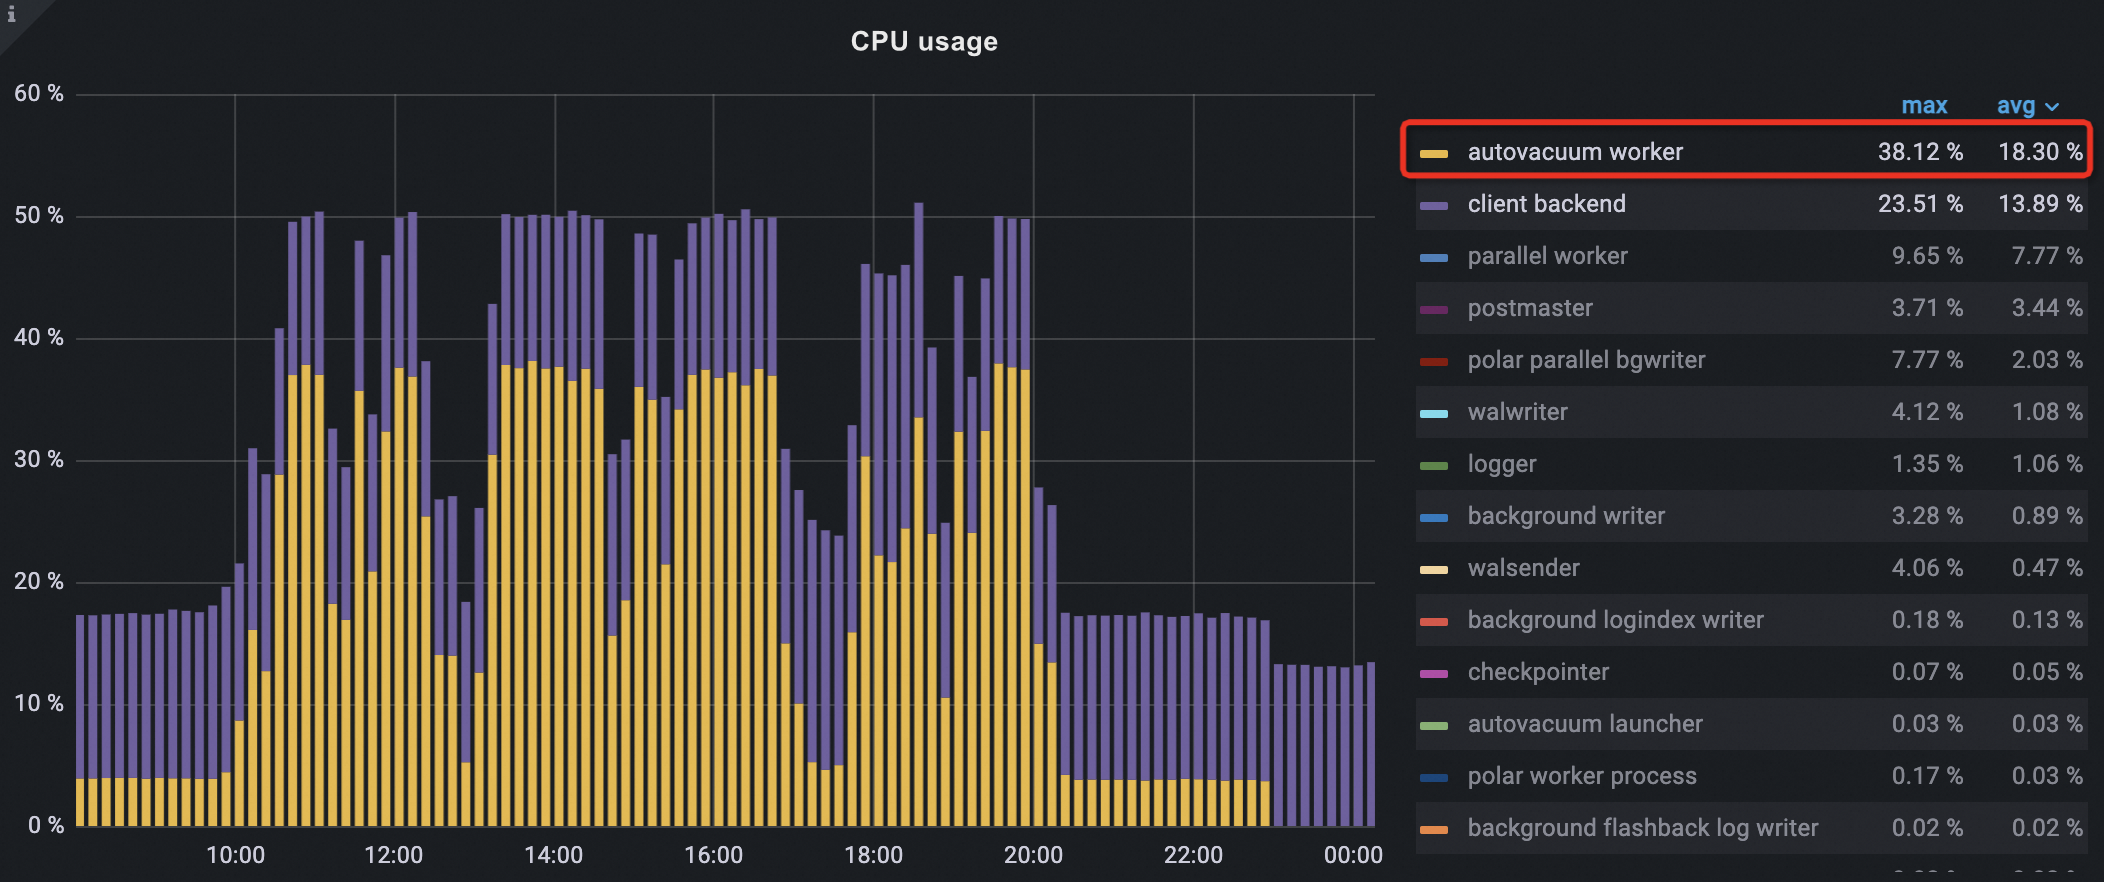
High resource usage. Autovacuum competes directly with your application for CPU and I/O. In practice, autovacuum CPU usage and I/O throughput can rank first among all processes during peak hours.
-
Read/write requests blocked by locked tables. When autovacuum reclaims empty pages, it holds an exclusive lock that briefly blocks other operations on the table, degrading performance at the worst possible time.
-
Plan cache invalidation. When autovacuum collects statistics, it invalidates the existing plan cache. During peak hours, many connections may regenerate execution plans simultaneously, increasing response times.
The global plan cache (GPC) feature in PolarDB for PostgreSQL (Compatible with Oracle) reduces the impact of plan cache invalidation. For details, see Global plan cache.
The root cause is that native PostgreSQL has no concept of off-peak hours. PolarDB for PostgreSQL (Compatible with Oracle) adds this concept: you define a time window, and the cluster uses idle resources during that window to fully vacuum the database. This reduces how often autovacuum needs to run during peak hours, freeing CPU and I/O for your application.
Benefits
Scheduling garbage collection during off-peak hours provides the following benefits:
-
Lower resource contention. Autovacuum runs less frequently during peak hours, reducing CPU and I/O competition with your workload.
-
Healthier database age. More transaction IDs are reclaimed off-peak, reducing the risk of transaction ID wraparound and database unavailability.
-
Better query plans. More up-to-date statistics help the query optimizer choose more accurate execution plans, reducing slow queries.
-
Fewer blocked operations. Scheduling table-locking autovacuum operations off-peak reduces the chance of read/write requests being blocked.
-
Fewer plan cache invalidations. Plan cache invalidations caused by autovacuum statistics collection happen during off-peak hours instead of at peak load.
Usage notes
The methods described in this document require revision version 2.0.14.12.24.0 or later. If your cluster runs an earlier revision, upgrade it in the PolarDB console. For details, see Minor version update.
To configure off-peak hours without upgrading: contact us and provide the start time, end time, and time zone. This backend configuration may stop working after operations and maintenance (O&M) events such as primary/secondary switchover, configuration changes, or zone switching. Upgrade to the latest minor version for a permanent solution.
Set up off-peak garbage collection
Step 1: Create the extension
Create the polar_advisor extension in the postgres database and in every database that needs garbage collection.
CREATE EXTENSION IF NOT EXISTS polar_advisor;To update an existing polar_advisor extension:
ALTER EXTENSION polar_advisor UPDATE;Step 2: Set the off-peak window
Run the following statement in the postgres database to define the off-peak hours:
-- Execute in the postgres database.
SELECT polar_advisor.set_advisor_window(start_time, end_time);| Parameter | Description |
|---|---|
start_time |
The start time of the off-peak window |
end_time |
The end time of the off-peak window |
The window takes effect starting from the current day. The cluster runs garbage collection every day during the window.
Only the window set in the postgres database takes effect.
The time zone offset must match the cluster's time zone configuration; otherwise, the window does not take effect.
Example: Set 23:00–02:00 (UTC+8) as the off-peak window.
SELECT polar_advisor.set_advisor_window(start_time => '23:00:00+08', end_time => '02:00:00+08');Step 3: Verify the window
Run the following statements in the postgres database to confirm the window is configured correctly:
-- View window details.
SELECT * FROM polar_advisor.get_advisor_window();

-- View window duration (in seconds).
SELECT polar_advisor.get_advisor_window_length();

-- Check whether the current time falls within the window.
SELECT now(), * FROM polar_advisor.is_in_advisor_window();

-- View time remaining until the window starts (in seconds).
SELECT * FROM polar_advisor.get_secs_to_advisor_window_start();

-- View time remaining until the window ends (in seconds).
SELECT * FROM polar_advisor.get_secs_to_advisor_window_end();
Example output:
-- Window details
postgres=# SELECT * FROM polar_advisor.get_advisor_window();
  start_time |  end_time   | enabled | last_error_time | last_error_detail | others
-------------+-------------+---------+-----------------+-------------------+--------
 23:00:00+08 | 02:00:00+08 | t       |                 |                   |
(1 row)

-- Window duration
postgres=# SELECT polar_advisor.get_advisor_window_length() / 3600.0 AS "Window duration/h";
Window duration/h
--------------------
3.0000000000000000
(1 row)

-- Current time vs. window
postgres=# SELECT now(), * FROM polar_advisor.is_in_advisor_window();
now                            | is_in_advisor_window
-------------------------------+----------------------
 2024-04-01 07:40:37.733911+00 | f
(1 row)

-- Time to window start
postgres=# SELECT * FROM polar_advisor.get_secs_to_advisor_window_start();
 secs_to_window_start | time_now           | window_start | window_end
----------------------+--------------------+--------------+-------------
         26362.265179 | 07:40:37.734821+00 | 15:00:00+00  | 18:00:00+00
(1 row)

-- Time to window end
postgres=# SELECT * FROM polar_advisor.get_secs_to_advisor_window_end();
 secs_to_window_end | time_now           | window_start | window_end
--------------------+--------------------+--------------+-------------
       36561.870337 | 07:40:38.129663+00 | 15:00:00+00  | 18:00:00+00
(1 row)
Step 4: Enable or disable the window
The window is enabled by default. If you need to suspend off-peak garbage collection temporarily—for example, to avoid conflicts with planned O&M operations—disable the window and re-enable it when you're done.
-- Execute in the postgres database.

-- Disable the window.
SELECT polar_advisor.disable_advisor_window();

-- Re-enable the window.
SELECT polar_advisor.enable_advisor_window();

-- Check whether the window is enabled.
SELECT polar_advisor.is_advisor_window_enabled();
Example output:
-- The window is currently enabled.
postgres=# SELECT polar_advisor.is_advisor_window_enabled();
is_advisor_window_enabled
---------------------------
t
(1 row)

-- Disable the window.
postgres=# SELECT polar_advisor.disable_advisor_window();
disable_advisor_window
------------------------

(1 row)

-- Confirm it is disabled.
postgres=# SELECT polar_advisor.is_advisor_window_enabled();
is_advisor_window_enabled
---------------------------
f
(1 row)

-- Re-enable the window.
postgres=# SELECT polar_advisor.enable_advisor_window();
enable_advisor_window
-----------------------

(1 row)

-- Confirm it is re-enabled.
postgres=# SELECT polar_advisor.is_advisor_window_enabled();
is_advisor_window_enabled
---------------------------
t
(1 row)
Advanced settings
Exclude specific tables from garbage collection
When off-peak hours are active, the system automatically selects tables for garbage collection. To exclude a table, add it to the VACUUM & ANALYZE blacklist.
-- Execute in the business database that contains the table.

-- Add a table to the blacklist.
SELECT polar_advisor.add_relation_to_vacuum_analyze_blacklist(schema_name, relation_name);

-- Check whether a table is in the blacklist.
SELECT polar_advisor.is_relation_in_vacuum_analyze_blacklist(schema_name, relation_name);

-- List all blacklisted tables.
SELECT * FROM polar_advisor.get_vacuum_analyze_blacklist();
Example output:
-- Add public.t1 to the blacklist.
postgres=# SELECT polar_advisor.add_relation_to_vacuum_analyze_blacklist('public', 't1');
 add_relation_to_vacuum_analyze_blacklist
---------------------------
     t
(1 row)

-- Confirm the table is in the blacklist.
postgres=# SELECT polar_advisor.is_relation_in_vacuum_analyze_blacklist('public', 't1');
 is_relation_in_vacuum_analyze_blacklist
--------------------------
     t
(1 row)

-- List all blacklisted tables.
postgres=# SELECT * FROM polar_advisor.get_vacuum_analyze_blacklist();
 schema_name | relation_name |  action_type
-------------+---------------+----------------
 public      | t1            | VACUUM ANALYZE
(1 row)
Prevent garbage collection from running during residual peak traffic
The system monitors active connections during the off-peak window. If active connections exceed the threshold, it skips garbage collection for that cycle. This prevents vacuum operations from interfering with any business traffic that extends into the off-peak window.
The default threshold is 5–10 connections, depending on the number of CPU cores in the cluster.
-- Execute in the postgres database.

-- Get the current threshold.
SELECT polar_advisor.get_active_user_conn_num_limit();

-- Query the actual number of active connections.
-- Alternatively, check in the PolarDB console:
-- Performance Monitoring > Advanced Monitoring > Standard View > Sessions > active_session.
SELECT COUNT(*) FROM pg_catalog.pg_stat_activity sa
JOIN pg_catalog.pg_user u ON sa.usename = u.usename
WHERE sa.state = 'active'
  AND sa.backend_type = 'client backend'
  AND NOT u.usesuper;

-- Set a custom threshold (overrides the default).
SELECT polar_advisor.set_active_user_conn_num_limit(active_user_conn_limit);

-- Reset to the default threshold.
SELECT polar_advisor.unset_active_user_conn_num_limit();
Example: The default threshold is 5, but the actual active connections are 8. Raise the threshold to 10 to allow garbage collection to proceed.
-- Default threshold is 5.
postgres=# SELECT polar_advisor.get_active_user_conn_num_limit();
NOTICE: get active user conn limit by CPU cores number
get_active_user_conn_num_limit
--------------------------------
5
(1 row)

-- Actual active connections: 8 (exceeds the threshold of 5, so GC is skipped).
postgres=# SELECT COUNT(*) FROM pg_catalog.pg_stat_activity sa JOIN pg_catalog.pg_user u ON sa.usename = u.usename
postgres-# WHERE sa.state = 'active' AND sa.backend_type = 'client backend' AND NOT u.usesuper;
count
-------
8
(1 row)

-- Raise the threshold to 10 so GC runs even with 8 active connections.
postgres=# SELECT polar_advisor.set_active_user_conn_num_limit(10);
set_active_user_conn_num_limit
--------------------------------

(1 row)

-- Confirm the new threshold.
postgres=# SELECT polar_advisor.get_active_user_conn_num_limit();
NOTICE: get active user conn limit from table
get_active_user_conn_num_limit
--------------------------------
10
(1 row)

-- Reset to the default.
postgres=# SELECT polar_advisor.unset_active_user_conn_num_limit();
unset_active_user_conn_num_limit
----------------------------------

(1 row)

-- Threshold returns to 5.
postgres=# SELECT polar_advisor.get_active_user_conn_num_limit();
NOTICE: get active user conn limit by CPU cores number
get_active_user_conn_num_limit
--------------------------------
5
(1 row)
View operation results
Off-peak garbage collection results are recorded in log tables in the postgres database. The log tables retain data from the last 90 days.
Quick check
Run this query to confirm that off-peak garbage collection is running and to see when the last few cycles completed:
-- Execute in the postgres database.
SELECT COUNT(*) AS "Tables/indexes",
       MIN(start_time) AS "Start time",
       MAX(end_time) AS "End time",
       exec_id AS "Round"
FROM polar_advisor.advisor_log
GROUP BY exec_id
ORDER BY exec_id DESC;
Example output showing three recent rounds, each processing around 4,390 tables between 01:00 and 04:00:
Tables/indexes |         Start time             |              End time          | Round
---------------+--------------------------------+--------------------------------+------
          4391 | 2024-09-23 01:00:09.413901 +08 | 2024-09-23 03:25:39.029702 +08 |  139
          4393 | 2024-09-22 01:03:07.365759 +08 | 2024-09-22 03:37:45.227067 +08 |  138
          4393 | 2024-09-21 01:03:08.094989 +08 | 2024-09-21 03:45:20.280011 +08 |  137
Log table schemas
`polar_advisor.db_level_advisor_log` records one entry per database per garbage collection round.
CREATE TABLE polar_advisor.db_level_advisor_log (
    id BIGSERIAL PRIMARY KEY,
    exec_id BIGINT,
    start_time TIMESTAMP WITH TIME ZONE,
    end_time TIMESTAMP WITH TIME ZONE,
    db_name NAME,
    event_type VARCHAR(100),
    total_relation BIGINT,
    acted_relation BIGINT,
    age_before BIGINT,
    age_after BIGINT,
    others JSONB
);| Parameter | Description |
|---|---|
id |
Primary key, values are in ascending order |
exec_id |
Round number. A round runs once per day and can span multiple databases, so multiple rows on the same day share the same exec_id |
start_time |
Start time of the garbage collection operation |
end_time |
End time of the garbage collection operation |
db_name |
Database on which garbage collection was performed |
event_type |
Operation type. Fixed to VACUUM |
total_relation |
Total number of subtables and indexes eligible for garbage collection |
acted_relation |
Number of subtables and indexes actually processed |
age_before |
Database age before garbage collection |
age_after |
Database age after garbage collection |
others |
Extended statistics. others->'db_size_before' and others->'db_size_after' show database size before and after; others->'cluster_age_before' and others->'cluster_age_after' show cluster-level database age before and after |
`polar_advisor.advisor_log` records one entry per table or index processed. Multiple rows in this table correspond to a single row in db_level_advisor_log.
CREATE TABLE polar_advisor.advisor_log (
    id BIGSERIAL PRIMARY KEY,
    exec_id BIGINT,
    start_time TIMESTAMP WITH TIME ZONE,
    end_time TIMESTAMP WITH TIME ZONE,
    db_name NAME,
    schema_name NAME,
    relation_name NAME,
    event_type VARCHAR(100),
    sql_cmd TEXT,
    detail TEXT,
    tuples_deleted BIGINT,
    tuples_dead_now BIGINT,
    tuples_now BIGINT,
    pages_scanned BIGINT,
    pages_pinned BIGINT,
    pages_frozen_now BIGINT,
    pages_truncated BIGINT,
    pages_now BIGINT,
    idx_tuples_deleted BIGINT,
    idx_tuples_now BIGINT,
    idx_pages_now BIGINT,
    idx_pages_deleted BIGINT,
    idx_pages_reusable BIGINT,
    size_before BIGINT,
    size_now BIGINT,
    age_decreased BIGINT,
    others JSONB
);| Parameter | Description |
|---|---|
id |
Primary key, values are in ascending order |
exec_id |
Round number (matches db_level_advisor_log.exec_id) |
start_time |
Start time of the garbage collection operation |
end_time |
End time of the garbage collection operation |
db_name |
Database on which garbage collection was performed |
schema_name |
Schema of the processed table or index |
relation_name |
Name of the processed table or index |
event_type |
Operation type. Fixed to VACUUM |
sql_cmd |
Executed command. Example: VACUUM public.t1 |
detail |
Detailed results, for example the output of VACUUM VERBOSE |
tuples_deleted |
Dead tuples reclaimed from the table |
tuples_dead_now |
Dead tuples remaining after garbage collection |
tuples_now |
Live tuples in the table after garbage collection |
pages_scanned |
Pages scanned during garbage collection |
pages_pinned |
Pages that could not be deleted due to cache references |
pages_frozen_now |
Frozen pages after garbage collection |
pages_truncated |
Empty pages deleted or truncated |
pages_now |
Total pages in the table after garbage collection |
idx_tuples_deleted |
Dead tuples reclaimed from indexes |
idx_tuples_now |
Live tuples in indexes after garbage collection |
idx_pages_now |
Index pages after garbage collection |
idx_pages_deleted |
Index pages deleted |
idx_pages_reusable |
Index pages marked as reusable |
size_before |
Table or index size before garbage collection |
size_after |
Table or index size after garbage collection |
age_decreased |
Reduction in table age |
others |
Extended statistics |
Collect statistics
Query the number of tables or indexes processed per day:
-- Execute in the postgres database.
SELECT start_time::pg_catalog.date AS "Date",
       count(*) AS "Tables/indexes"
FROM polar_advisor.advisor_log
GROUP BY start_time::pg_catalog.date
ORDER BY start_time::pg_catalog.date DESC, count(*) DESC;
Example output:
    Date    | Tables/indexes
------------+---------------
 2024-09-23 |          4391
 2024-09-22 |          4393
 2024-09-21 |          4393
Query by date and database to see how work is distributed across databases:
-- Execute in the postgres database.
SELECT start_time::date AS "Date",
       db_name AS "DB",
       count(*) AS "Tables/indexes"
FROM polar_advisor.advisor_log
WHERE now() - start_time::date < INTERVAL '3 days'
GROUP BY start_time::date, db_name
ORDER BY start_time::date DESC, count(*) DESC;
Example output:
    Date    | DB           | Tables/indexes
------------+--------------+---------------
 2024-03-05 | db_123456789 |            697
 2024-03-05 | db_123       |            277
 2024-03-04 | db_123456789 |            695
 2024-03-04 | db_123       |            267
 2024-03-04 | db_12345     |            174
 2024-03-03 | postgres     |             65
(6 rows)
Detailed data
Query the benefit summary per database per round:
-- Execute in the postgres database.
SELECT id,
       start_time AS "Start time",
       end_time AS "End time",
       db_name AS "DB",
       event_type AS "Operation type",
       total_relation AS "Total tables",
       acted_relation AS "Processed tables",
       CASE WHEN others->>'cluster_age_before' IS NOT NULL AND others->>'cluster_age_after' IS NOT NULL
            THEN (others->>'cluster_age_before')::BIGINT - (others->>'cluster_age_after')::BIGINT
            ELSE NULL END AS "Age decrease",
       CASE WHEN others->>'db_size_before' IS NOT NULL AND others->>'db_size_after' IS NOT NULL
            THEN (others->>'db_size_before')::BIGINT - (others->>'db_size_after')::BIGINT
            ELSE NULL END AS "Storage reduction"
FROM polar_advisor.db_level_advisor_log
ORDER BY id DESC;
Example output:
  id  | Start time                    | End time                      | DB           | Operation type | Total tables | Processed tables | Age decrease | Storage reduction
------+-------------------------------+-------------------------------+--------------+----------------+--------------+------------------+--------------+------------------
 1184 | 2024-03-05 00:44:26.776894+08 | 2024-03-05 00:45:56.396519+08 | db_12345     | VACUUM         | 174          | 164              | 694          | 0
 1183 | 2024-03-05 00:43:30.243505+08 | 2024-03-05 00:44:26.695602+08 | db_123456789 | VACUUM         | 100          | 90               | 396          | 0
 1182 | 2024-03-05 00:41:47.70952+08  | 2024-03-05 00:43:30.172527+08 | db_12345     | VACUUM         | 163          | 153              | 701          | 0
(3 rows)
Query per-table details for the most recent operations:
-- Execute in the postgres database.
SELECT start_time AS "Start time",
       end_time AS "End time",
       db_name AS "DB",
       schema_name AS "Schema",
       relation_name AS "Table/index",
       event_type AS "Operation type",
       tuples_deleted AS "Dead tuples reclaimed",
       pages_scanned AS "Pages scanned",
       pages_truncated AS "Empty pages reclaimed",
       idx_tuples_deleted AS "Index dead tuples reclaimed",
       idx_pages_deleted AS "Index pages reclaimed",
       age_decreased AS "Table age decrease"
FROM polar_advisor.advisor_log
ORDER BY id DESC LIMIT 3;
Example output:
        Start time             |          End time             | DB       | Schema | Table/index | Operation type | Dead tuples reclaimed | Pages scanned | Empty pages reclaimed | Index dead tuples reclaimed | Index pages reclaimed | Table age decrease
-------------------------------+-------------------------------+----------+--------+-------------+----------------+-----------------------+---------------+-----------------------+-----------------------------+-----------------------+-------------------
 2024-03-05 00:45:56.204254+08 | 2024-03-05 00:45:56.357263+08 | db_12345 | public | cccc        | VACUUM         | 0                     | 33            | 0                     | 0                           | 0                     | 1345944
 2024-03-05 00:45:56.068499+08 | 2024-03-05 00:45:56.200036+08 | db_12345 | public | aaaa        | VACUUM         | 0                     | 28            | 0                     | 0                           | 0                     | 1345946
 2024-03-05 00:45:55.945677+08 | 2024-03-05 00:45:56.065316+08 | db_12345 | public | bbbb        | VACUUM         | 0                     | 0             | 0                     | 0                           | 0                     | 1345947
(3 rows)
Find rounds with the largest database age decrease
PolarDB for PostgreSQL (Compatible with Oracle) has approximately 2.1 billion available transaction IDs. Database age measures how many have been consumed. When the age reaches 2.1 billion, transaction IDs wrap around and the database becomes unavailable. To check the current cluster age, run:
-- Execute in the postgres database.
-- Alternatively, check in the PolarDB console:
-- Performance Monitoring > Advanced Monitoring > Standard View > Vacuum- > db_age.
SELECT MAX(pg_catalog.age(datfrozenxid)) AS "Cluster age" FROM pg_catalog.pg_database;
To find the rounds that reduced the cluster age the most:
-- Execute in the postgres database.

-- Find the top 3 rounds by cluster age decrease.
SELECT id,
       exec_id AS "Round",
       start_time AS "Start time",
       end_time AS "End time",
       db_name AS "DB",
       event_type AS "Operation type",
       CASE WHEN others->>'cluster_age_before' IS NOT NULL AND others->>'cluster_age_after' IS NOT NULL
            THEN (others->>'cluster_age_before')::BIGINT - (others->>'cluster_age_after')::BIGINT
            ELSE NULL END AS "Age decrease"
FROM polar_advisor.db_level_advisor_log
ORDER BY "Age decrease" DESC NULLS LAST LIMIT 3;

-- Then drill into a specific round (replace 91 with the exec_id from the previous query).
SELECT id,
       start_time AS "Start time",
       end_time AS "End time",
       db_name AS "DB",
       schema_name AS "Schema",
       relation_name AS "Table name",
       sql_cmd AS "Command",
       event_type AS "Operation type",
       age_decreased AS "Age decrease"
FROM polar_advisor.advisor_log
WHERE exec_id = 91
ORDER BY "Age decrease" DESC NULLS LAST;
Example output:
-- Top rounds by cluster age decrease.
postgres=# SELECT id, exec_id AS "Round", start_time AS "Start time", end_time AS "End time", db_name AS "DB", event_type AS "Operation type", CASE WHEN others->>'cluster_age_before' IS NOT NULL AND others->>'cluster_age_after' IS NOT NULL THEN (others->>'cluster_age_before')::BIGINT - (others->>'cluster_age_after')::BIGINT ELSE NULL END AS "Age decrease" FROM polar_advisor.db_level_advisor_log ORDER BY "Age decrease" DESC NULLS LAST LIMIT 3;
 id  | Round |          Start time           |           End time            |      DB       | Operation type | Age decrease
-----+-------+-------------------------------+-------------------------------+---------------+----------------+-------------
 259 |    91 | 2024-02-22 00:00:18.847978+08 | 2024-02-22 00:14:18.785085+08 | aaaaaaaaaaaaa | VACUUM         |     9275406
 256 |    90 | 2024-02-21 00:00:39.607552+08 | 2024-02-21 00:00:42.054733+08 | bbbbbbbbbbbbb | VACUUM         |     7905122
 262 |    92 | 2024-02-23 00:00:05.999423+08 | 2024-02-23 00:00:08.411993+08 | postgres      | VACUUM         |      578308

-- Drill into Round 91: the age decrease comes from vacuuming pg_catalog system tables.
postgres=# SELECT id, start_time AS "Start time", end_time AS "End time", db_name AS "DB", schema_name AS "Schema", relation_name AS "Table name", event_type AS "Operation type", age_decreased AS "Age decrease" FROM polar_advisor.advisor_log WHERE exec_id = 91 ORDER BY "Age decrease" DESC NULLS LAST;
    id    |          Start time           |           End time            | DB  |   Schema   |      Table name    | Operation type | Age decrease
----------+-------------------------------+-------------------------------+-----+------------+--------------------+----------------+-------------
    43933 | 2024-02-22 00:00:19.070493+08 | 2024-02-22 00:00:19.090822+08 | abc | pg_catalog | pg_subscription    | VACUUM         |     27787409
    43935 | 2024-02-22 00:00:19.116292+08 | 2024-02-22 00:00:19.13875+08  | abc | pg_catalog | pg_database        | VACUUM         |     27787408
    43936 | 2024-02-22 00:00:19.140992+08 | 2024-02-22 00:00:19.171938+08 | abc | pg_catalog | pg_db_role_setting | VACUUM         |     27787408

-- Current cluster age: ~20 million, well below the 2.1 billion limit.
postgres=> SELECT MAX(pg_catalog.age(datfrozenxid)) AS "Cluster age" FROM pg_catalog.pg_database;
Cluster age
-----------
   20874380
(1 row)
Optimization examples
The following examples show real-world results from clusters after enabling off-peak garbage collection.
Improvements to locked table blocking and plan cache invalidation are not easily captured in charts and are not shown here.
Results vary by workload. Clusters with high load throughout the day or with data analysis, import, or materialized view refresh jobs scheduled during off-peak hours may see smaller improvements.
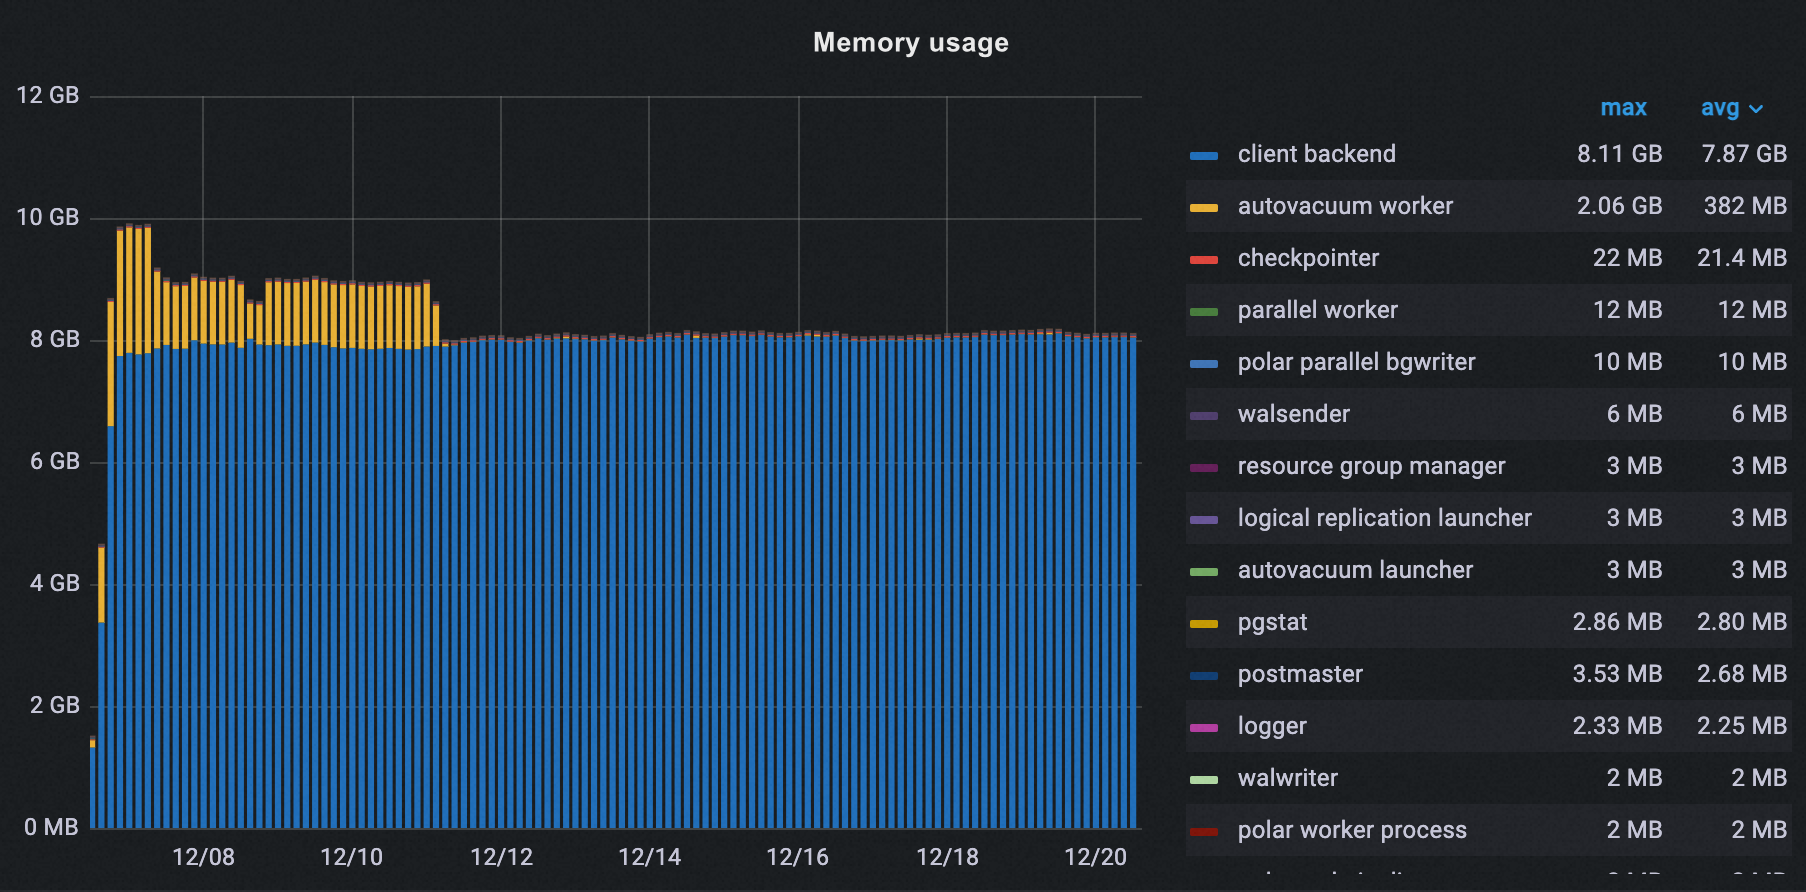
Memory usage
After enabling off-peak hours, autovacuum peak memory dropped from 2.06 GB to 37 MB—a 98% reduction.
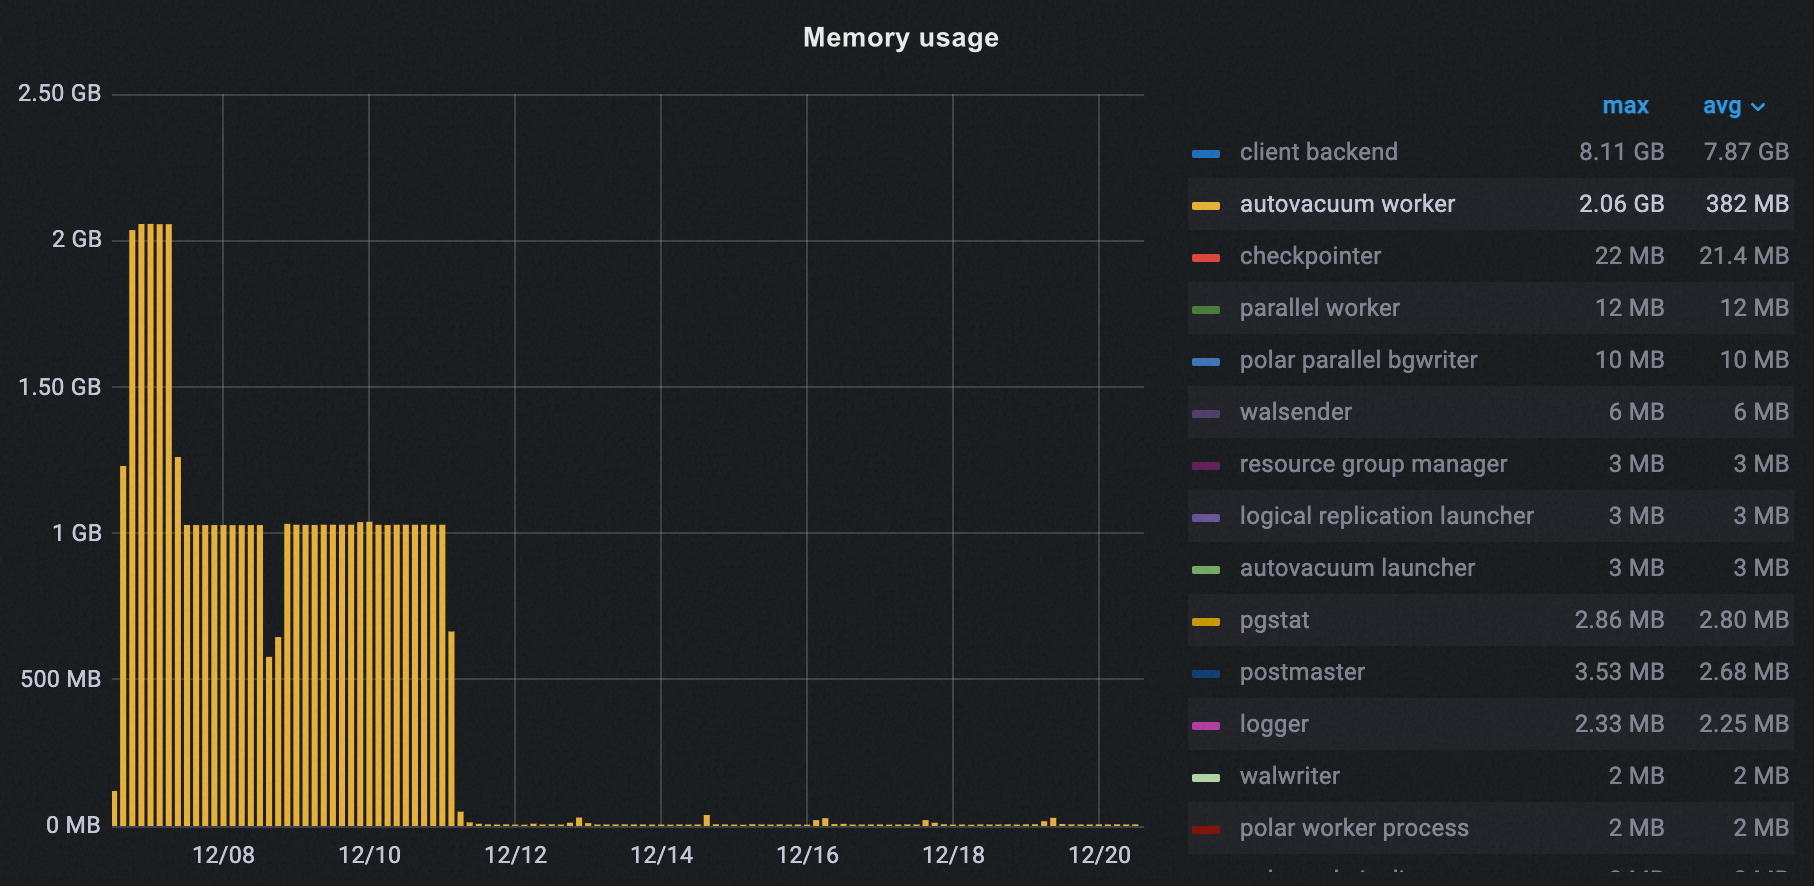
Total peak memory across all processes decreased from 10 GB to 8 GB, a 20% reduction.
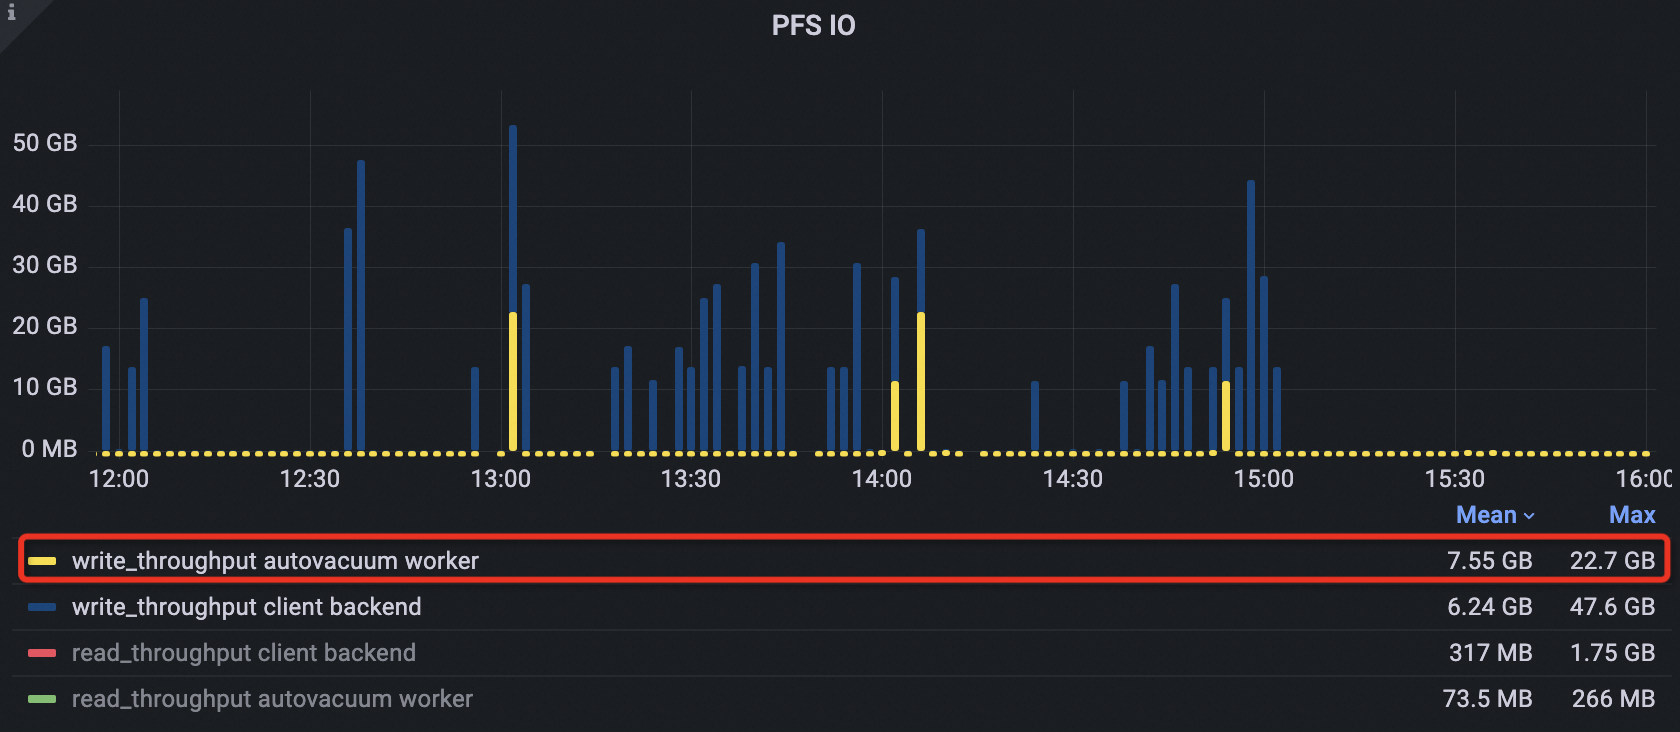
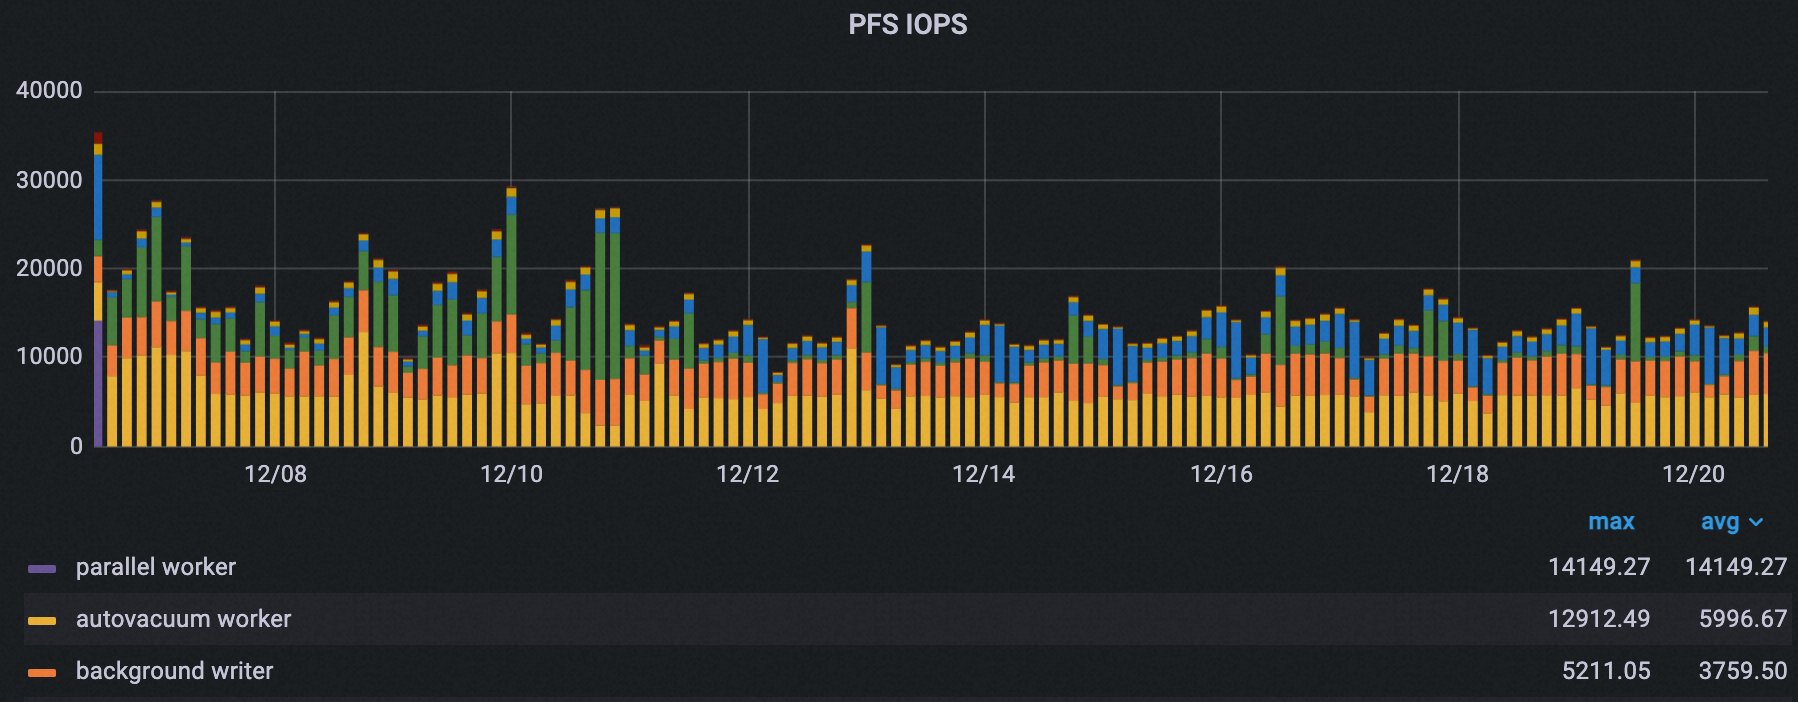
I/O throughput
Autovacuum peak PolarDB File System (PFS) IOPS dropped by about 50%.
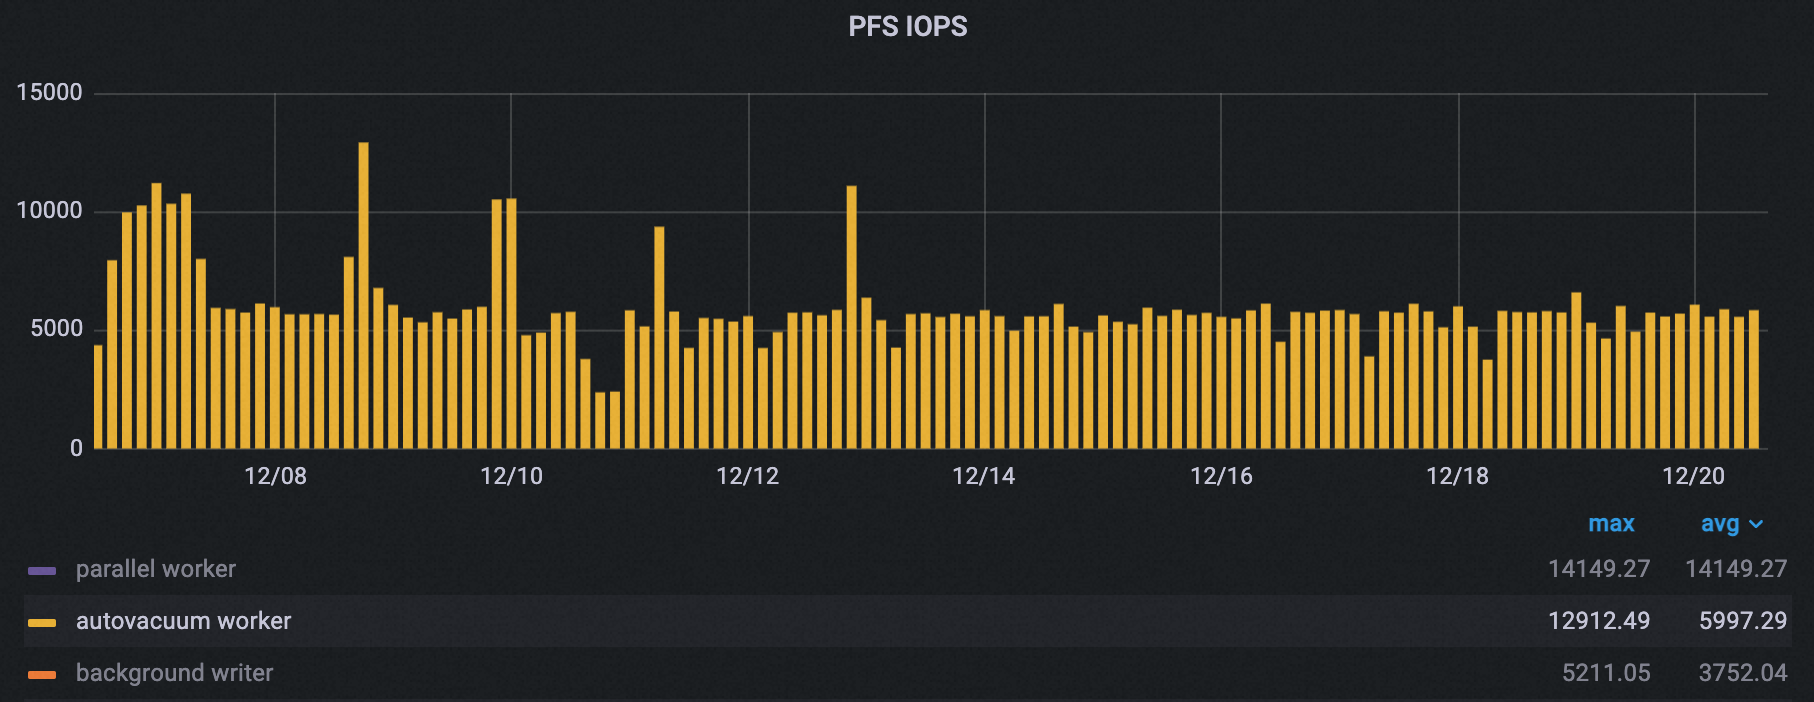
Total peak PFS IOPS across all processes decreased from 35,000 to about 21,000, a 40% reduction.
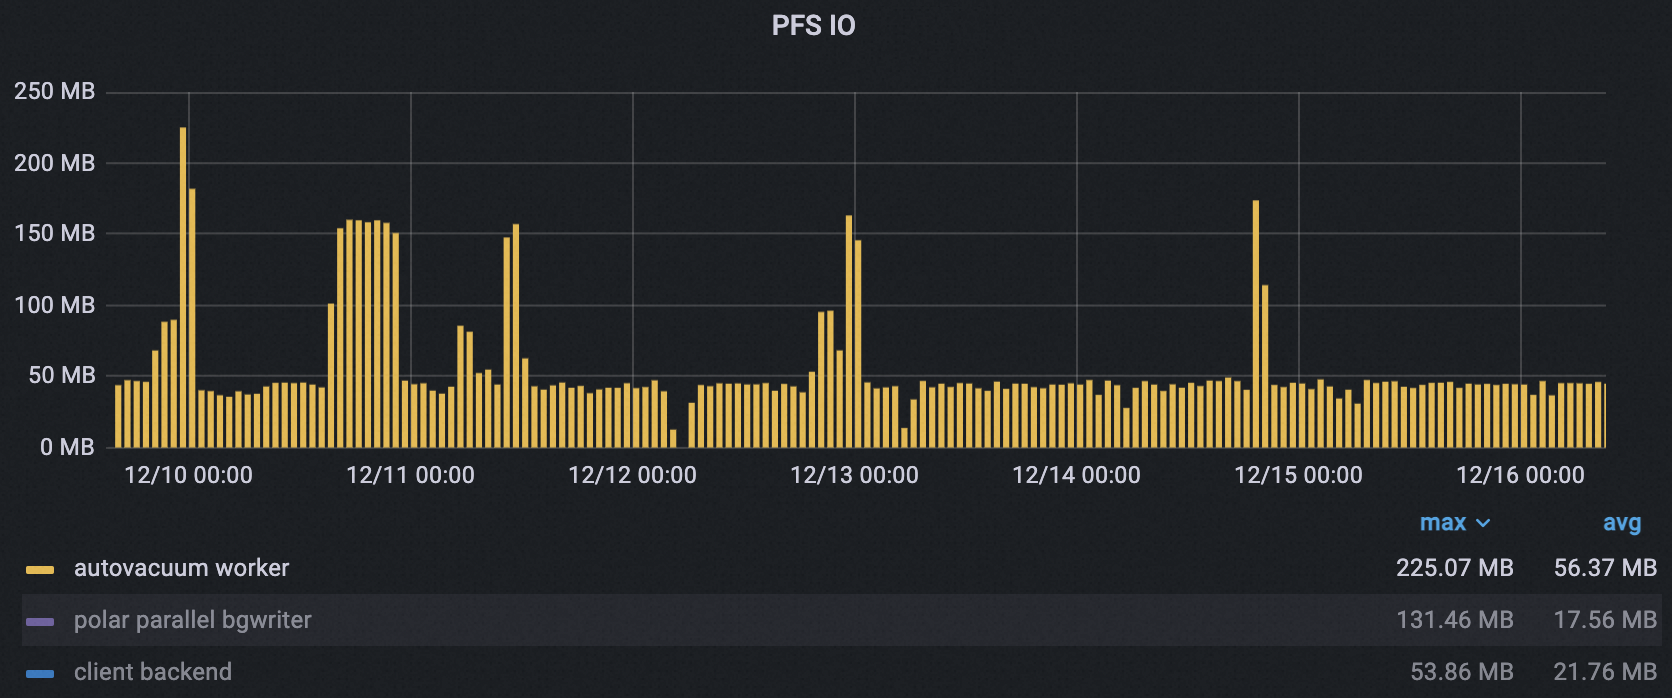
Autovacuum peak PFS throughput dropped from 225 MB to 173 MB (23%). Average throughput dropped from 65.5 MB to 42.5 MB (35%), with fewer and narrower peaks.
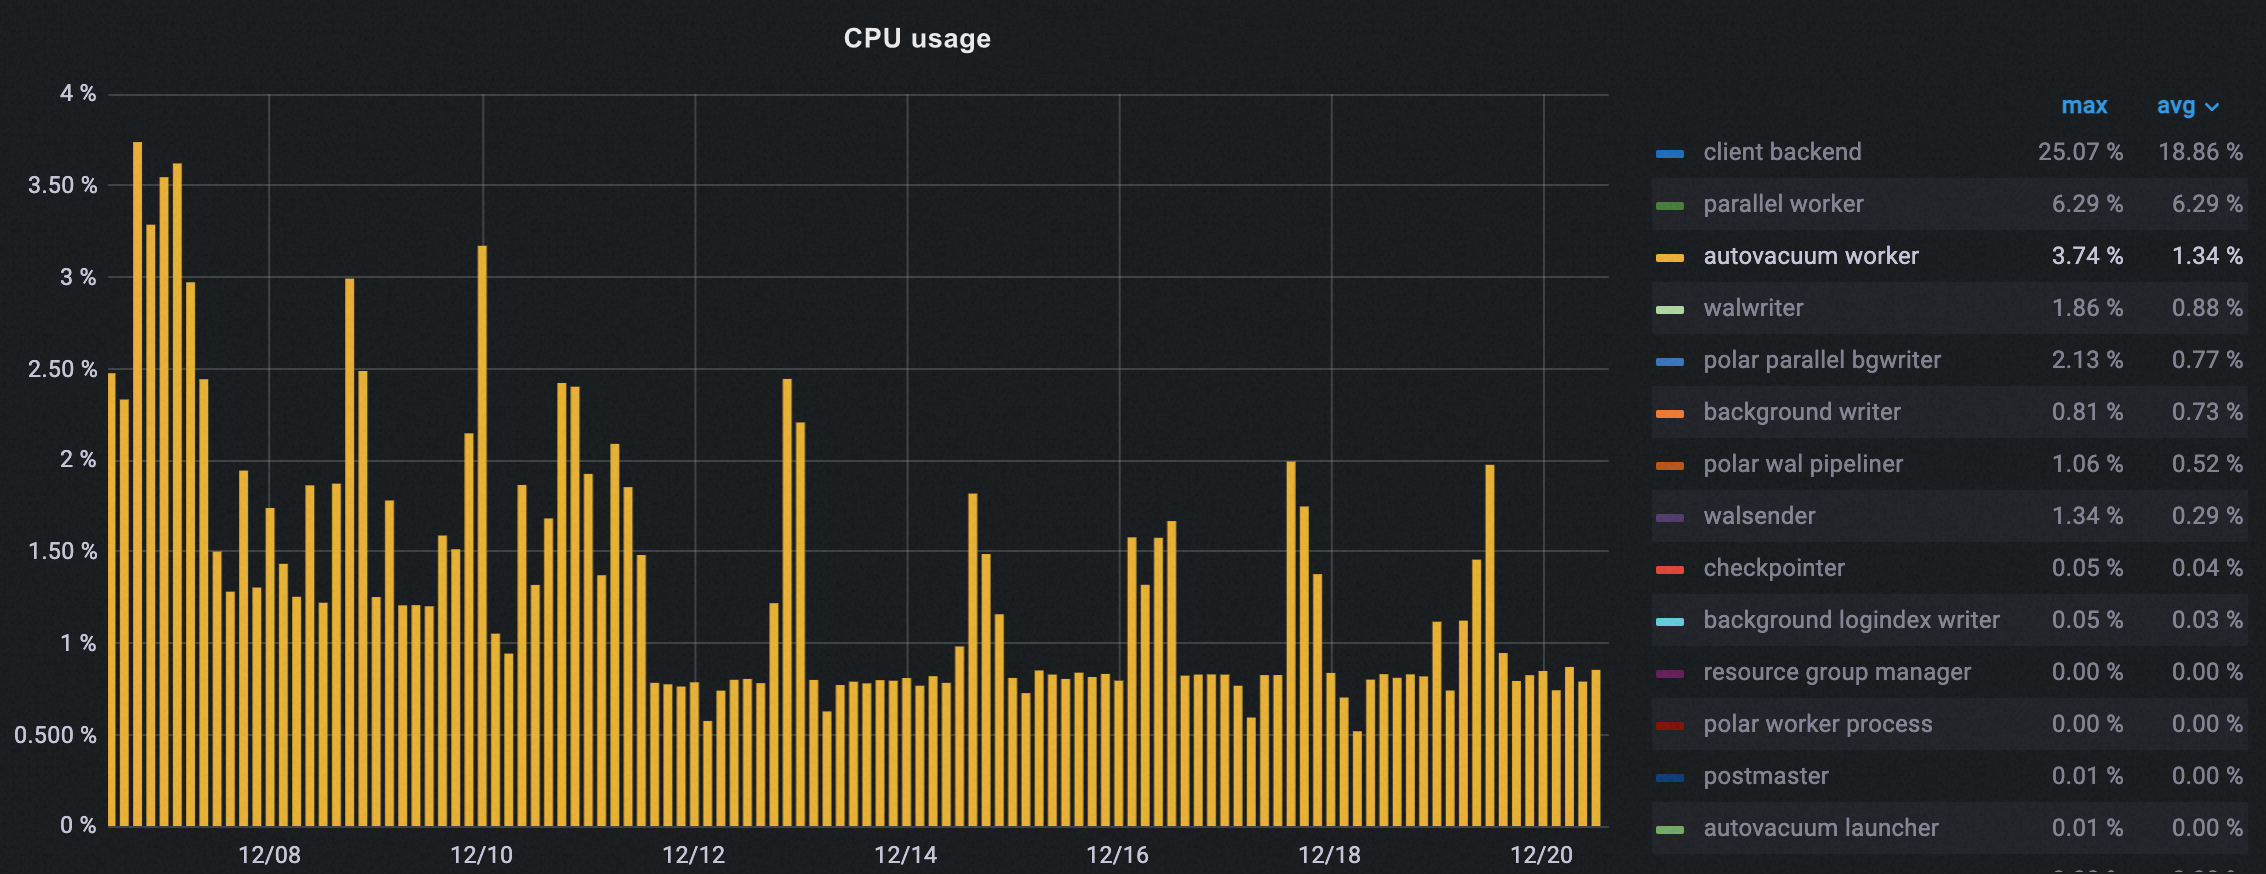
CPU usage
Autovacuum CPU usage decreased gradually after enabling off-peak hours, dropping about 50% at peak.
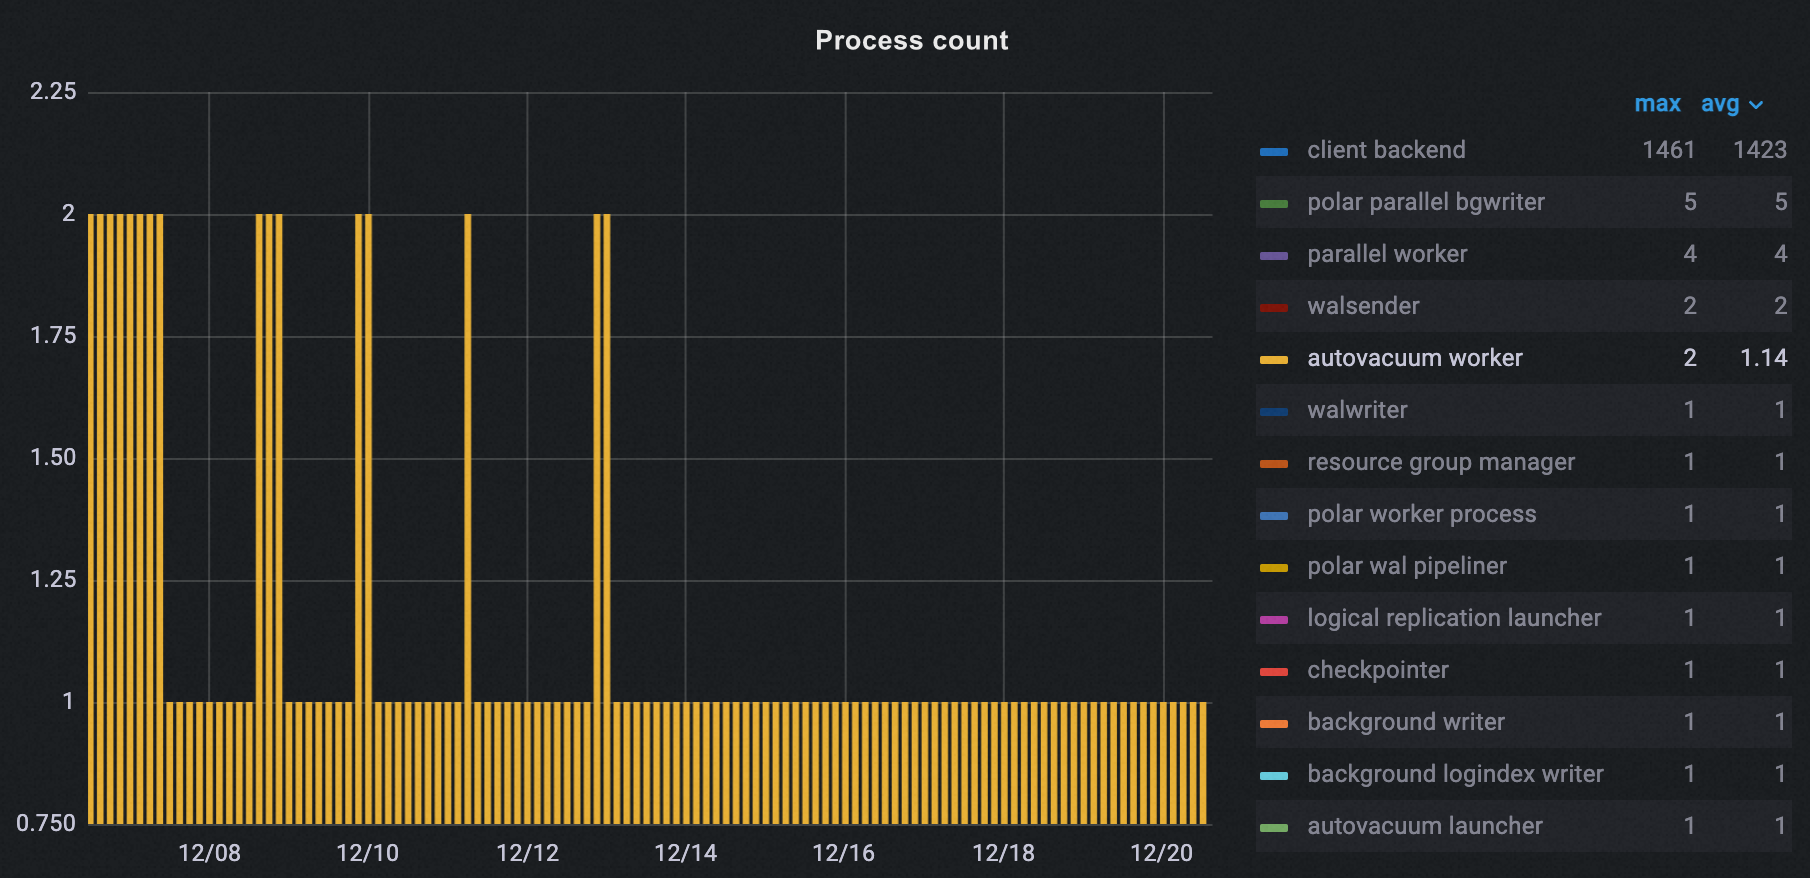
Number of autovacuum runs
The number of autovacuum runs during peak hours dropped from 2 to 1.
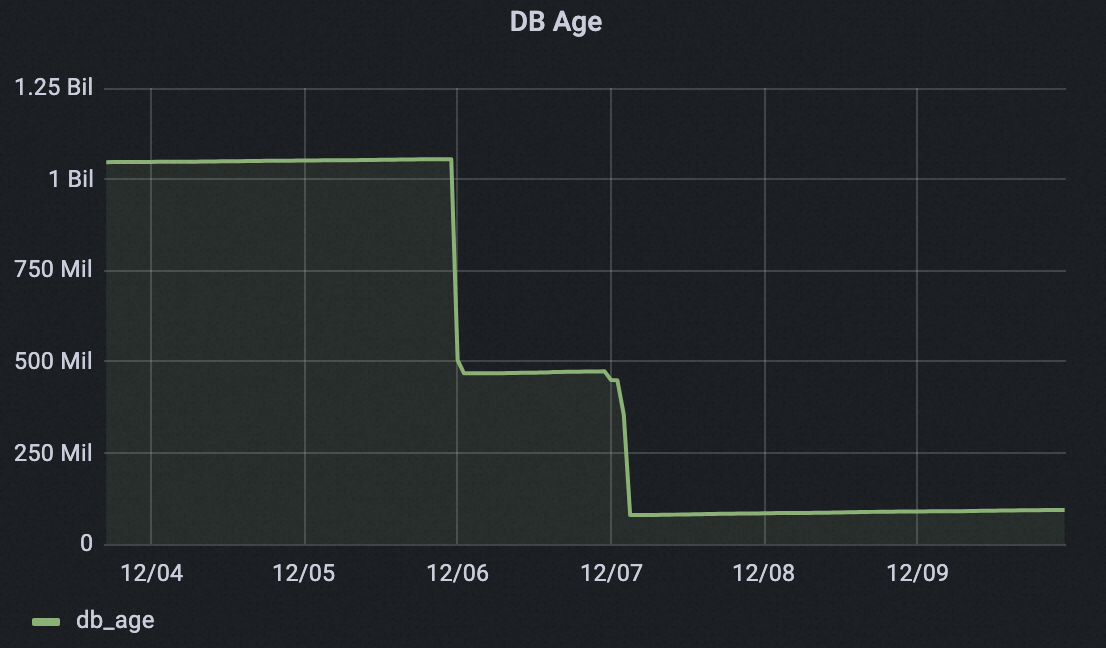
Database age
Within two days of enabling off-peak hours, one cluster reclaimed more than 1 billion transaction IDs, dropping the database age from over 1 billion to under 0.1 billion. This greatly reduces the risk of transaction ID wraparound.