Automatic Workload Repository (AWR) collects and analyzes performance statistics of databases. You can use AWR to generate database performance reports for a specified period of time from statistics such as dynamic views of databases.
Overview
In addition to analyzing database resources, top SQL statements, top tables, and top indexes, the global AWR performance report feature of PolarDB for PostgreSQL (Compatible with Oracle) further expands the boundary of traditional AWR reports to cover all primary and read-only nodes of the PolarDB cluster and provides a global perspective on clusters. Performance data and event information of the cluster are collected for instance exception analysis. The collection granularity of key metrics is accurate to seconds. Trend charts are provided by using Grafana to identify root causes of performance jitters.
Architecture and data flow

AWR architecture
Collection layer: UE is deployed on physical machines as a proxy process and collects performance data and event information from PolarDB for PostgreSQL (compatible with Oracle) clusters.
Storage layer: After UE collects data, you can configure whether to write the collected data back to the clusters.
Presentation layer: You can use Grafana dashboards to view the analysis and reports. To do that, you need to configure the cluster as the data source and import the dashboard configuration file into Grafana.
Presentation
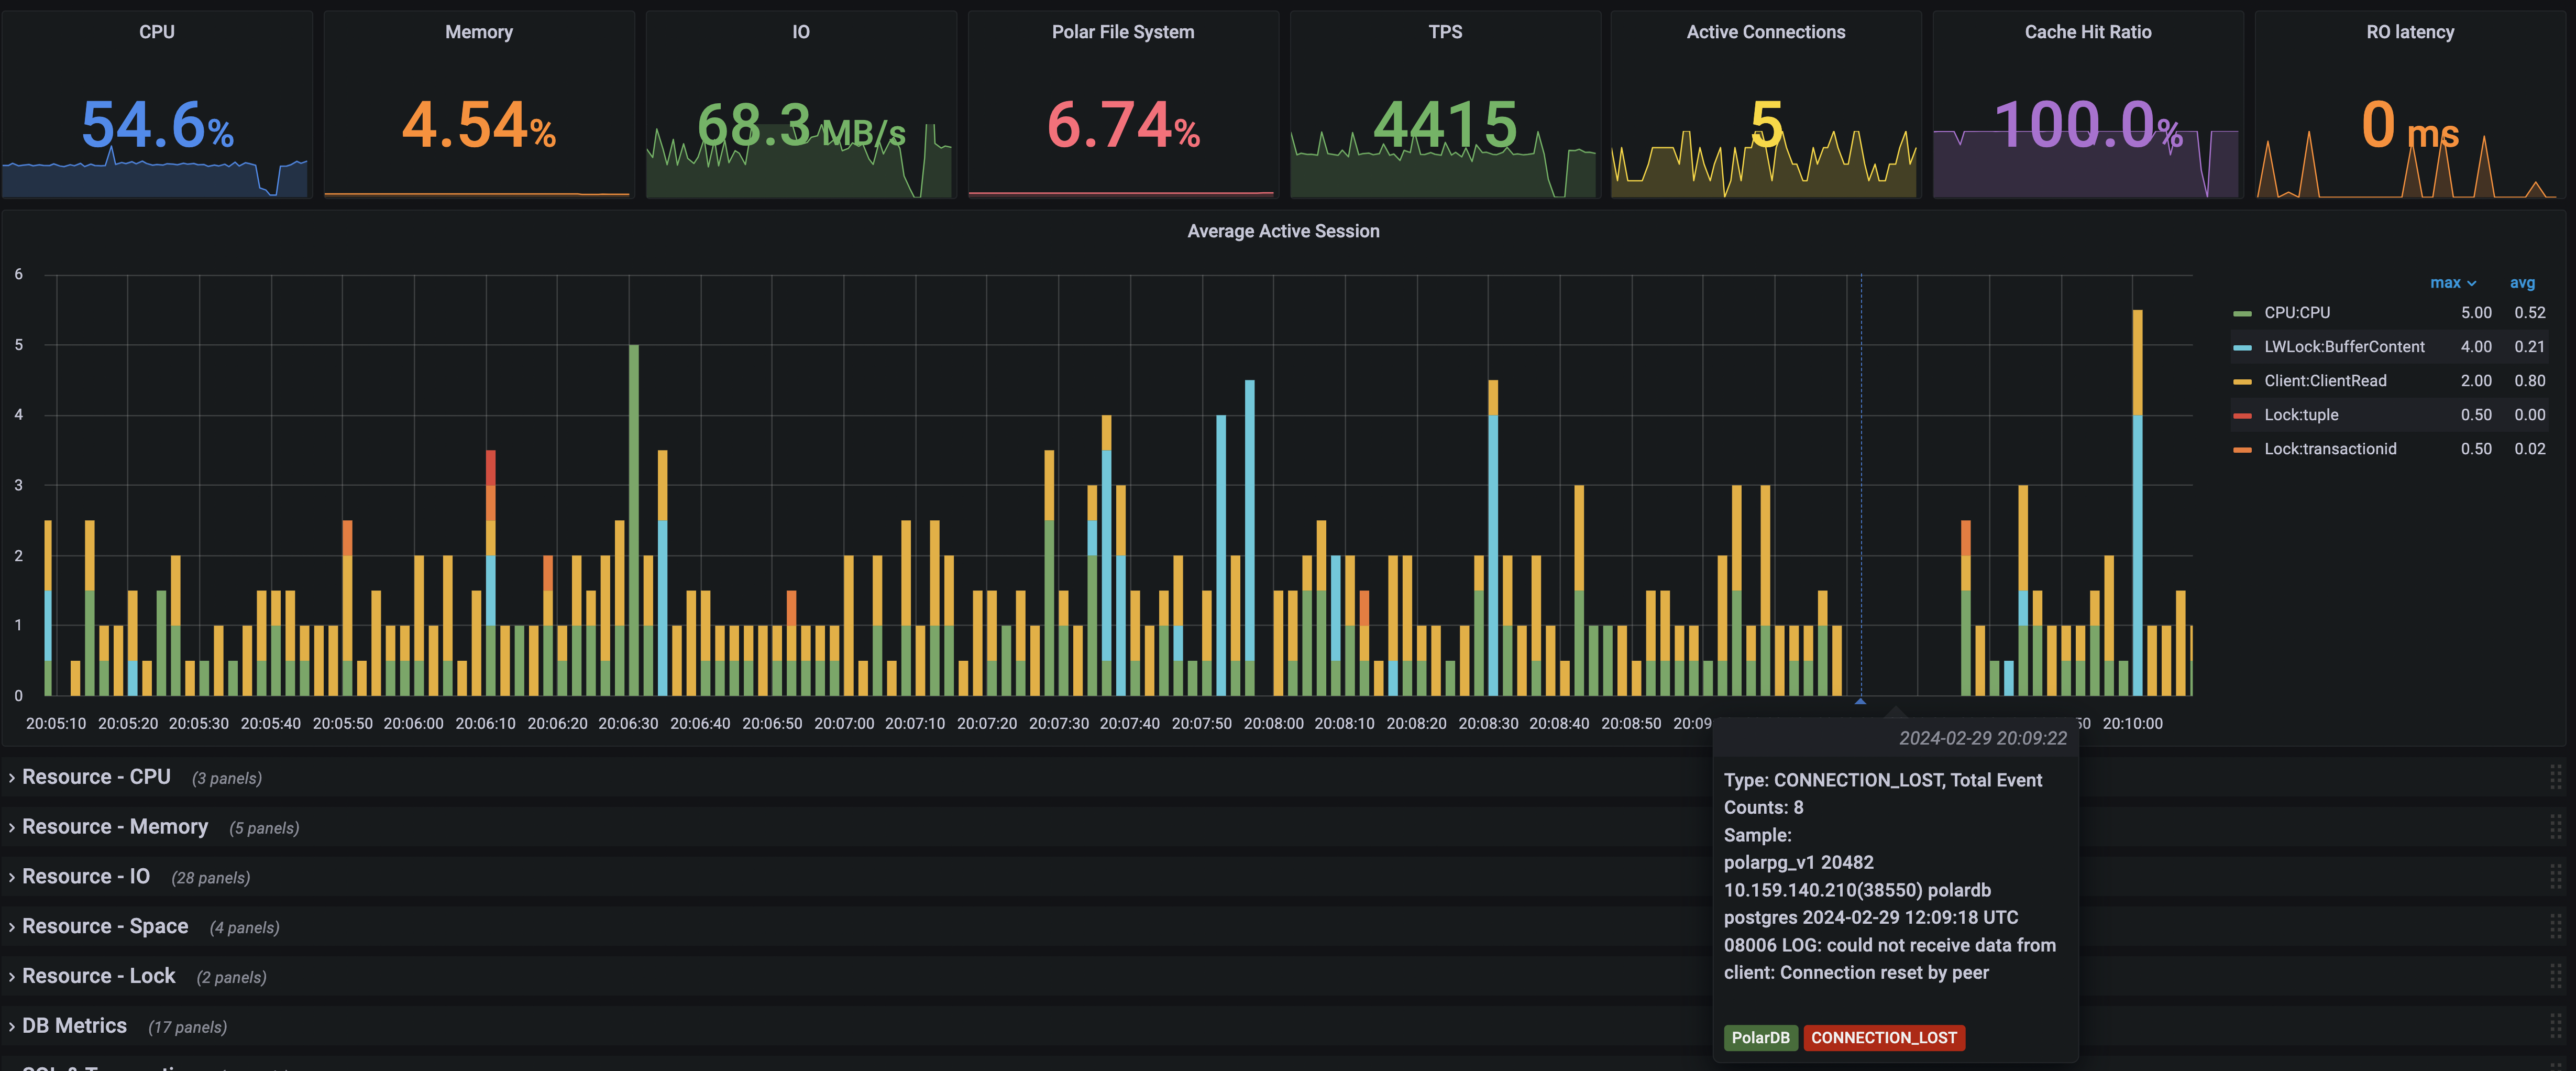
You can use Grafana dashboards to view the performance trends and events of PolarDB for PostgreSQL (Compatible with Oracle). See the following example.
The Average Active Sessions trend chart is provided for performance analysis. You can identify the performance bottleneck of the database by analyzing this chart and the resource consumption. You can also analyze the event information to identify root causes of performance jitters. The following figure shows that a disconnection occurred at 20:09:22.
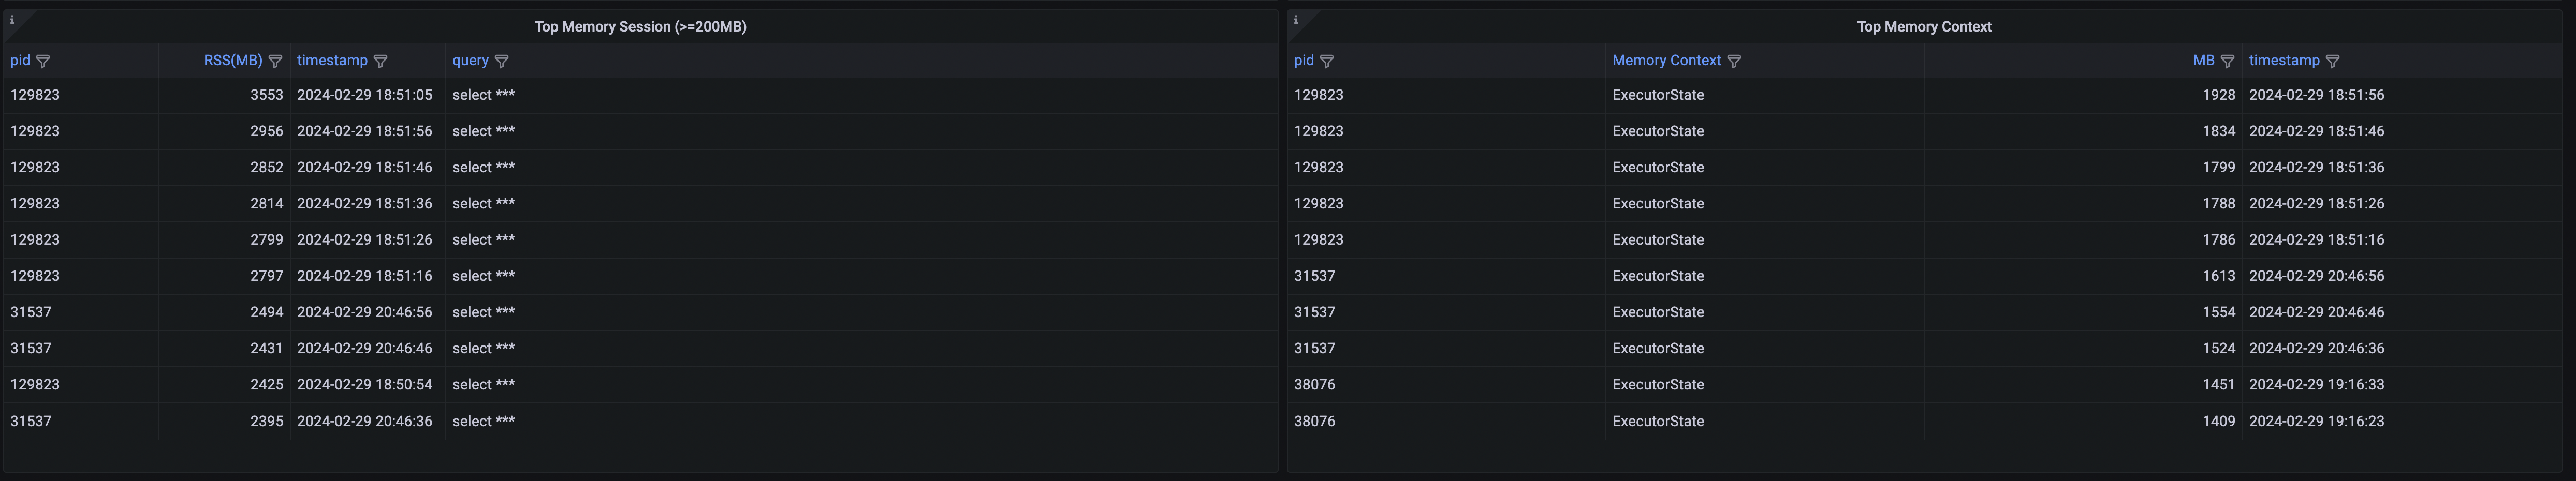
You can view the memory usage and memory context of a SQL statement.
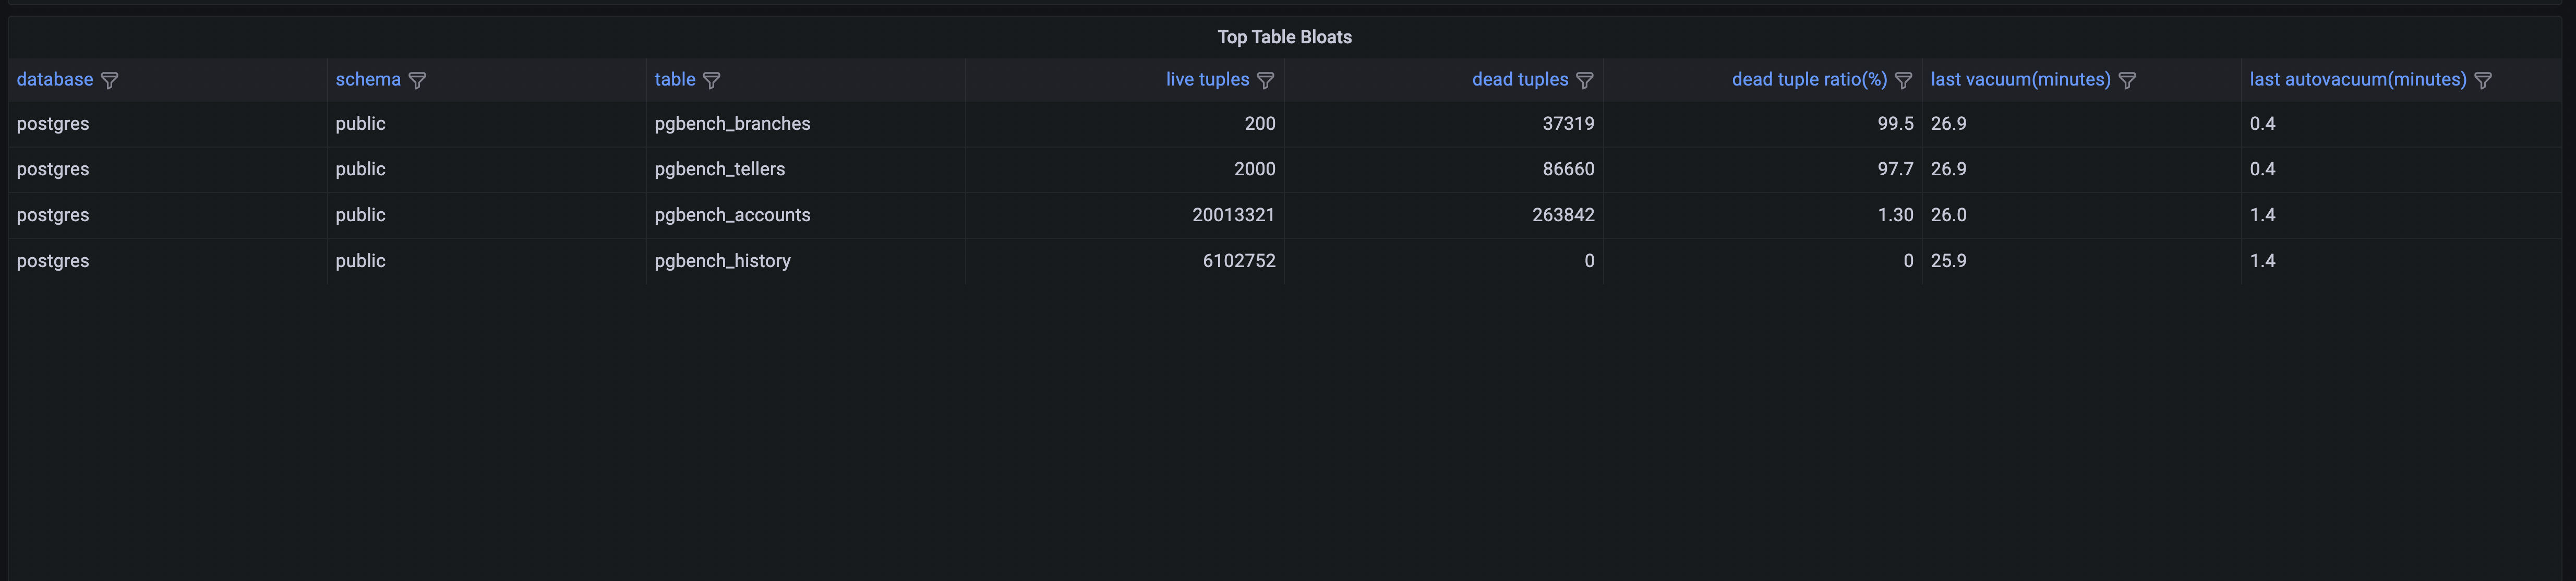
You can also view analysis of top SQL statements and top tables.
For more information about how to enable and configure these features, see Usage.
Usage
Prerequisites
Kernel version
The kernel version of PolarDB for PostgreSQL (Compatible with Oracle) is 20211231 or later.
Execute the following statement to view the current kernel version:
show polar_release_date;The following result shows that the current kernel version is 20211231.
polar_release_date
--------------------
20211231
(1 row)
Permissions
The control permissions and data permissions for the global AWR feature are PUBLIC.
Time zone
The default time zone of PolarDB for PostgreSQL (Compatible with Oracle) cluster is UTC. When you view the performance data, you must remember the time difference for your time zone.
Enable or disable the local storage feature for global AWR data
You must enable the local storage feature for global AWR data. After the global AWR feature is enabled, fine-grained performance reports can be generated without periodically triggering snapshots. You can view performance data in polar_gawr_collection mode of the postgres database.
For key metrics, PolarDB for PostgreSQL (Compatible with Oracle) performs fine-grained collection and writing. After the global AWR feature is enabled, additional overheads are incurred. You must carefully evaluate whether the global AWR feature is necessary from the following perspectives:
Overall performance overheads: The overal performance loss is within 10%.
Storage overheads: By default, data is retained for three days. The size of the most fine-grained data for three days must be less than 10 GB.
Description
The following operations must be performed in the postgres database.
Enable the local storage feature for global AWR data.
SELECT polar_gawr_collection.enable_store_in_localdb();A similar output is displayed:
 enable_store_in_localdb
-------------------------

(1 row)
Disable the local storage feature for global AWR data.
SELECT polar_gawr_collection.disable_store_in_localdb();A similar output is displayed:
 disable_store_in_localdb
--------------------------

(1 row)
View whether the local storage feature for global AWR data is enabled.
SELECT polar_gawr_collection.show_store_in_localdb();A similar output is displayed:
 show_store_in_localdb
-----------------------
 t
(1 row)
Configure Grafana to view AWR information
Download and install Grafana
For more information, see Download Grafana. We recommend that you use Grafana 8.1.2 or later.
Add a data source
Add the PolarDB for PostgreSQL (compatible with Oracle) cluster as a PostgreSQL data source.
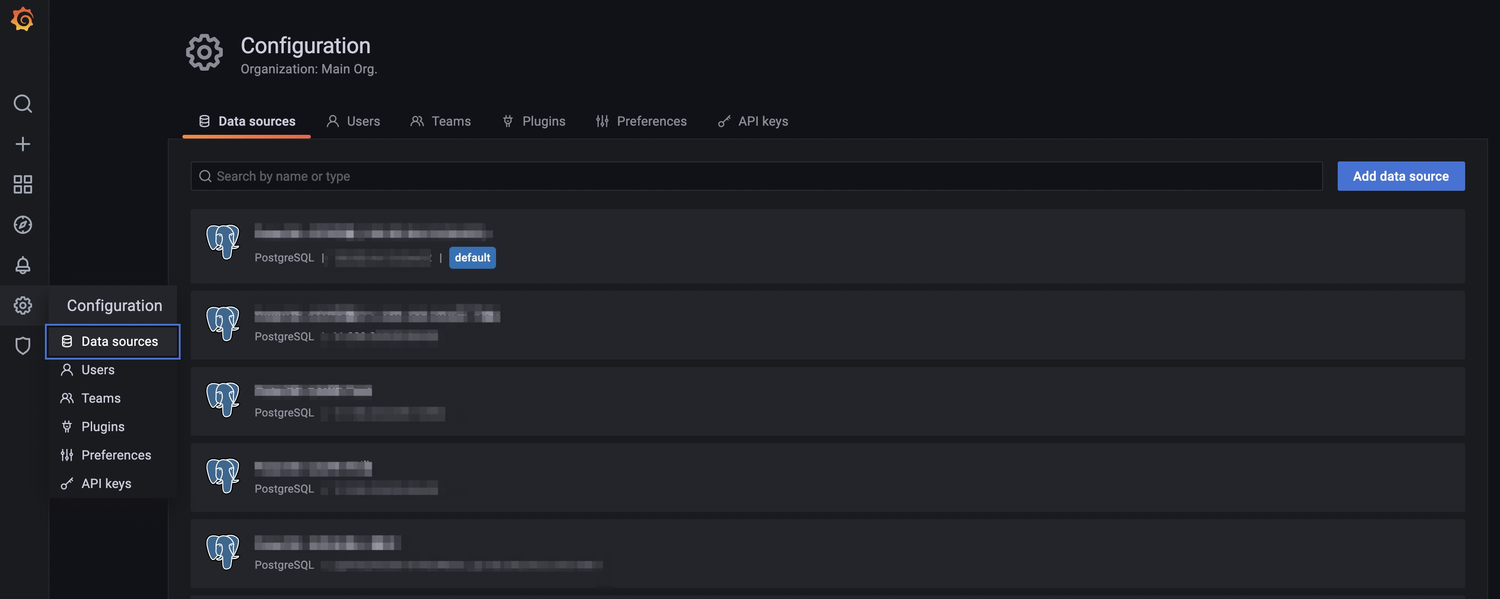
Start Grafana. In the left-side navigation pane, choose Configuration > Data sources.
On the Data sources tab, click Add data source in the upper-right corner.
Enter the connection information of the database cluster.
NoteIn the
Databasefield, enterpostgres.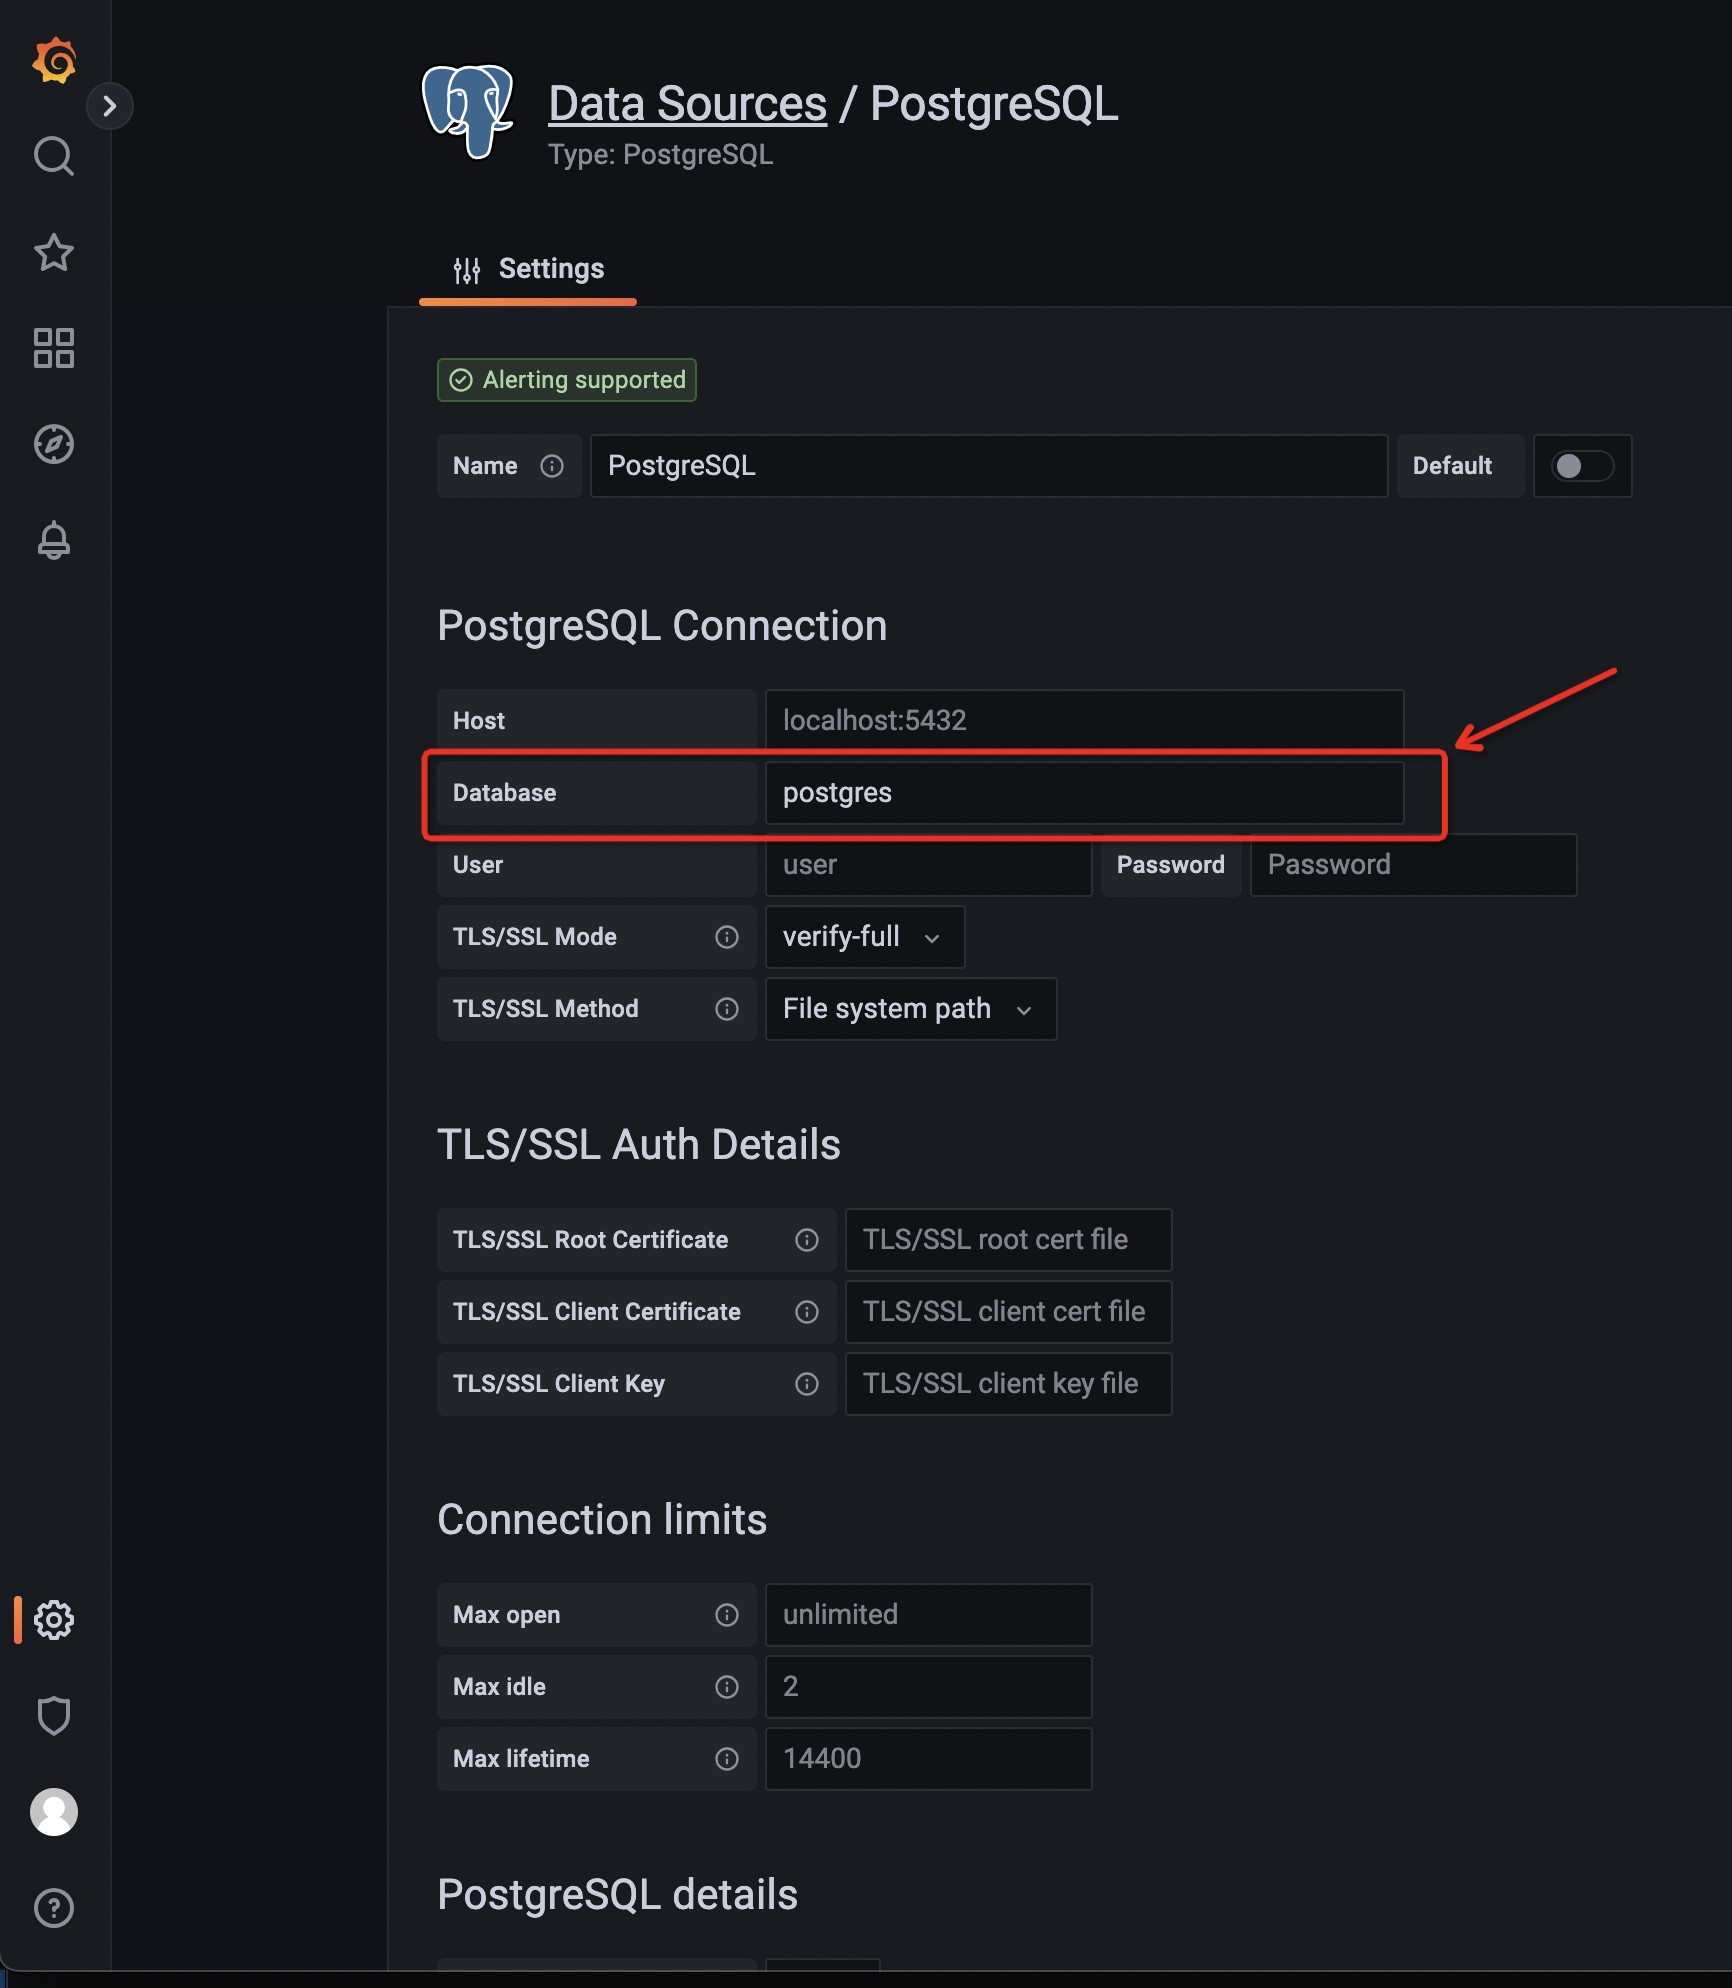
Import the dashboard configuration file
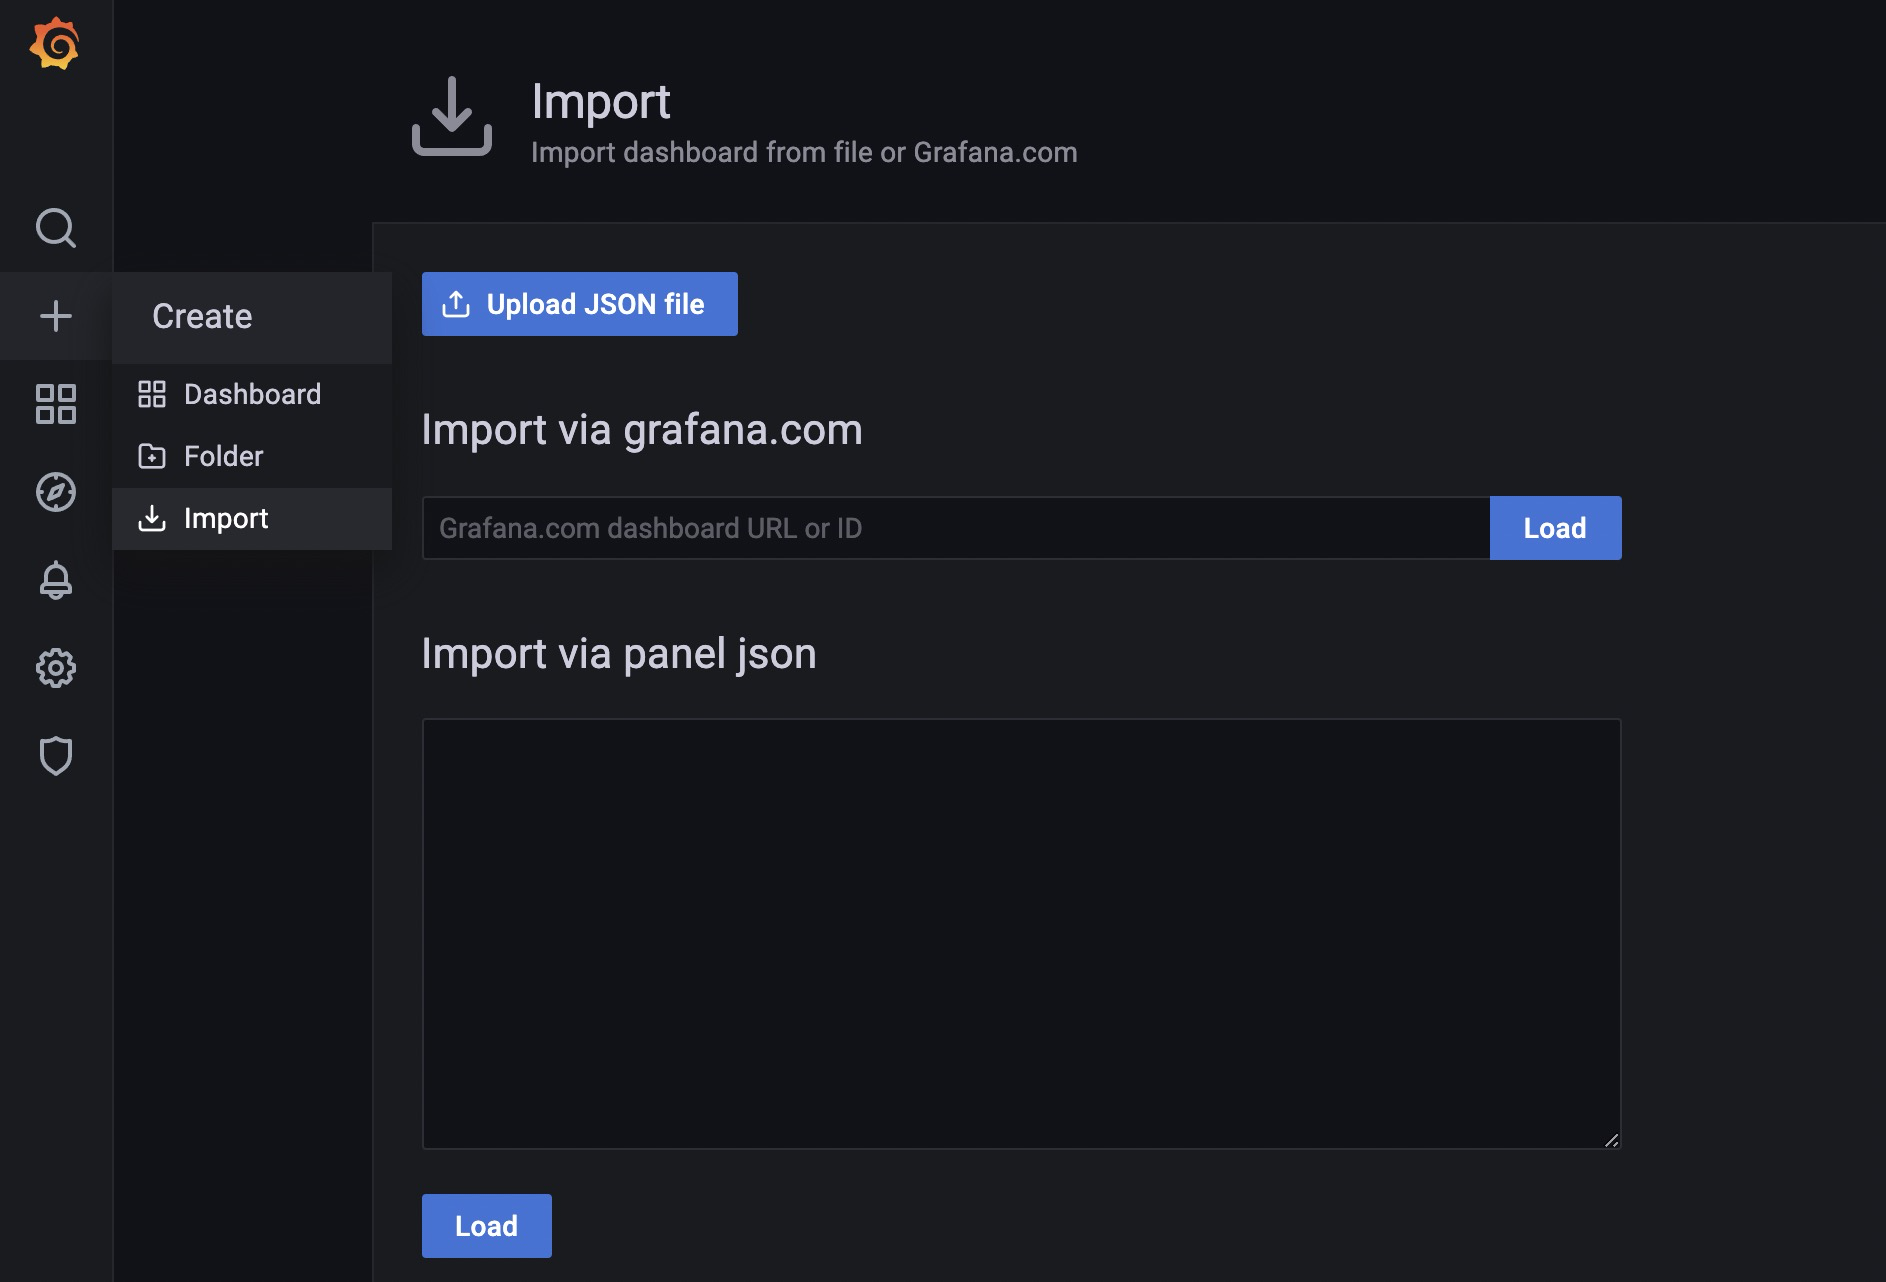
In the left-side navigation pane, choose + > Import.
On the Import page, click Upload JSON file to import the dashboard configuration file.
You can click PolarDB Global AWR-1712645731515.json to download the dashboard configuration file. Decompress the configuration file before you can use it.