Build custom pipelines in Designer to create, train, and deploy machine learning models. This guide walks through a heart disease classification example.
Prerequisites
-
Activate PAI and create a workspace. See Activate and Create a Default Workspace.
-
Associate the workspace with MaxCompute resources. See Quick Start - Preparations.
Step 1: Create a pipeline
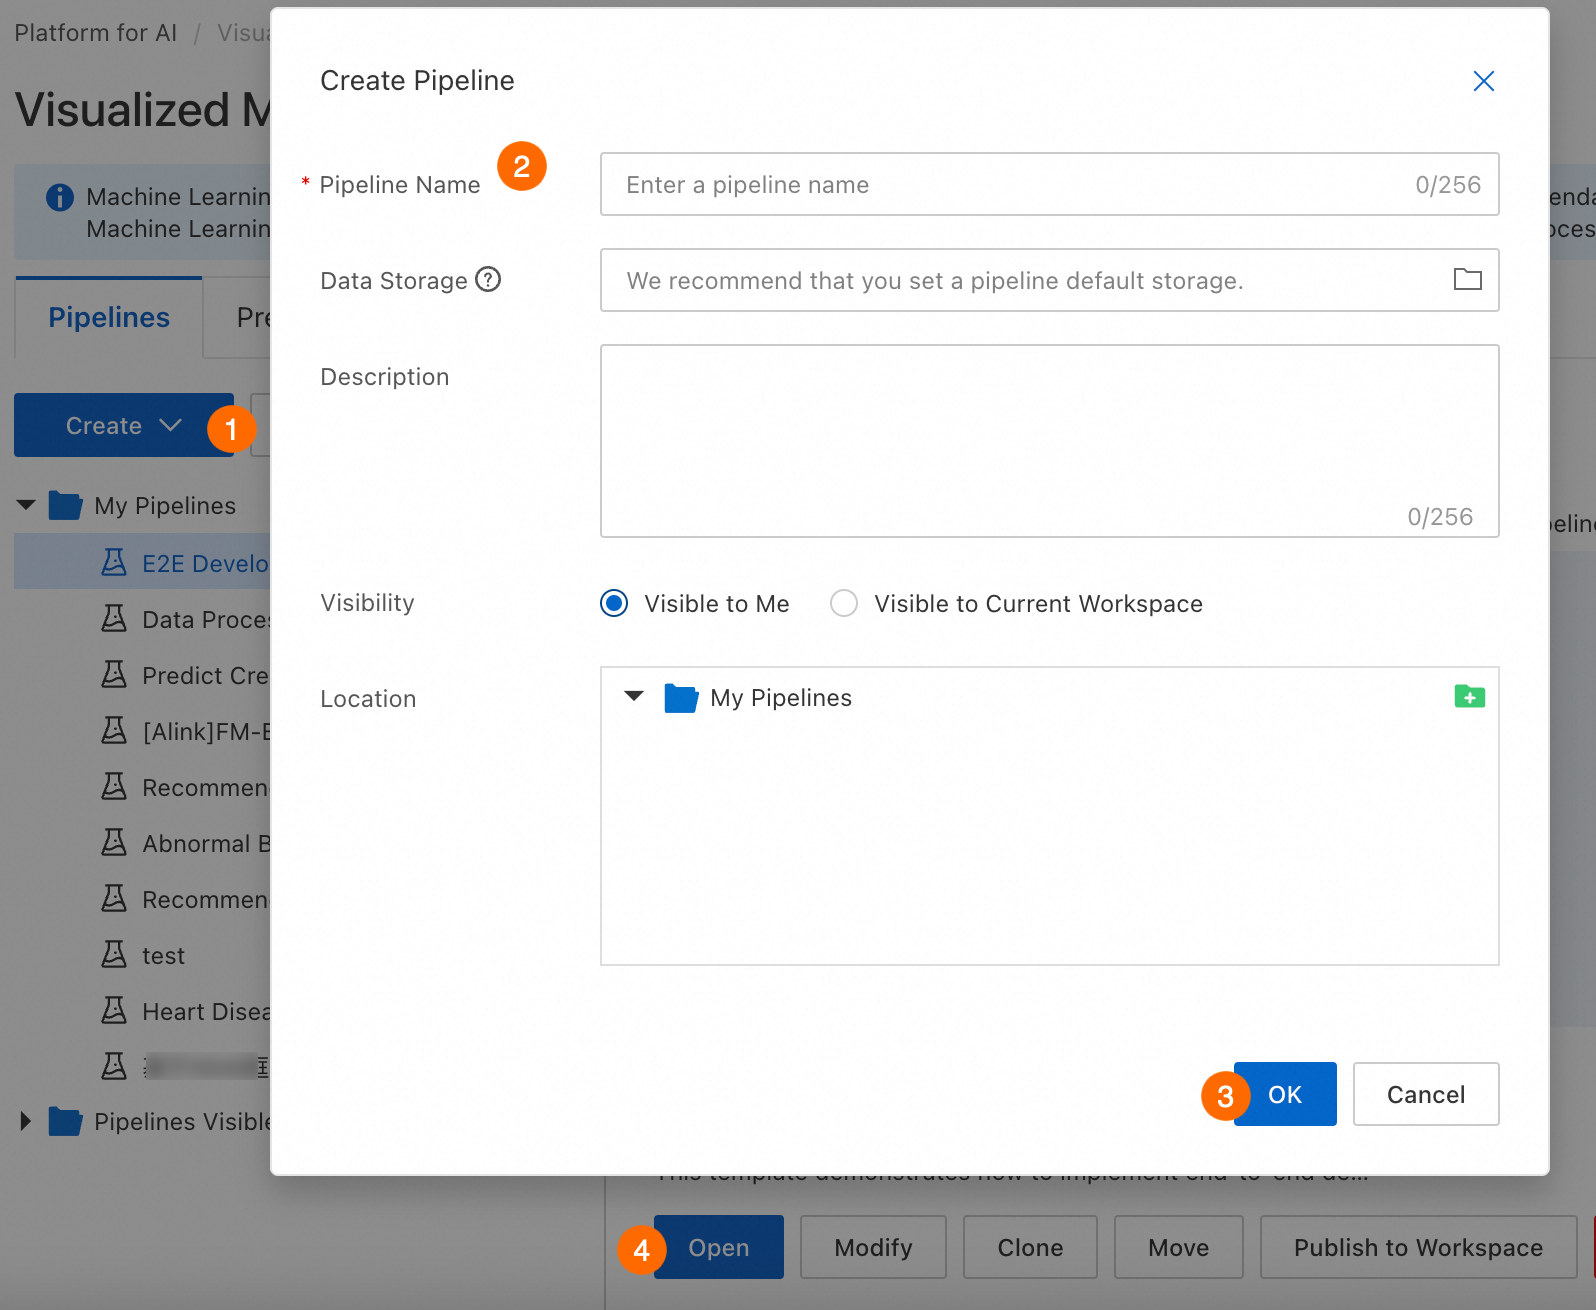
Navigate to Machine Learning Designer, select a workspace, and open Designer. Create and open a new pipeline.
|
Parameter |
Description |
|
Workflow name |
Custom workflow name. |
|
Workflow data storage |
OSS Bucket storage path for temporary data and models generated during runtime. If not configured, uses default workspace storage. For each run, Designer automatically creates a temporary folder at |
|
Visibility |
|
Step 2: Prepare and preprocess data
Prepare a data source and preprocess it to meet model input requirements.
Prepare data
Add Source/Target components to read data from sources such as MaxCompute and OSS. See Component Reference: Source/Target. This example uses the Read Data Table component to read public heart disease sample data. For dataset details, see Heart Disease Data Set.
-
Select a Data Source/Target component to read data.
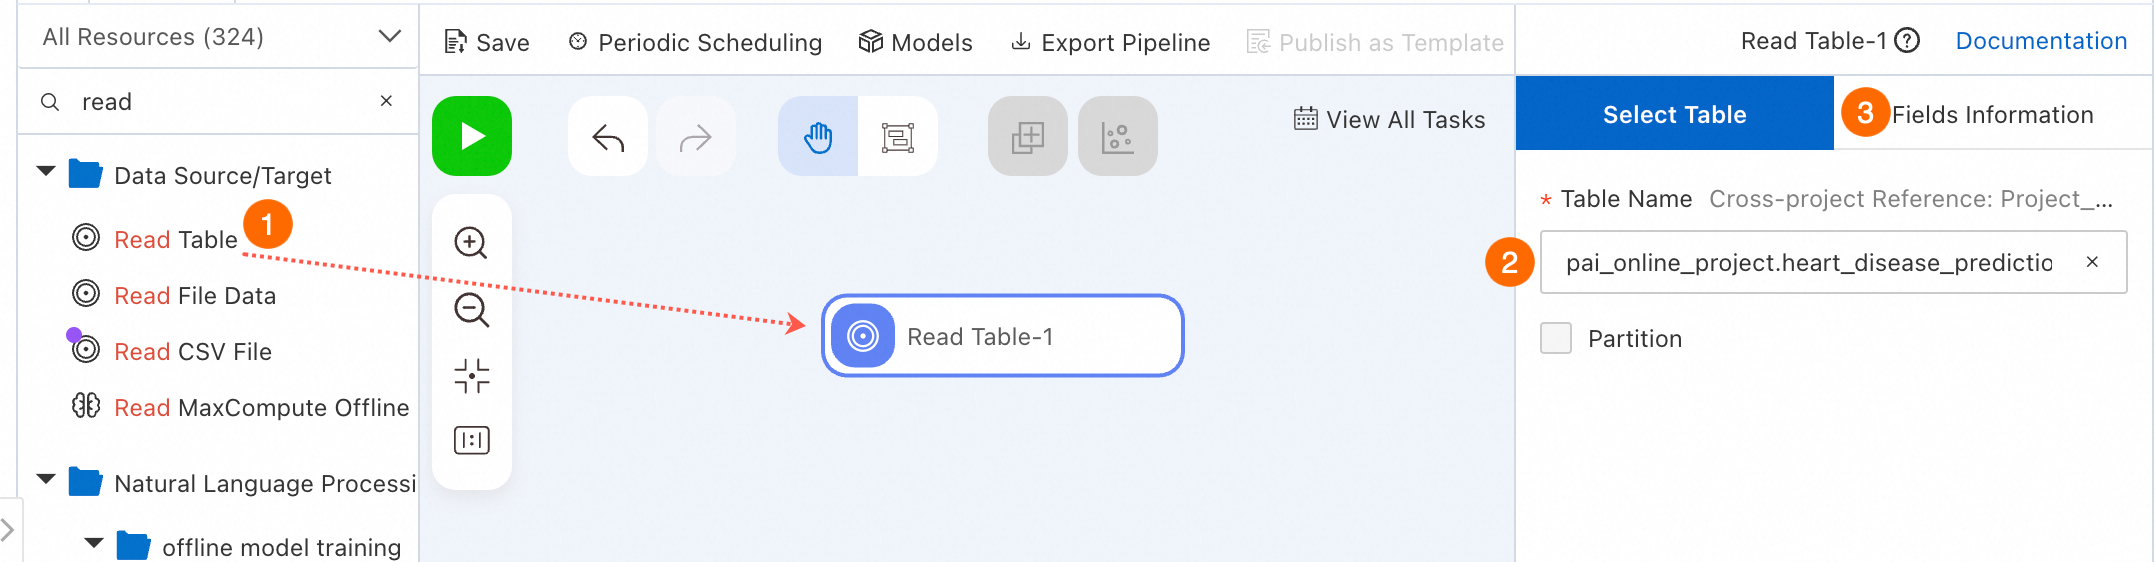
In the component list, click Data Source/Target. Drag Read Table onto the canvas to read MaxCompute table data. A pipeline node named Read Table-1 appears.
-
Configure the source table name.
Select Read Table-1 on the canvas. In Table Name on the right, enter the MaxCompute table name. Enter
pai_online_project.heart_disease_predictionto read the public heart disease data. -
Switch to the Fields Information tab to view field details.
Preprocess data
Heart disease prediction is a binary classification problem. The logistic regression component requires DOUBLE or BIGINT input. Convert and preprocess the data for model training.
-
Preprocess data: Convert non-numeric fields to numeric types.
-
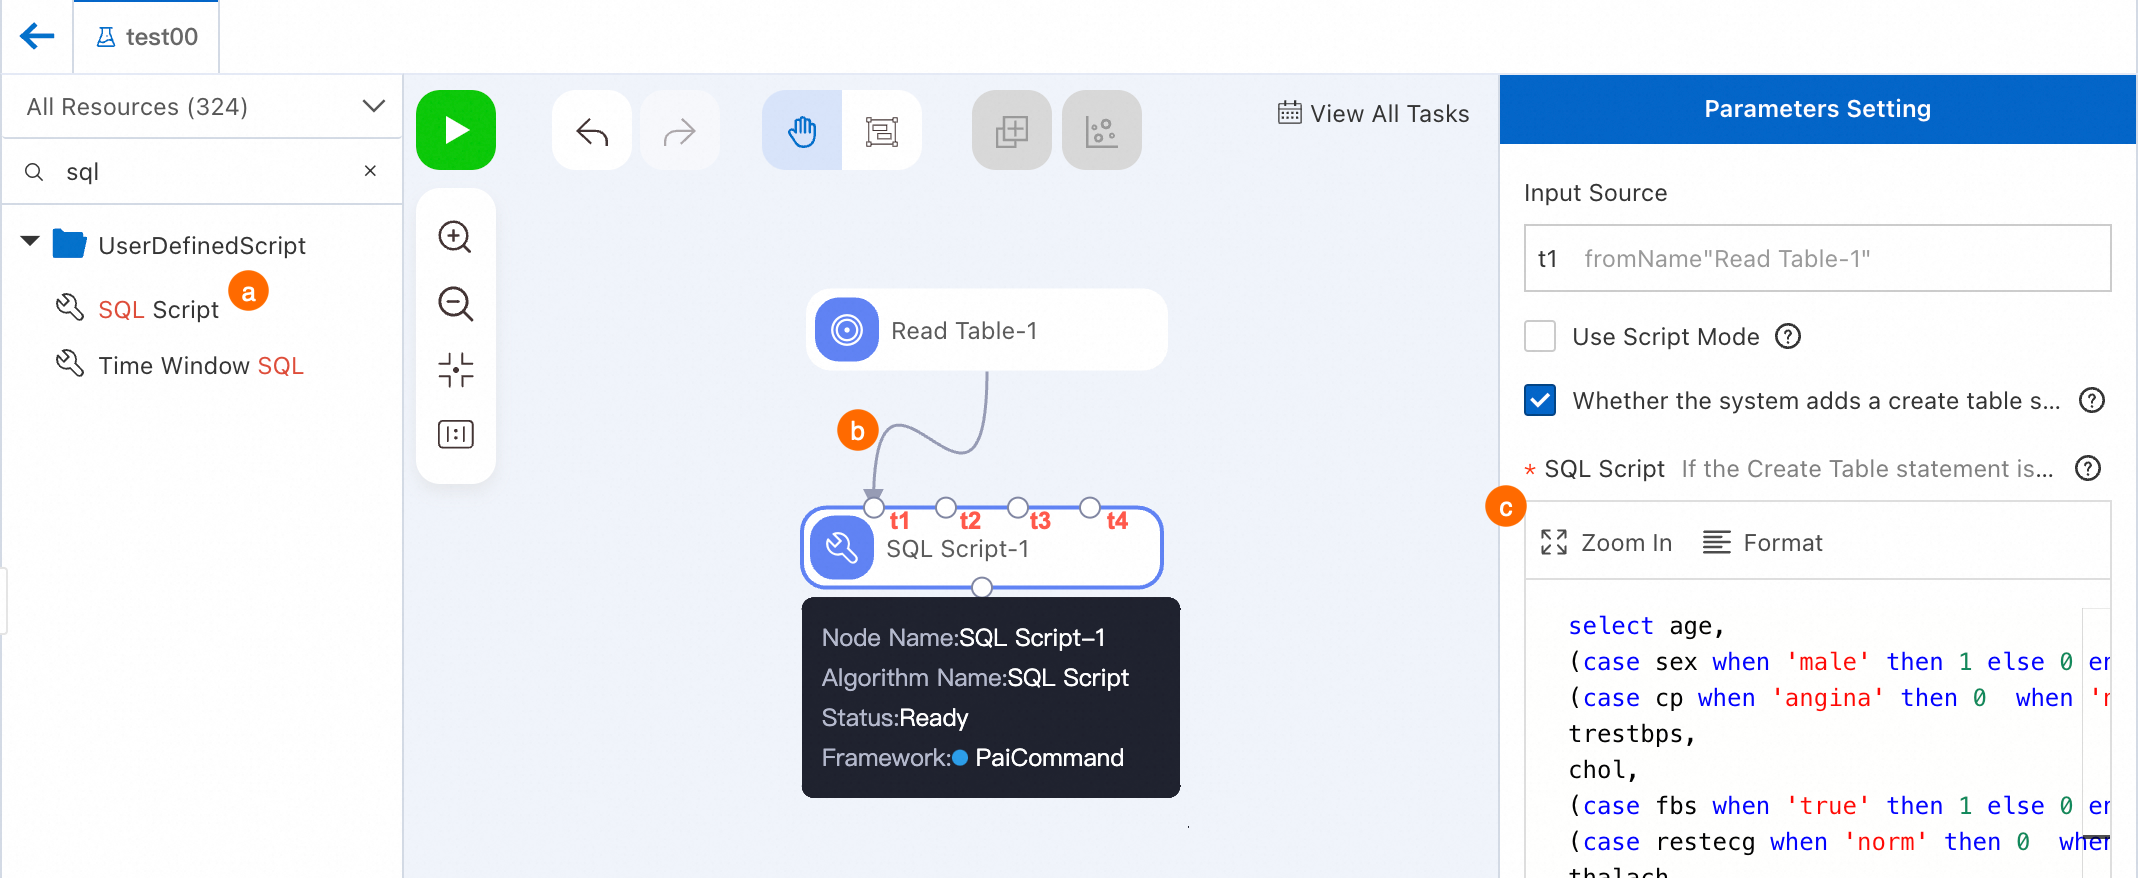
Search for SQL Script and drag it onto the canvas. A pipeline node named SQL Script-1 appears.
-
Connect Read Table-1 as the t1 input source for SQL Script-1.
-
Configure the node.
Click SQL Script-1. On the right, enter the following code. Input Source in Parameters Setting is `t1`.
select age, (case sex when 'male' then 1 else 0 end) as sex, (case cp when 'angina' then 0 when 'notang' then 1 else 2 end) as cp, trestbps, chol, (case fbs when 'true' then 1 else 0 end) as fbs, (case restecg when 'norm' then 0 when 'abn' then 1 else 2 end) as restecg, thalach, (case exang when 'true' then 1 else 0 end) as exang, oldpeak, (case slop when 'up' then 0 when 'flat' then 1 else 2 end) as slop, ca, (case thal when 'norm' then 0 when 'fix' then 1 else 2 end) as thal, (case status when 'sick' then 1 else 0 end) as ifHealth from ${t1}; -
Click Save in the upper-left to save the pipeline configuration.
-
Right-click SQL Script-1. Click Run from Root Node To Here to debug and run this pipeline.
The pipeline runs each node in order. When a node succeeds, a checkmark icon (
 ) appears in its upper-right corner.Note
Alternatively, click the
 (Run) icon in the upper-left to run the entire pipeline. For complex pipelines, run specific nodes to simplify debugging. If a run fails, right-click the node and select View Log to troubleshoot.
 -
After successful execution, right-click the target node (for example, SQL Script-1) and select to verify the output.
-
-
Convert fields to DOUBLE type to meet input requirements for logistic regression.
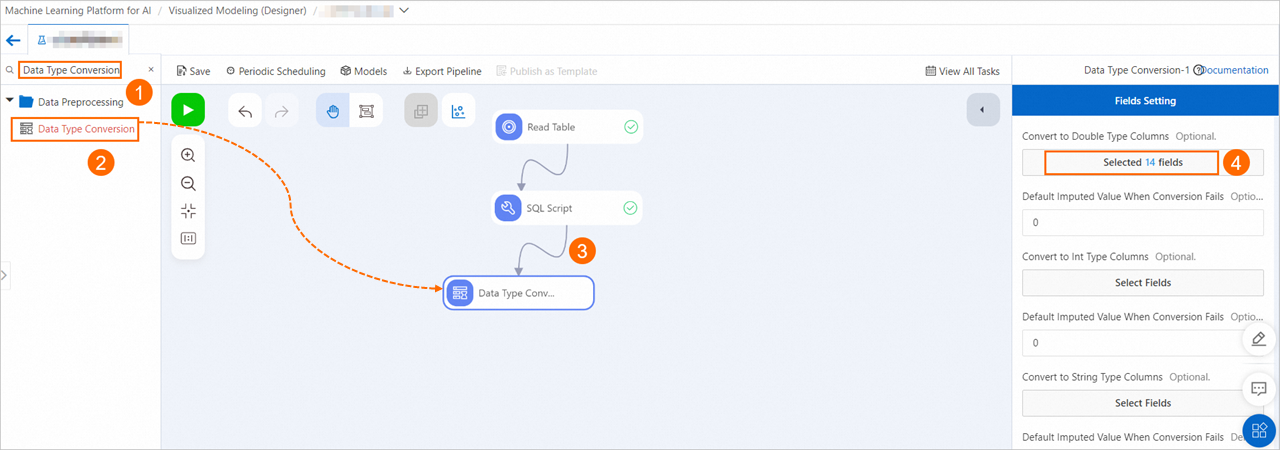
Drag Data Type Conversion and connect it as a descendant of SQL Script-1. Click the node. On Fields Setting, click Select Fields under Columns to convert to double type. Select all fields.
-
Normalize the data to convert each feature to 0–1 range, removing scale impact.
Drag Normalization and connect it as a descendant of Data Type Conversion-1. Click the node. On Fields Setting, select all fields.
-
Split data into training and prediction sets.
Drag Split and connect it as a descendant of Normalization-1. The split outputs two data tables.
Split divides data at a 4:1 ratio by default. Click Split and configure Split Ratio on Parameter Settings. For other parameters, see Split.
-
Right-click Data Type Conversion-1. Click Run from Here to run the remaining nodes.
Step 3: Train the model
Each sample is either sick or healthy, making this a binary classification problem. Use logistic regression to build the prediction model.
-
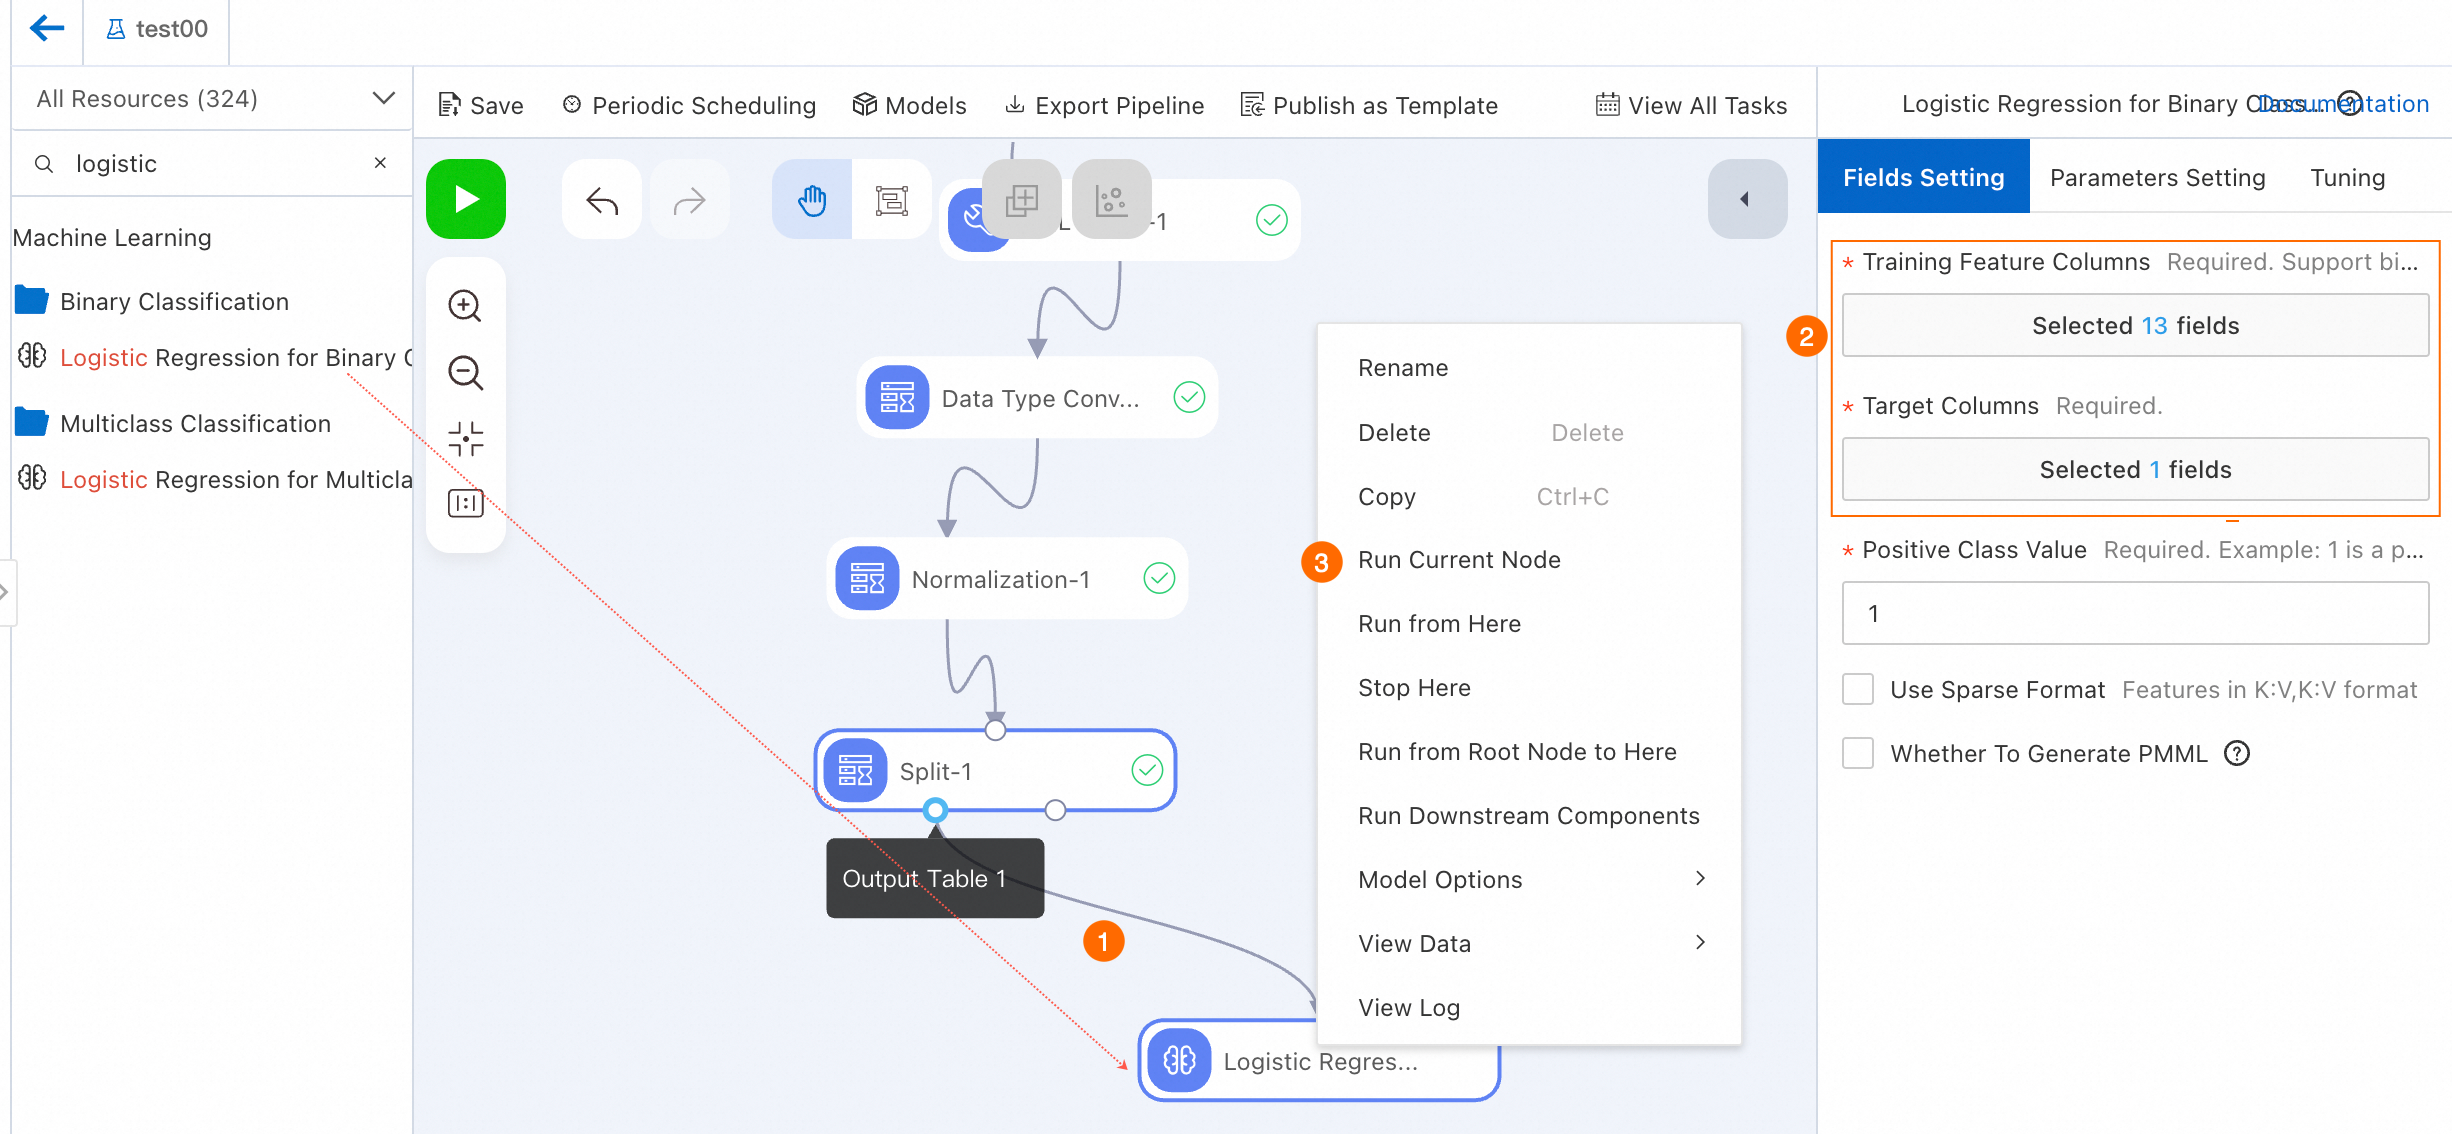
Drag Binary Logistic Regression and connect it as a descendant of Output Table 1 from Split-1.
-
Configure the node.
Click Binary Logistic Regression-1. On Fields Setting, set Target Column to ifhealth and Training Feature Columns to all other columns. See Binary Logistic Regression.
NoteTo complete Step 6: Deploy the model (optional), select Logistic Regression Binary Classification and check Generate PMML on the Fields setting tab.
-
Run the node.
Step 4: Run model prediction
-
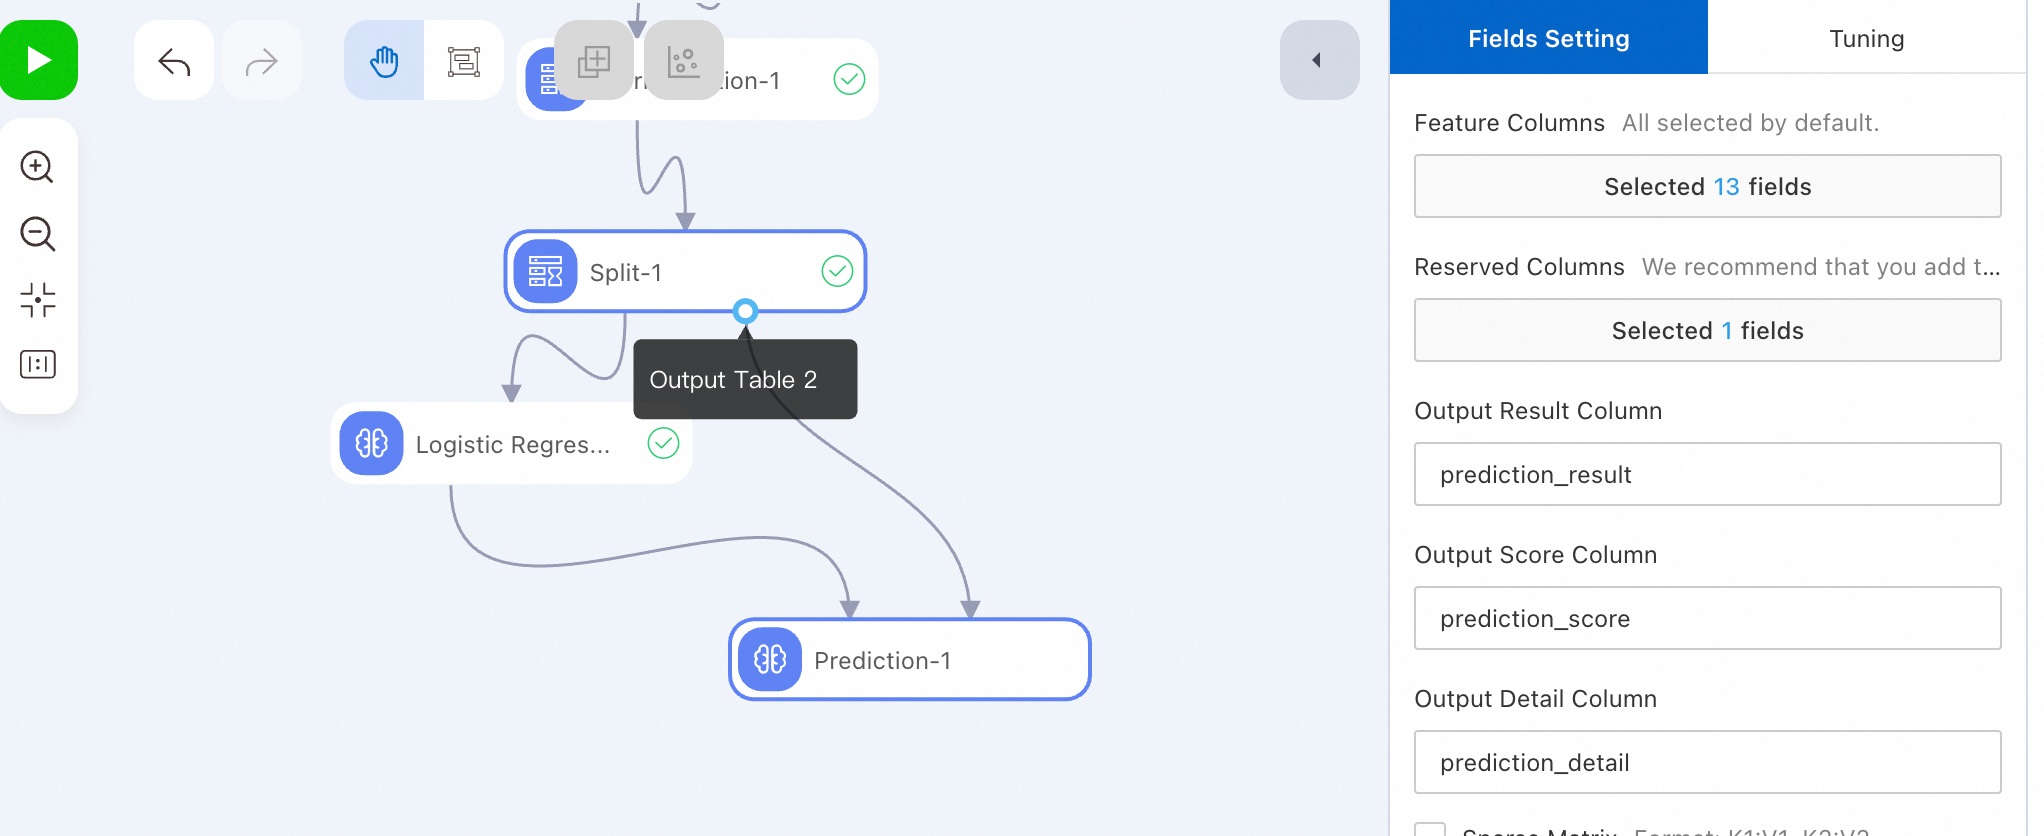
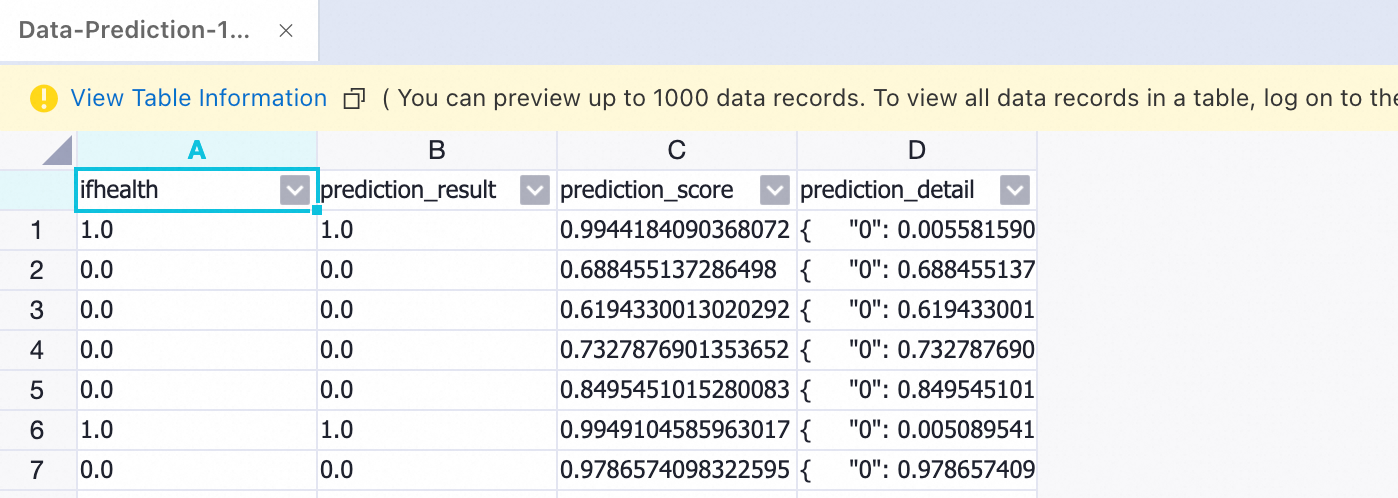
Run the prediction node and view results.
After a successful run, right-click the prediction node. Select View Data > Prediction Result Output Port.
Step 5: Evaluate the model
-
Drag Binary Classification Evaluation and connect it as a descendant of Prediction-1.
-
Click Binary Classification Evaluation-1. On Fields Setting, set Original Label Column to ifhealth.
-
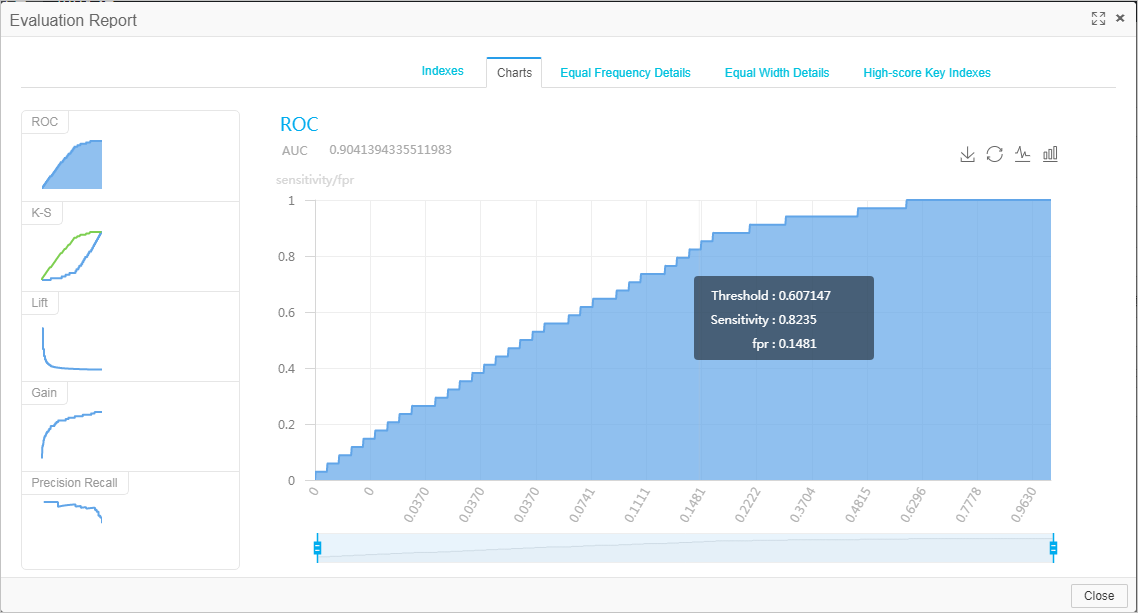
Run the evaluation node and view results.
After the run finishes, right-click Binary Classification Evaluation. Select Visual Analysis to view evaluation metrics.
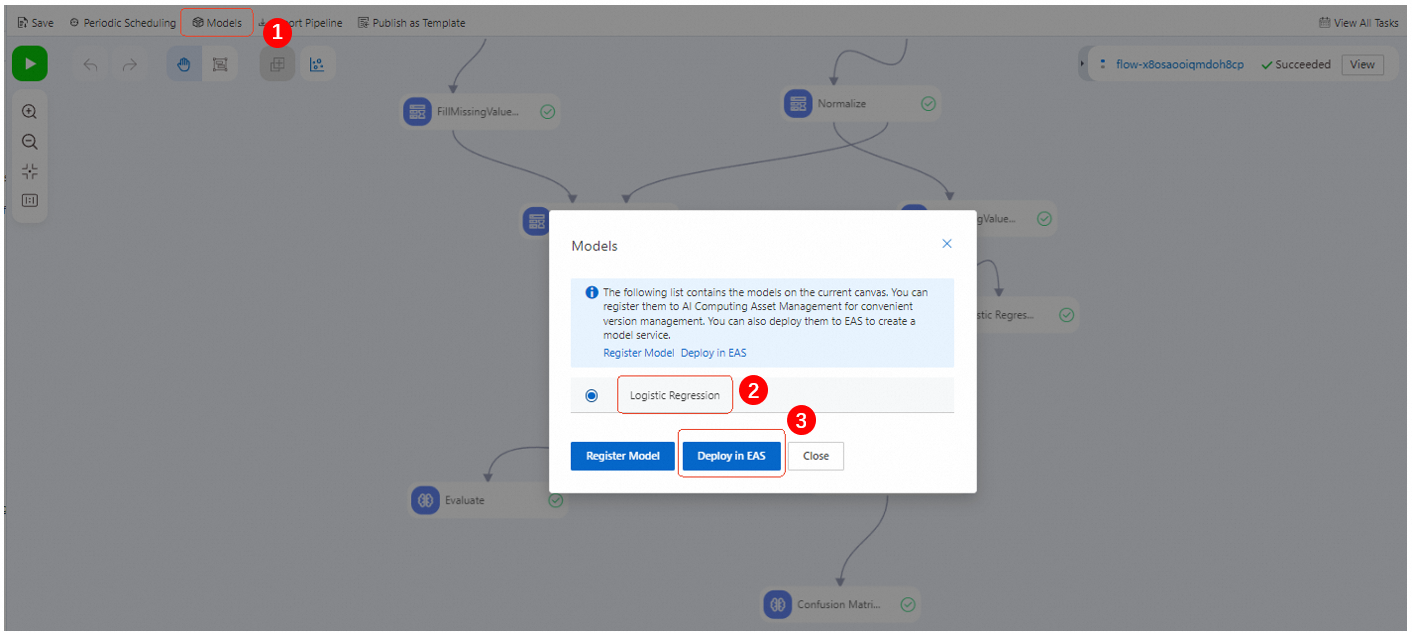
Step 6: Deploy the model (optional)
Designer and EAS integrate seamlessly. After offline training, prediction, and evaluation, deploy a single model to EAS to create an online service.
-
After the pipeline runs successfully, click Model List. Select the model to deploy and click Deploy to EAS.
-
Confirm configuration parameters. See deploy a model as an online service.
On the EAS deployment page, Model File and Processor Type are configured by default. Configure other parameters as needed.
-
Click Deploy.
When Service Status changes from Creating to Running, deployment is complete.
ImportantIf no longer using the deployed model, click Stop in Operation to avoid unnecessary costs.
References
-
Designer provides rich pipeline templates to quickly build models. See Template Workflows.
-
Use DataWorks to perform offline scheduling for offline pipelines and periodically update models. See Using DataWorks to perform offline scheduling for Designer workflows.
-
Configure global variables in pipelines for both online pipelines and DataWorks offline scheduling to improve flexibility. See Global variables.