Build and debug models using pipelines in Machine Learning Designer. This example uses a heart disease prediction model.
Prerequisites
Create a pipeline. For more information, see Create a workflow.
Build a model
A model is composed of multiple node (component) tasks. Orchestrate node tasks using pipelines to build a model based on your business requirements. Before building a model, split the model and plan node tasks. Use one node for each simple task. The following section describes the process of building a model:
-
On the pipeline details page, find the desired components in the left-side component list and drag them to the canvas.
In the component list, Alink components have a purple mark, such as the Read CSV File component in the following figure. Alink components can function as standalone units and be aggregated into groups. Configuring resources for the groups enhances execution efficiency and resource utilization. For more information, see Alink components.
-
On the right side of the page, click the desired node and configure the component parameters.
-
Draw lines between nodes to form upstream and downstream relationships. This process creates a pipeline.
Each node has one or more input or output ports. Move the pointer over the ports of a component to view the data types of the ports and draw lines between the components based on the data types of the ports.
When running the pipeline, nodes execute in order. Downstream nodes run only after all upstream nodes complete.
In most cases, a model includes the following modules:
Read data
Add a data source or destination component to a pipeline to read data from MaxCompute tables or Object Storage Service (OSS) buckets. For more information, see Component reference: Data source and destination. In this example, MaxCompute data is used as the data source.
-
Create a MaxCompute table and import data into it. For more information, see Create and manage MaxCompute tables.
In this example, a heartdisease table is created in test project and test data is imported.
-- Create a table. CREATE TABLE IF NOT EXISTS heartdisease( age STRING COMMENT 'The age of the patient. ', sex STRING COMMENT 'The gender of the patient. Valid values: female and male. ', cp STRING COMMENT 'The type of chest pain of the patient. Valid values: typical, atypical, non-anginal, and asymptomatic. ', trestbps STRING COMMENT 'The resting blood pressure level of the patient. ', chol STRING COMMENT 'The serum cholesterol level of the patient. ', fbs STRING COMMENT 'The fasting blood sugar level of the patient. If the fasting blood sugar level is greater than 120 mg/dl, the value is set to true. Otherwise, the value is set to false. ', restecg STRING COMMENT 'The resting electrocardiogram (ECG) result of the patient. Valid values: norm and hyp. ', thalach STRING COMMENT ‘The maximum number of heartbeats. ', exang STRING COMMENT ’Specifies whether the patient has exercise-induced angina. Valid values: true and false. ', oldpeak STRING COMMENT 'The ST depression that is induced by exercise relative to rest. ', slop STRING COMMENT 'The slope of the peak exercise ST segment. Valid values: down, flat, and up. ', ca STRING COMMENT 'The number of major vessels that are colored by using fluoroscopy. ', thal STRING COMMENT 'The type of defect of the patient. Valid values: norm, fix, and rev. ', `status` STRING COMMENT 'The presence of heart disease in the patient. Valid values: buff (healthy) and sick (unhealthy). ', style STRING); -- This is only an example. You can directly import public test data from PAI. INSERT INTO heartdisease select * from pai_online_project.heart_disease_prediction; -
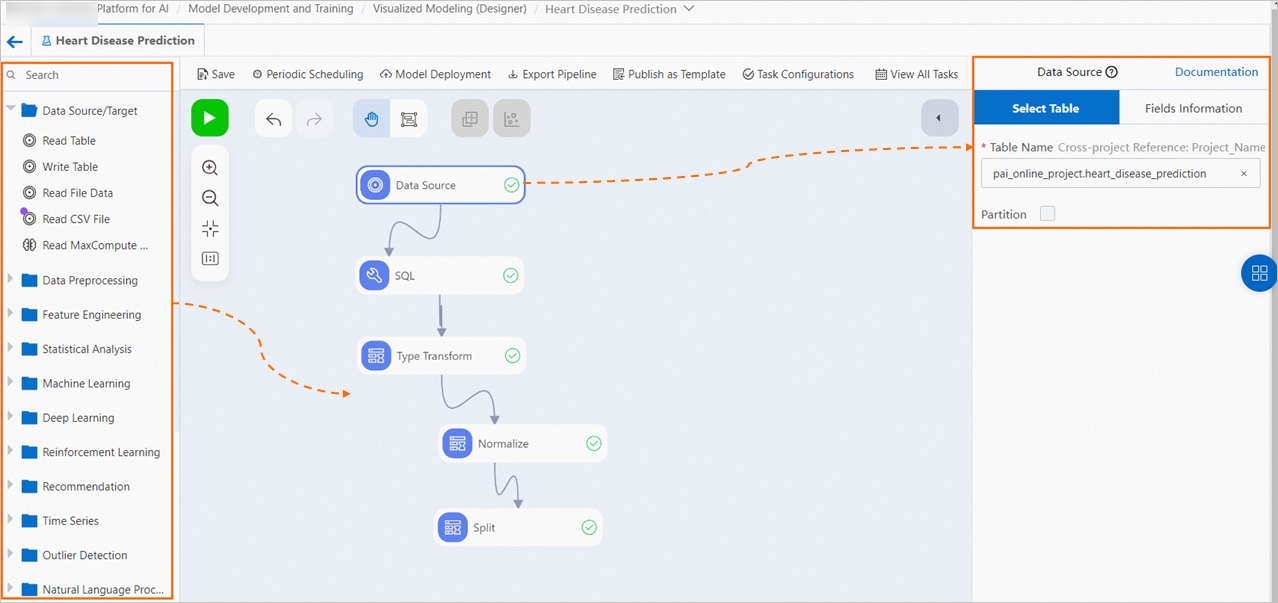
Drag the Read Table component to the canvas on the right to read data from a MaxCompute table.
A node named Read Table-1 is automatically generated on the canvas. Numbers in the name follow the order in which the same components are dragged to the canvas.
-
On the node configuration page, specify a name for the source table. For more information, see Read table.
On the canvas, click the Read Table-1 component. On the right-side node configuration page, specify a name for the MaxCompute table in the Table Name field. In this example, enter
heartdisease.NoteTo read data from a table across MaxCompute projects, enter the table name in the
Project name.Table nameformat. Example: as test2.heartdisease. Ensure that you have project permissions. -
On the right side of the canvas, click the Fields Information tab to view details of columns in the public data.
Preprocess data
After reading data, preprocess it to meet the input requirements for model training or prediction. Machine Learning Designer provides various data preprocessing and large model data preprocessing components.
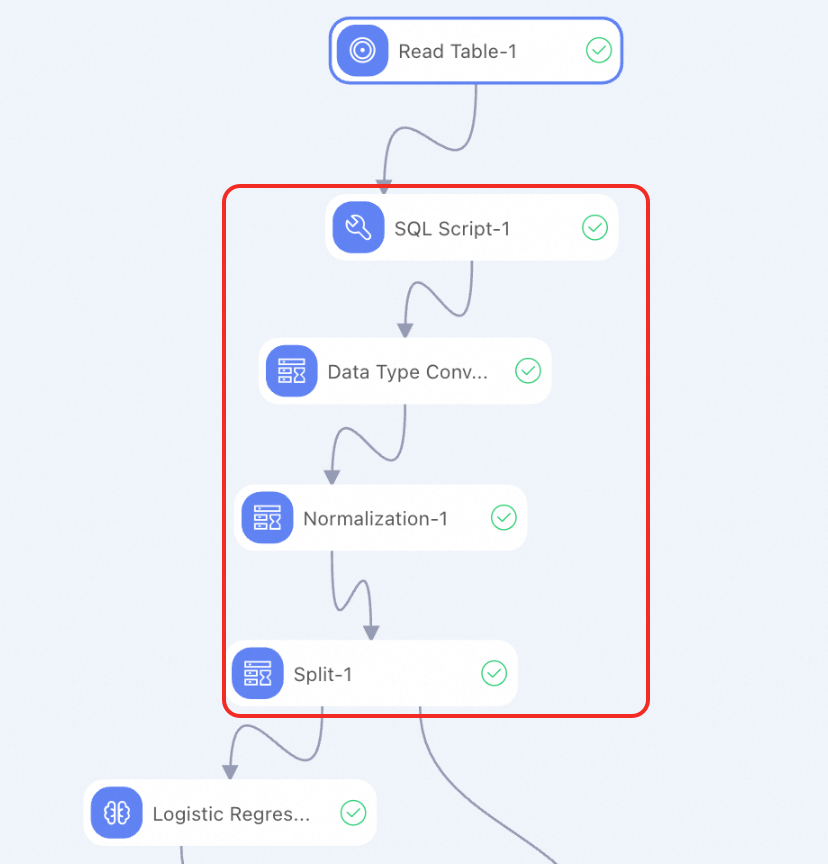
Alternatively, use the SQL script component to prepare a custom SQL script that implements features. The following script shows how to convert data types for input features:
select age,
(case sex when 'male' then 1 else 0 end) as sex,
(case cp when 'angina' then 0  when 'notang' then 1 else 2 end) as cp,
trestbps,
chol,
(case fbs when 'true' then 1 else 0 end) as fbs,
(case restecg when 'norm' then 0  when 'abn' then 1 else 2 end) as restecg,
thalach,
(case exang when 'true' then 1 else 0 end) as exang,
oldpeak,
(case slop when 'up' then 0  when 'flat' then 1 else 2 end) as slop,
ca,
(case thal when 'norm' then 0  when 'fix' then 1 else 2 end) as thal,
(case status  when 'sick' then 1 else 0 end) as ifHealth
from  ${t1};
Train a model
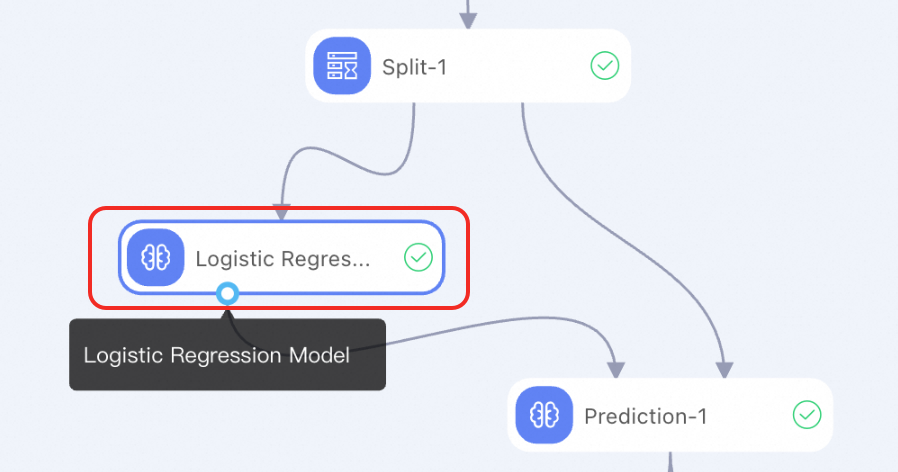
A model component receives preprocessed data upstream and connects components, such as prediction or inference components, downstream. A model component may have one or more input or output ports. Move the pointer over component ports to view port data types and draw lines between components based on data types.
In this example, the Logistic regression for binary classification component is used. This component has two output ports.
-
Logistic regression model: Use the output port of a trained model as the model result input of prediction components.
-
PMML: Model deployment relies on Predictive Model Markup Language (PMML) models. For example, to deploy a model generated using a built-in processor such as a PMML processor, select Whether To Generate PMML in the parameter configurations of a model component before running the component.
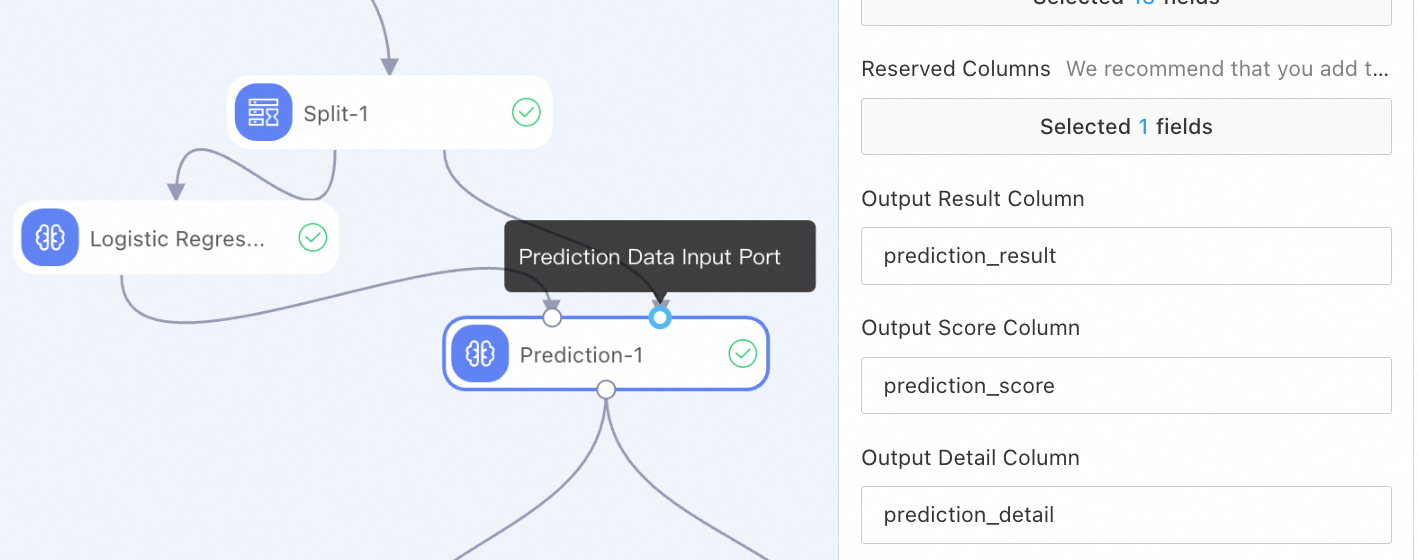
Perform model prediction or inference
After training a model, connect prediction or inference components to test model performance.
In this example, a prediction component is used. The prediction component has two input ports.
-
Model result input: Use a trained model as input.
-
Prediction data input: Use preprocessed test data as input.
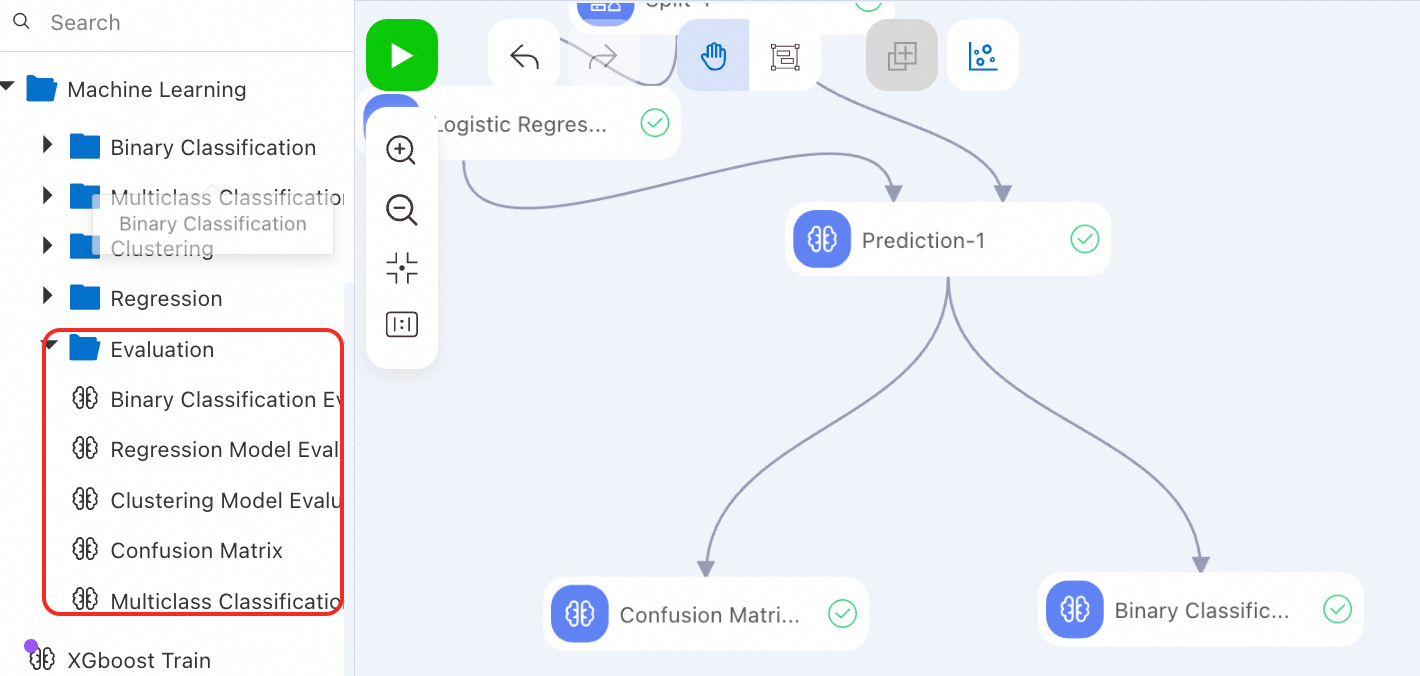
Evaluate a model
Specific models provide evaluation components. Use the corresponding evaluation components to analyze model performance using related metrics.
For example, Machine Learning provides the following evaluation components, which can be used as downstream components of prediction components:
Debug a model
Debug running
-
Pipeline: Click the
 icon in the upper-left corner of the canvas to directly run a pipeline. If a pipeline is complex, run one or more nodes by module to facilitate debugging.
 -
Single or multiple components: Right-click the desired component to run one or more components. Multiple running methods are supported.
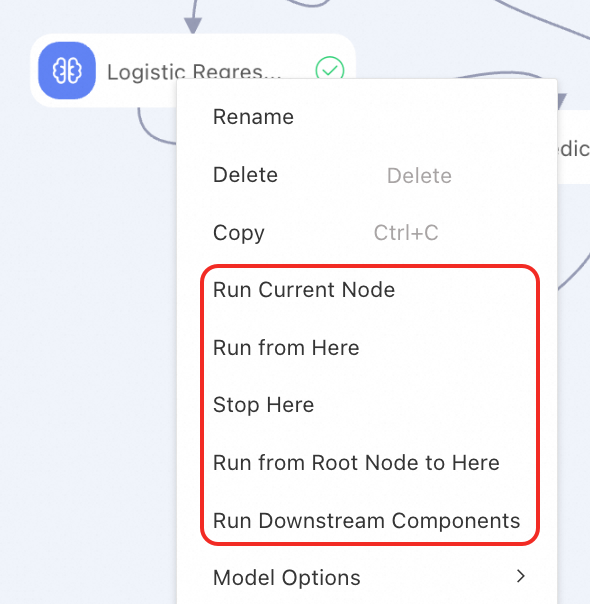
If a component runs as expected, the ![]() icon appears. If the component fails to run, the
icon appears. If the component fails to run, the ![]() icon appears. Right-click the component to view logs and results.
icon appears. Right-click the component to view logs and results.
View logs and results
-
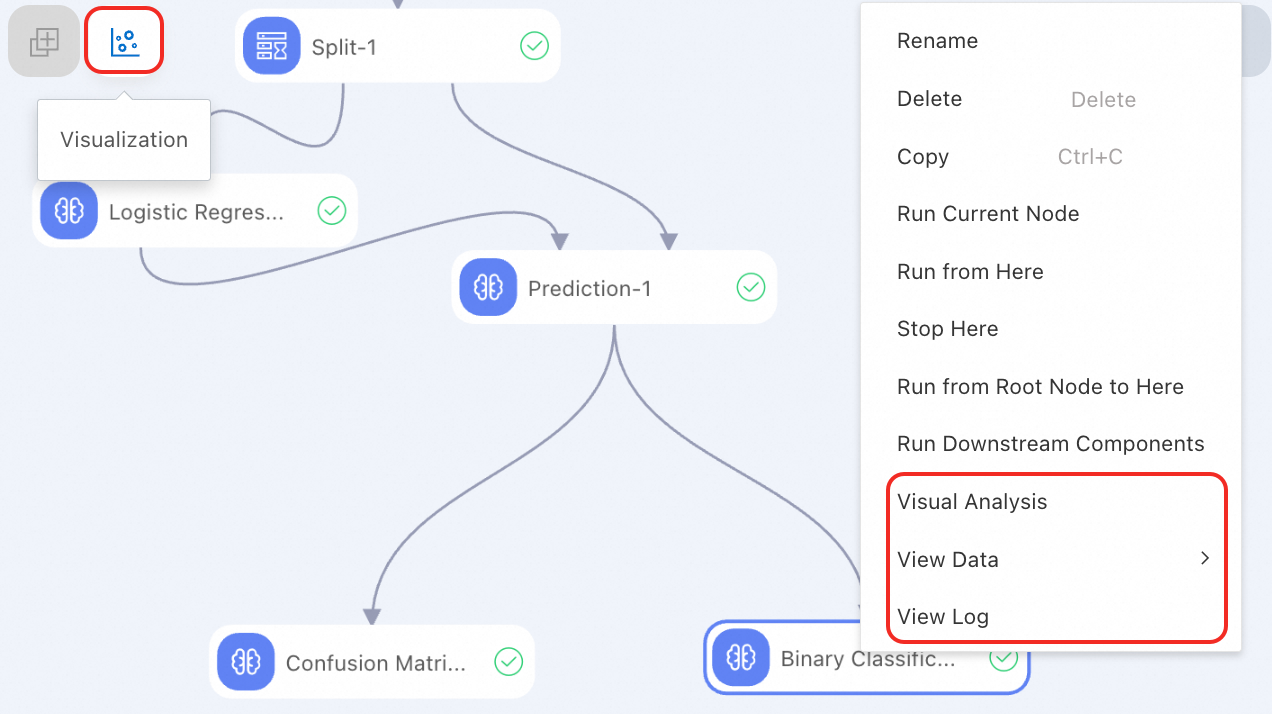
View data and visualize analysis:
After a component runs, right-click it and select View Data to view generated data.
For specific components, Machine Learning Designer allows converting data into graphs and charts to display complex data and analysis results in an intuitive manner. This helps quickly obtain key information and identify trends and patterns for more efficient analysis and decision-making. To analyze data visually, right-click a component and select Visual Analysis or click the visualization icon in the upper part of the canvas. For more information, see Visualization analysis.
-
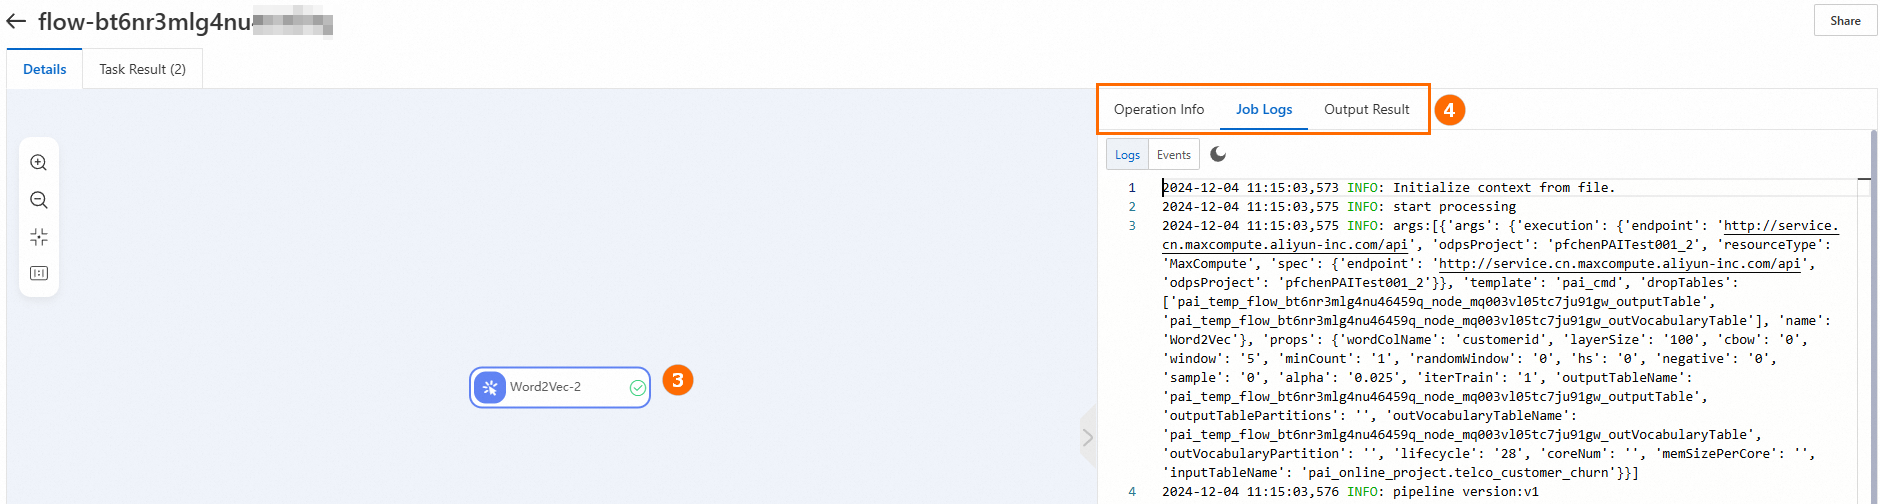
View logs: If a component fails to run, right-click it and select View Log to troubleshoot the failure.
View running tasks
In the upper-right corner of the canvas, click View All Tasks to view running details of all historical tasks. Each run is recorded as a historical task during modeling. Each historical task records involved nodes, node configurations, and generated data.
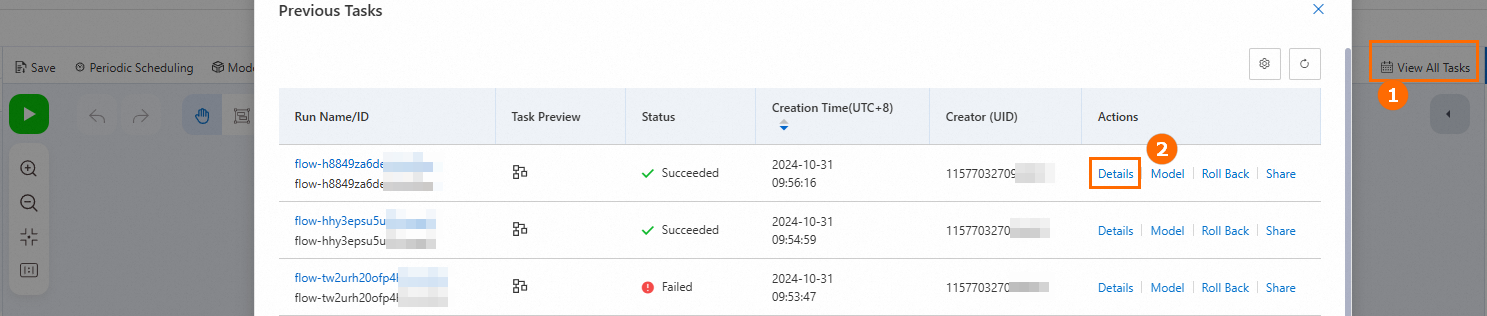
Before rolling back a version, view the details of the historical task and check whether the version is correct. Save and run the model pipeline before performing a rollback. This generates a task record that contains the latest status. If an exception occurs during rollback, roll back the model pipeline to the latest status.
Reference
-
After debugging a model, register the trained model as a new model and manage it. For more information, see Register and manage models.
-
After debugging a model, deploy it and perform online model prediction. For more information, see Model prediction and deployment.
-
After deploying a model service, use the Update EAS Service (Beta) component provided by Machine Learning Designer to update the model service on a regular basis. For more information, see Periodically update online model services.
-
DataWorks allows you to schedule offline workflows and periodically update models. For more information, see Schedule pipelines with DataWorks.
-
For information about other components, see Designer components overview.
-
For information about the billing of Machine Learning Designer, see Billing of Machine Learning Designer.