Trace analysis derives its value from connection. A trace forms a topology graph that links user clients, gateways, backend applications, and dependent components such as databases, message queues, and large language models. The broader the coverage, the more valuable tracing becomes. End-to-end tracing covers all associated IT systems to record the complete call paths and states of user requests across these systems.
Alibaba Cloud end-to-end tracing solution
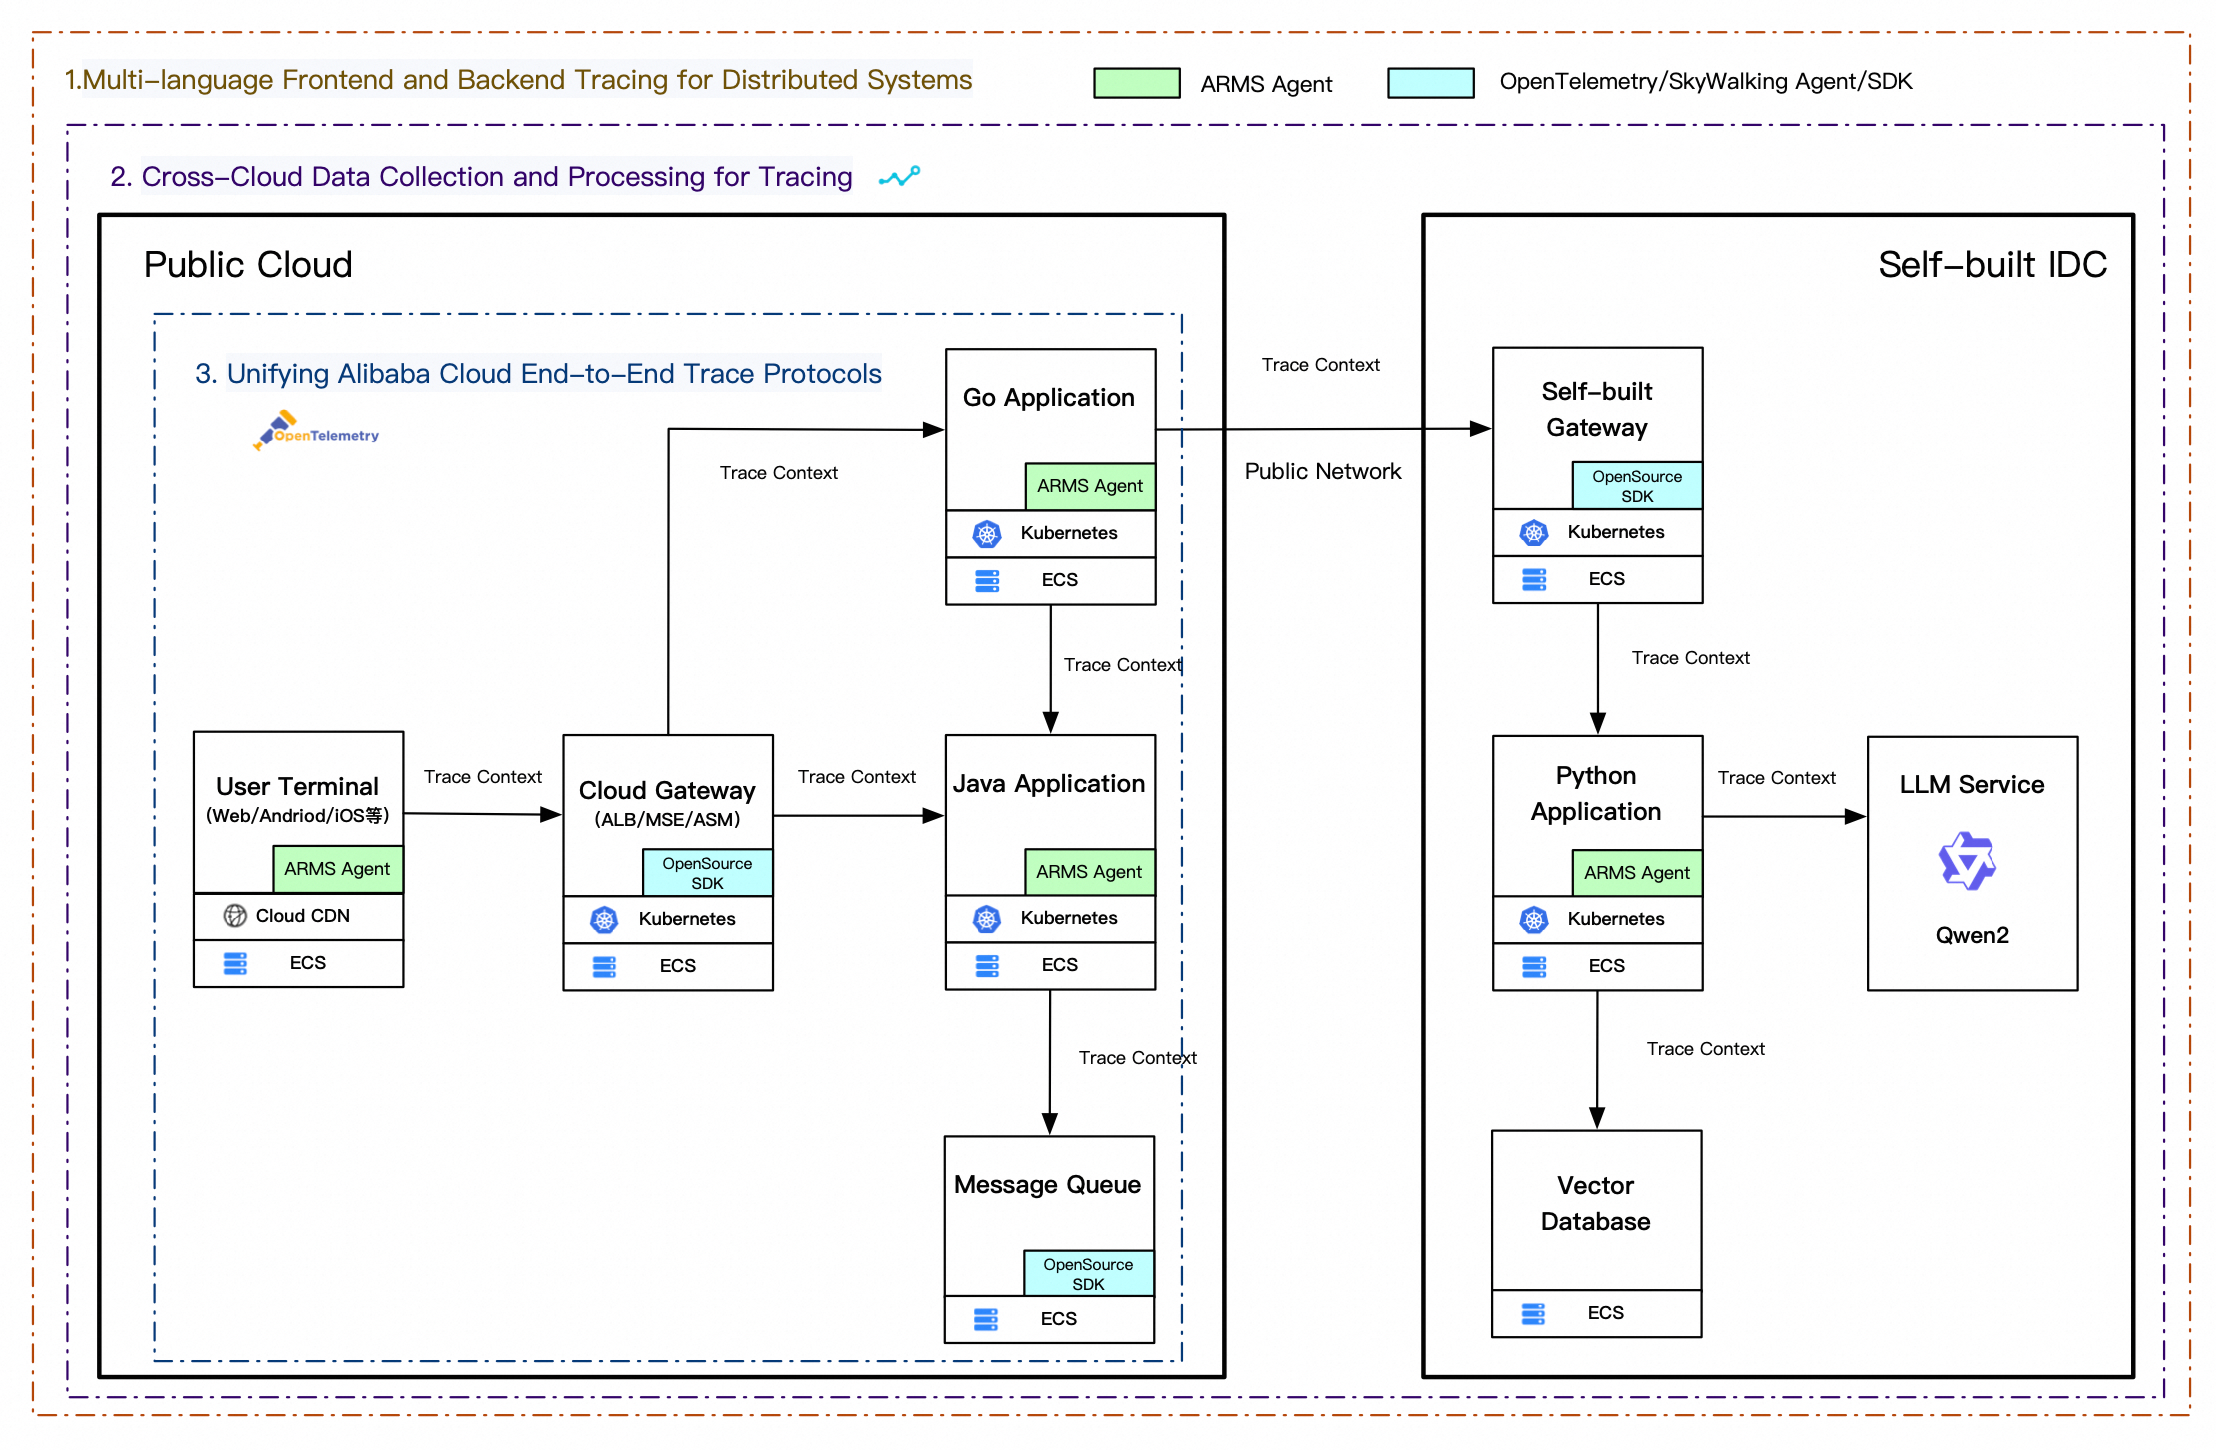
Alibaba Cloud ARMS, including Managed Service for OpenTelemetry, supports end-to-end tracing across user clients (such as Web, Android, and iOS), cloud gateways (such as ALB, MSE, Ingress, and ASM), backend applications (such as Java, Go, Python, and .NET), and cloud components (such as databases, message queues, and large language models), as shown in the following figure.
Trace instrumentation: ARMS agents for mainstream languages and open source for multi-language coverage
For mainstream languages such as Java, Go, and Python, you can use the proprietary ARMS agents, which deliver higher trace quality, better performance, stronger stability, and improved usability. To support more languages, Managed Service for OpenTelemetry is fully compatible with four major tracing frameworks: OpenTelemetry, SkyWalking, Zipkin, and Jaeger. The service also supports trace instrumentation and data reporting for over 10 languages, as shown in the following table.
Data is fully interoperable between ARMS and Managed Service for OpenTelemetry. You can use them together in multi-language scenarios.
|
Programming language |
ARMS Application Monitoring (Proprietary agent, SLA guaranteed) |
Managed Service for OpenTelemetry (Open source client, self-managed) |
Recommended connection type |
|
Java |
Automatic instrumentation |
Automatic instrumentation |
ARMS |
|
Go |
Automatic instrumentation |
Automatic instrumentation |
ARMS |
|
Python |
Automatic instrumentation |
Automatic instrumentation |
ARMS |
|
Node.js |
Not supported |
Automatic instrumentation |
OpenTelemetry |
|
.NET |
Not supported |
Automatic instrumentation |
OpenTelemetry |
|
PHP |
Not supported |
Automatic instrumentation |
OpenTelemetry |
|
Erlang |
Not supported |
Automatic instrumentation |
OpenTelemetry |
|
C++ |
Not supported |
Manual instrumentation |
OpenTelemetry |
|
Swift |
Not supported |
Manual instrumentation |
OpenTelemetry |
|
Ruby |
Not supported |
Manual instrumentation |
OpenTelemetry |
|
Rust |
Not supported |
Manual instrumentation |
SkyWalking |
ARMS released JavaAgent 4.0 in 2024, fully embracing the OpenTelemetry ecosystem. The agent's core is built on the OpenTelemetry framework and provides additional data for resource monitoring, performance diagnostics, and application security. Beyond richer data, ARMS JavaAgent 4.0 supports advanced features such as flexible trace sampling policies, GUI-based agent management, comprehensive self-monitoring, and dynamic feature degradation, making it ideal for enterprise production environments.
Trace collection and processing: Deep integration with the Alibaba Cloud ecosystem for one-click trace access
A common pain point during cloud migration is maintaining service availability across complex dependencies. End-to-end tracing addresses this by quickly locating nodes that cause slow or incorrect requests, improving fault recovery speed and reducing business impact. So, how can you ingest trace data from cloud products?
Managed Service for OpenTelemetry is closely integrated with nearly 10 Alibaba Cloud products, enabling internal trace instrumentation and data reporting. You can enable the tracing switch in the console of a supported cloud product to view the corresponding trace data, which greatly simplifies data collection. The following figure shows how to enable tracing for ALB Gateway, MSE Gateway, and ARMS Real User Monitoring.

Due to different product features, trace instrumentation methods vary. The corresponding data collection methods fall into two main categories:
-
Direct or forwarded trace reporting: For example, Real User Monitoring uses internal instrumentation and reports data directly through an Exporter. This allows for more detailed and flexible instrumentation.
-
Log-to-trace conversion: For example, ALB Gateway consumes access logs on the backend and converts them into trace data. This method is less intrusive.
Both methods have trade-offs. Direct or forwarded trace reporting is generally recommended as the more standard approach. However, for high-performance scenarios or when modifying legacy systems is difficult, log-to-trace conversion is an alternative. This requires adding trace context, such as a TraceId, to the logs.
The following table lists the cloud products, protocols, and connection guides that currently support tracing.
|
Connection category |
Client |
Connection guide |
Supported protocols |
|
User client |
Web/H5/Mini program |
w3c, b3, jaeger, skywalking |
|
|
Android/iOS |
w3c, skywalking |
||
|
Gateway |
MSE |
w3c, b3, skywalking |
|
|
ACK Ingress |
Implement tracing for the Nginx Ingress Controller component |
w3c, b3, jaeger |
|
|
ALB |
b3 |
||
|
ASM |
b3 |
||
|
API Gateway |
b3 |
||
|
Backend application |
Java/Go/Python (Proprietary) |
w3c, b3, jaeger, skywalking, eagle eye |
|
|
.NET, Node.js, and other languages (Open source) |
w3c, b3, jaeger, skywalking |
||
|
Dependent components |
Support for 100+ plugins, covering various types such as RPC, message queues, databases, and task scheduling. |
||
Trace context pass-through: Unify protocols and use ARMS agents for multi-protocol conversion
For a single application component, successful instrumentation means you can collect and view its trace data in the console. However, true end-to-end tracing requires connecting upstream and downstream traces with a unified protocol to ensure an unbroken chain, which presents both technical and coordination challenges.
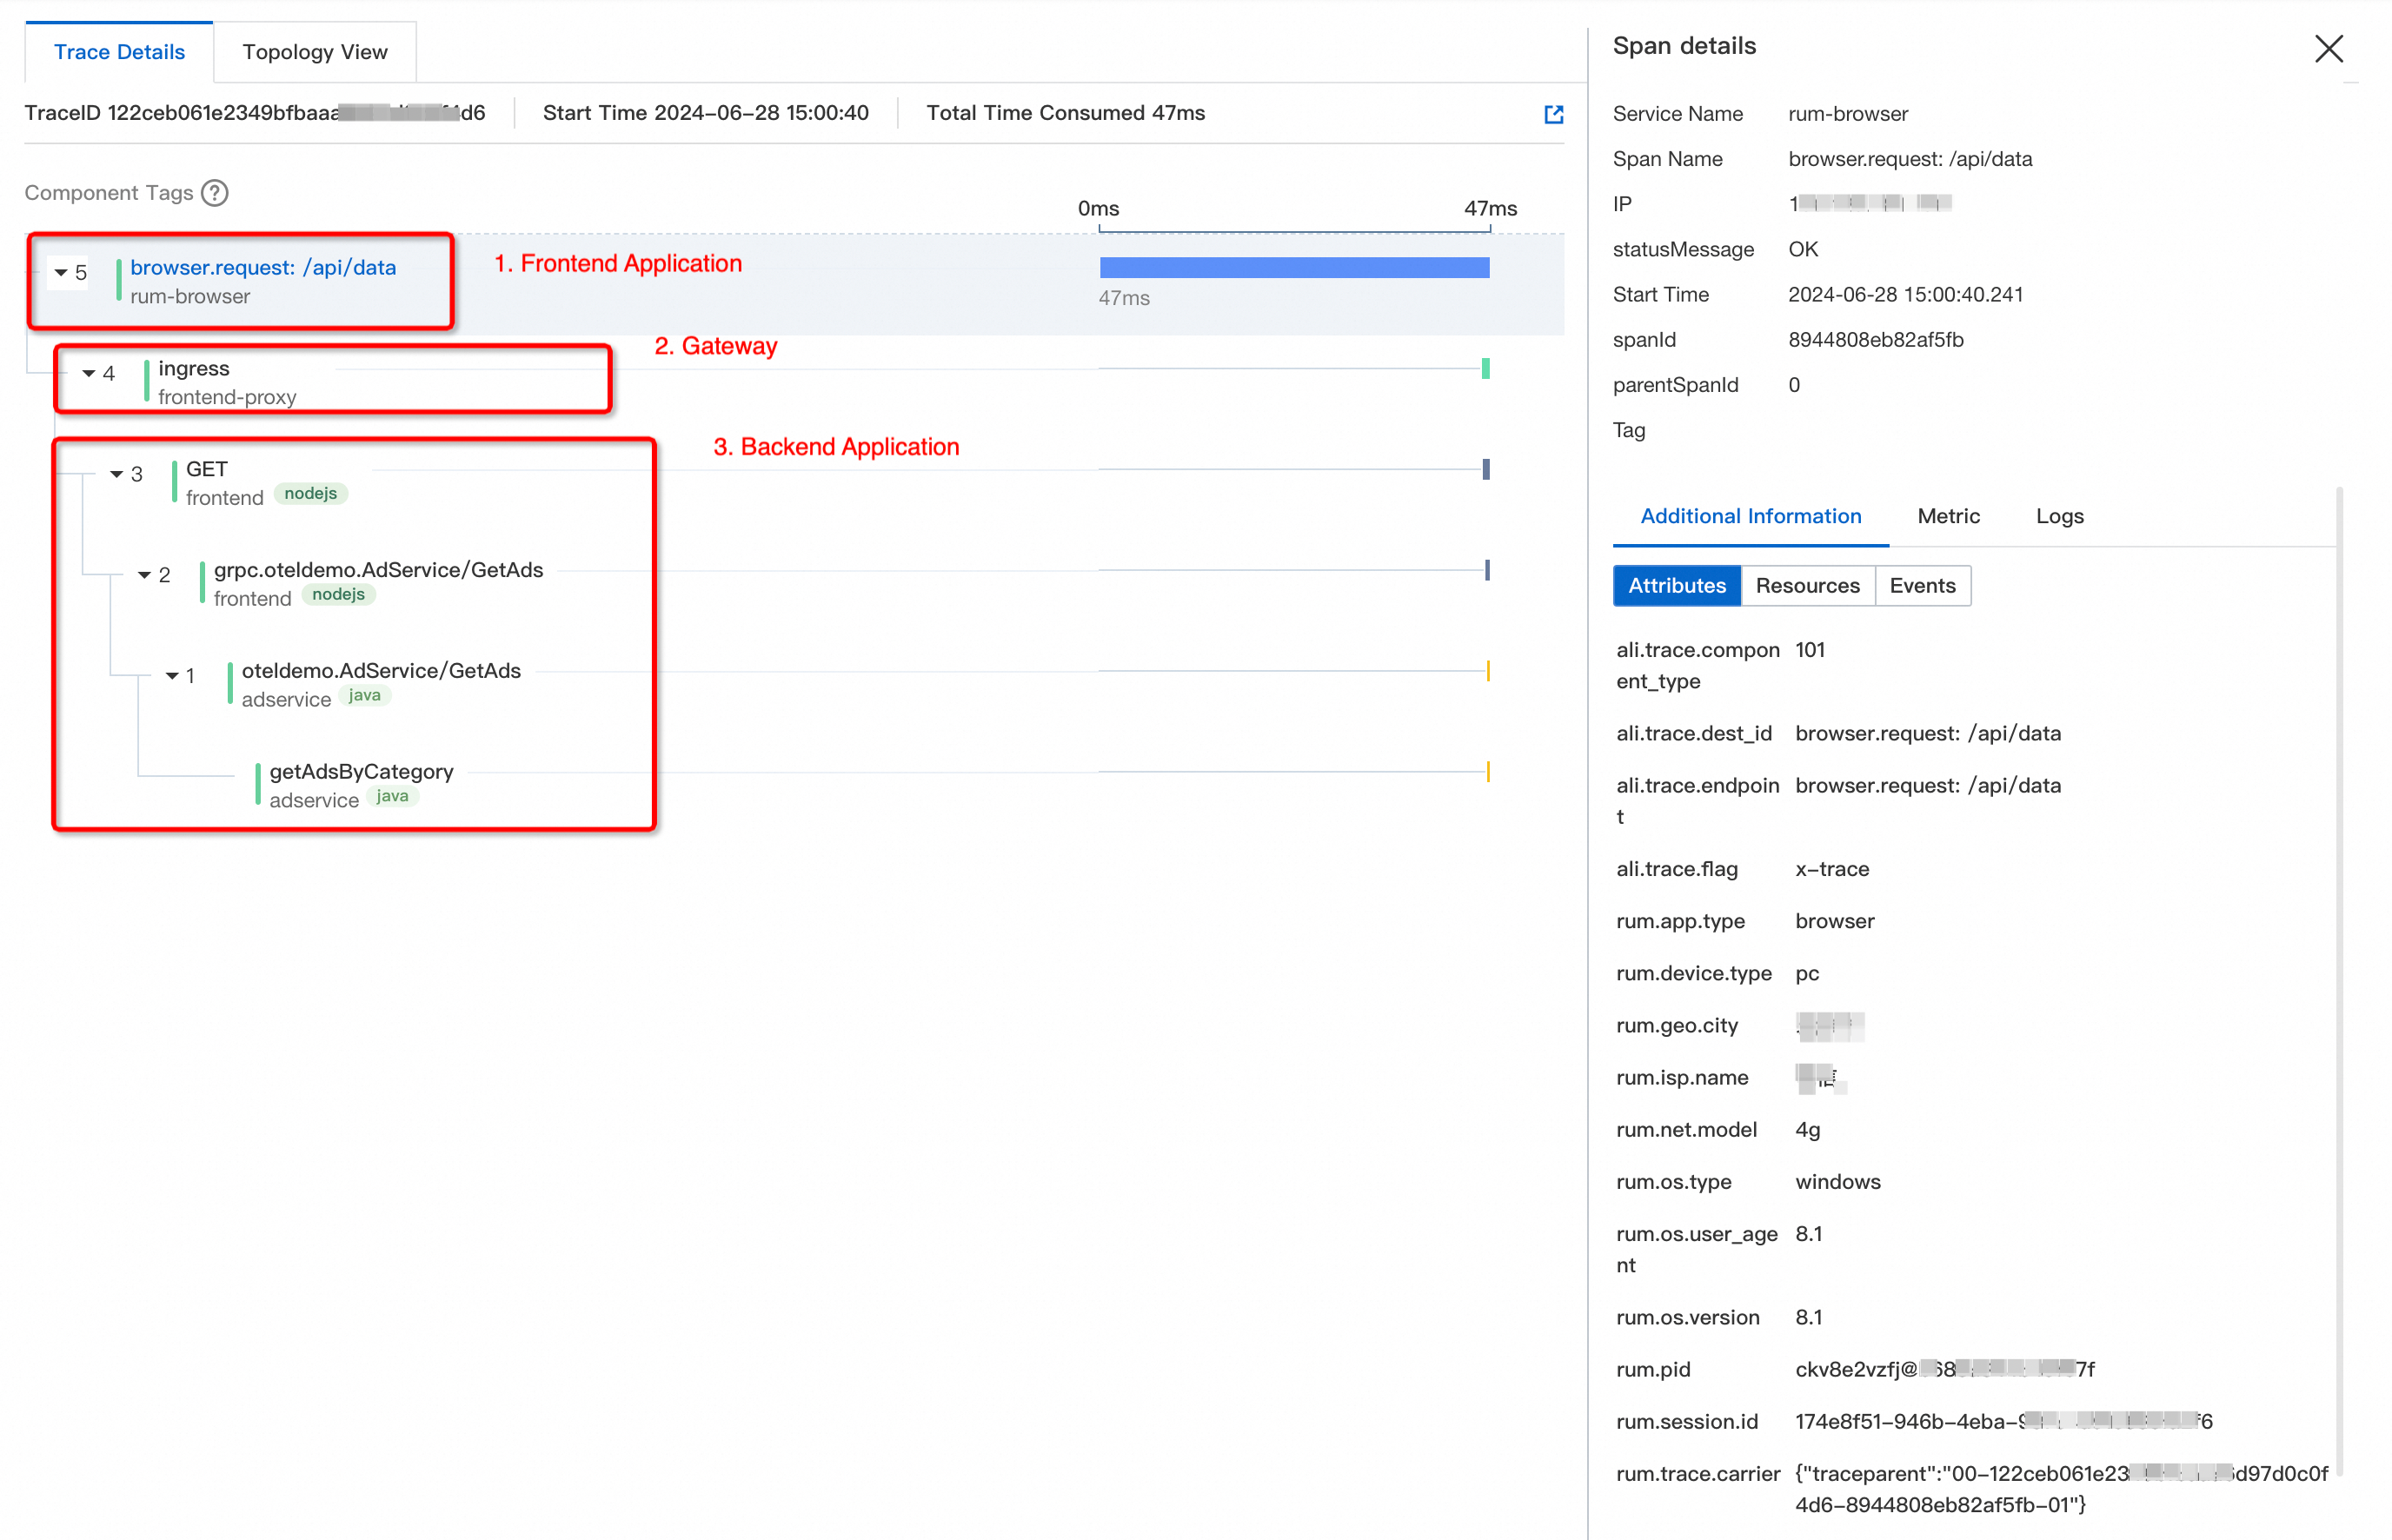
Alibaba Cloud Observability provides end-to-end tracing based on the OpenTelemetry W3C protocol and will gradually expand support for more protocols and components, building a more complete and flexible tracing ecosystem. The following figure shows a complete end-to-end call chain.
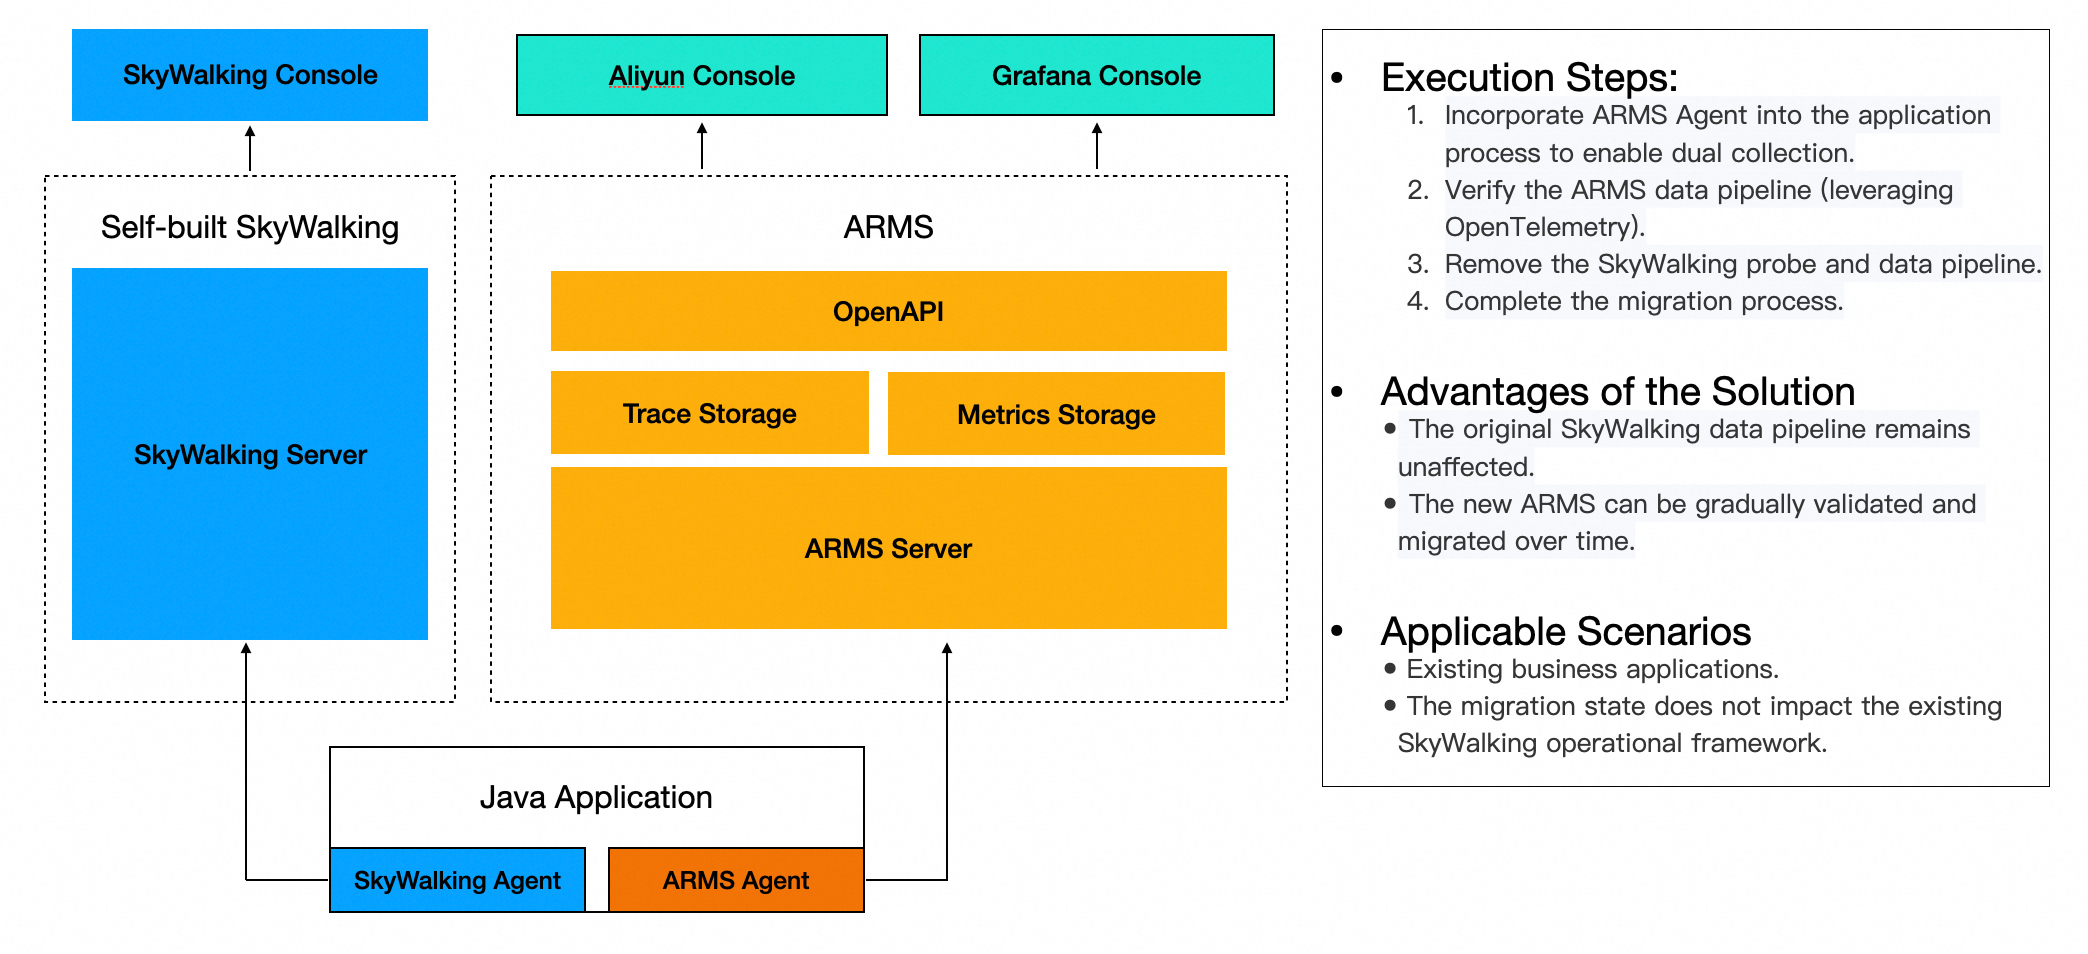
Unifying the end-to-end protocol stack for existing applications is more challenging than for new ones, especially when switching technology stacks — for example, migrating from SkyWalking to OpenTelemetry. You must keep the existing O&M system running while validating the new one, and the biggest challenge is ensuring that two different tracing systems can coexist without disrupting trace continuity.
To address this, the proprietary ARMS agent includes compatibility optimizations that allow dual agents to coexist, ensuring both systems run correctly and stably until the migration is complete. The following figure illustrates this scenario.
The proprietary ARMS agent supports multi-protocol detection and pass-through. When upstream and downstream systems are difficult to change, you can use the ARMS agent for protocol conversion. For example, if upstream application A uses the Jaeger protocol, the ARMS agent receives the Jaeger context and passes through both Jaeger and Zipkin B3 contexts to the downstream. Downstream application B can then use the Zipkin B3 protocol, achieving TraceId pass-through and connecting the full trace.