If data does not appear in the console after you report from an open source client, work through the following sections in order. Each section addresses a stage in the data pipeline where data can be lost.
Data flows through these stages before it appears in the console:
-
Client SDK or agent sends telemetry over HTTP or gRPC.
-
Network carries the request to the endpoint.
-
Ingestion endpoint accepts or rejects the request.
-
Storage backend (Simple Log Service) persists the data.
-
Console displays the data.
A failure at any stage blocks data. Start with network connectivity, then check ingestion, storage, and protocol-specific errors.
Check network connectivity
-
Identify whether your code uses a private or public endpoint. Private endpoints must be in the same VPC as the reporting server. Cross-region reporting is not supported.
-
From the reporting environment, run
curlortelnetto verify that the endpoint and port are reachable. Example for a gRPC endpoint in the China (Hangzhou) region: If the connection fails, check your ECS security group settings. Prepare for using Managed Service for OpenTelemetry and Security group overview cover common configurations.-
Success: The terminal displays a
Connectedmessage.
-
Failure: The terminal stays at
Trying [IP]or returnsUnable to connect to remote host.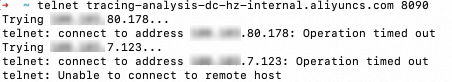
telnet <endpoint> <port>telnet tracing-analysis-dc-hz.aliyuncs.com 8090 -
Check ingestion settings
Ingestion can be disabled at the cluster or application level. It also stops when reported data reaches the quota.
Global ingestion configuration
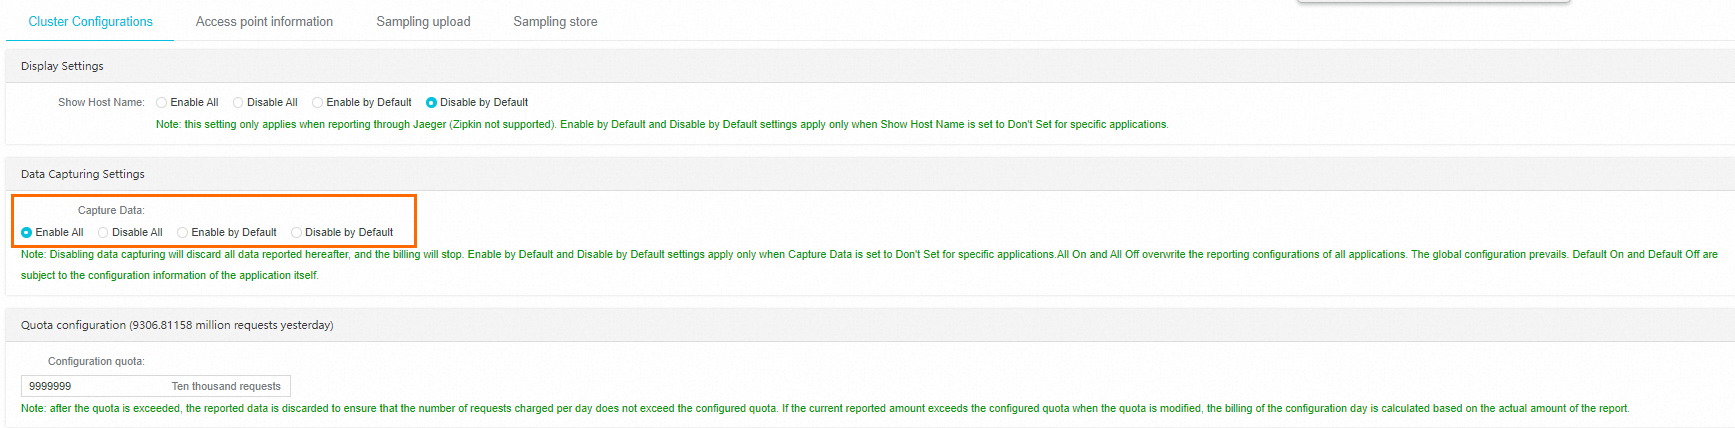
In the console, choose System Configuration > Cluster Configuration. In the Ingestion Configuration section, verify that Enable All or Enable by Default is selected.
Quota
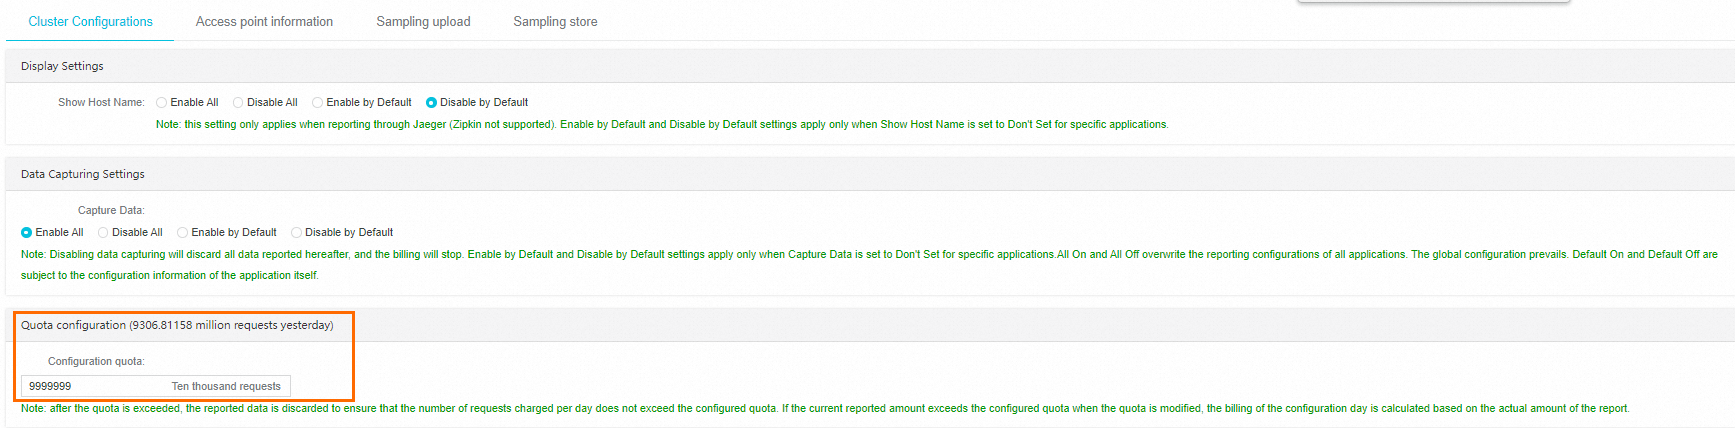
On the same Cluster Configuration page, check the Quota Configuration section. If reported data has reached the quota, increase it.
Application-level data capturing settings
On the Applications page, click the target application. In the left-side navigation pane, click Application Settings. On the Custom Configuration tab, verify that Capture Data is set to Enable or Don't Set in the Data Capturing Settings section.
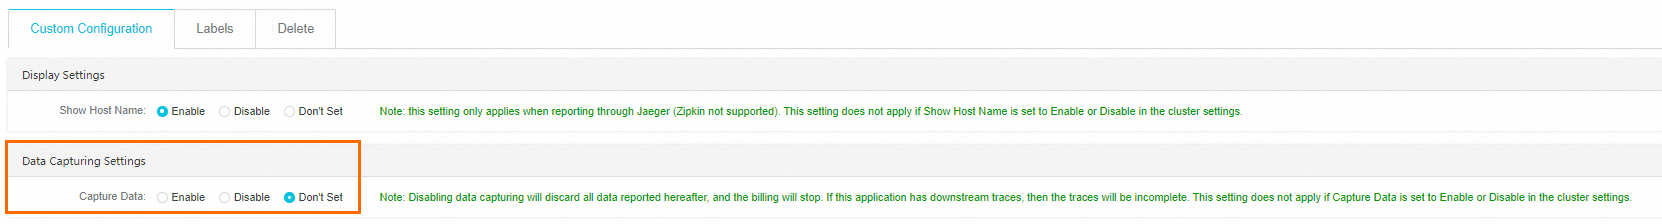
If Enable All or Disable All is selected in the global Ingestion Configuration, it overrides the application-level setting. If Don't Set is selected, the application inherits the cluster-level setting.
Check the Simple Log Service data source
The service stores data in Simple Log Service projects in your account. If these projects reach the upper limit, data reporting fails.
To resolve this issue:
-
Release Simple Log Service projects that are no longer in use.
-
Submit a ticket to increase the project limit.
Check the monitoring task status
If the console indicates that the monitoring task is abnormal or not enabled, submit a ticket.
Troubleshoot HTTP reporting failures
HTTP status codes
Check the HTTP status code in the console or logs, then apply the corresponding resolution.
| Status code | Meaning | Cause | Resolution |
|---|---|---|---|
| 400 | Unsupported data format | The Content-Type header value must be application/json, application/x-thrift, or Bad Request. Common causes: a tag value is a JSON array instead of a string, or spans are sent as a JSON object instead of a JSON array. |
Fix the request body to match the required format. |
| 403 | Authorization refused | (1) The endpoint or token is incorrect. (2) The Zipkin client URL contains /v2/spans. |
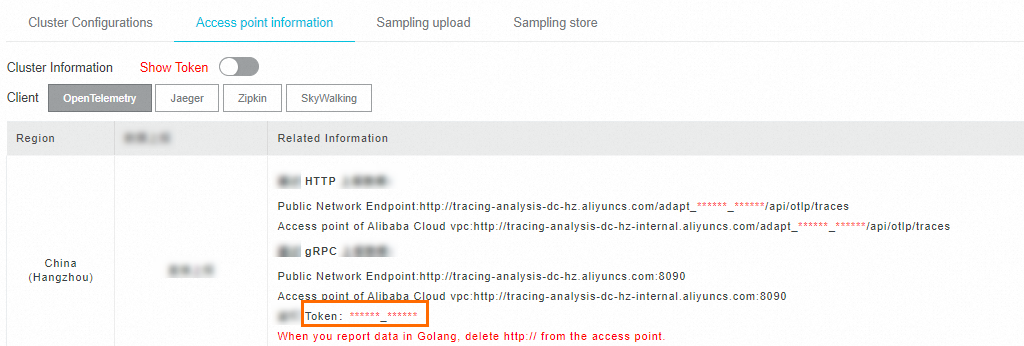
(1) Find the correct endpoint and token in the Managed Service for OpenTelemetry console under Cluster Configuration. (2) Remove /v2/spans from the URL. |
| 405 | Data quota exceeded | The reported data volume has reached the configured upper limit. | Increase the limit in the Quota Configuration section of the Cluster Configuration page. |
| 406 | Cluster collection disabled | Cluster data collection is disabled. | Enable it in the Ingestion Configuration section of the Cluster Configuration page. |
APISIX reporting failure
If APISIX returns this error when reporting through OpenTelemetry:
The origin server did not find a current representation for the target resource or is not willing to disclose that one exists.APISIX cannot report directly to Managed Service for OpenTelemetry. Use OpenTelemetry Collector to forward the data.
Troubleshoot gRPC reporting failures
Check the gRPC status code in the console or logs against the gRPC status codes reference.
Timeout
Error message:
Failed to export spans. The request could not be executed. Full error message: timeoutResolution:
-
Verify network connectivity.
-
Increase the reporting timeout in your SDK or agent configuration.
Authentication failure (gRPC status code 7)
Error message:
Failed to export spans. Server responded with gRPC status code 7. Error message:Verify that the Authentication field in the gRPC request header matches the token in the console.
SkyWalking MeterSender error
Error message:
MeterSender : Send meters to collector fail with a grpc internal exception. org.apache.skywalking.apm.dependencies.io.grpc.StatusRuntimeException: UNIMPLEMENTED: Method not found: skywalking.v3.MeterReportService/collectManaged Service for OpenTelemetry does not support SkyWalking metrics. Disable metrics reporting in the SkyWalking client.
Troubleshoot unexpected trace data
SkyWalking agent or SDK
Missing framework or middleware events
-
Check the SkyWalking agent plug-in path:
${agent-path}/agent-8.x/plugins. Verify that plug-in versions match your application's framework versions. If a plug-in is missing from thepluginsdirectory, copy it frombootstrap-pluginsoroptional-plugins, or download it from the SkyWalking community. -
Verify that only one SkyWalking agent is attached to the application. Multiple agents can cause instrumentation conflicts.
Broken trace
If you use asynchronous tracing, the Trace Cross Thread toolkit explains how to correlate spans across threads.
Trace shorter than expected
Increase the maximum number of spans the SkyWalking agent can report by modifying the collector.agent.service_graph.batch_size value in the ${agent-path}/agent-8.x/config/agent.config file.
OpenTelemetry agent or SDK
Broken trace
If you use asynchronous tracing, resolve broken traces with these approaches:
-
Update the OpenTelemetry version.
-
Use the SpanLinks API to correlate spans across traces.
-
Specify a span as the parent span of another span.
-
Pass the trace context explicitly through context propagation.