To quickly identify the cause of a business failure and resolve the issue, we recommend that you enable the session log feature in advance. This allows you to view log content at any time to assist with troubleshooting.
Scenario
An enterprise uses an Internet NAT Gateway to provide unified Internet access permissions for Elastic Compute Service (ECS) instances. To ensure quick identification of failure causes when business issues occur, the enterprise enabled the session log feature during the initial deployment.
An employee reported being unable to access a third-party service website (http://47.XX.XX.157), but no issue occurred when accessing the website through a newly purchased EIP. The enterprise contacted the service provider and discovered that the security department detected an abnormal surge in access from an EIP (47.XX.XX.85) around 15:00 on February 5, 2025, causing service anomalies. To maintain service stability, the security department added the EIP to a blacklist.
To identify the root cause, the enterprise operations team successfully found the ECS instance that caused the abnormal surge in access by analyzing session logs.

Usage notes
Billing
You are not charged for using the session log feature. However, recorded SNAT sessions are stored in Simple Log Service projects and you are charged for using Simple Log Service. For more information, see Billing of Simple Log Service.
Limits
You cannot enable the session log feature for pay-by-specification NAT gateways (no longer available for purchase).
Session log does not capture DNAT sessions.
Procedure
Step 1: Enable the session log feature
After you enable the session log feature, make sure that you create indexes and specify the retention period of logs to ensure data validity and accessibility.
Log on to the NAT Gateway console . Find the NAT gateway that you want to manage and click its ID.
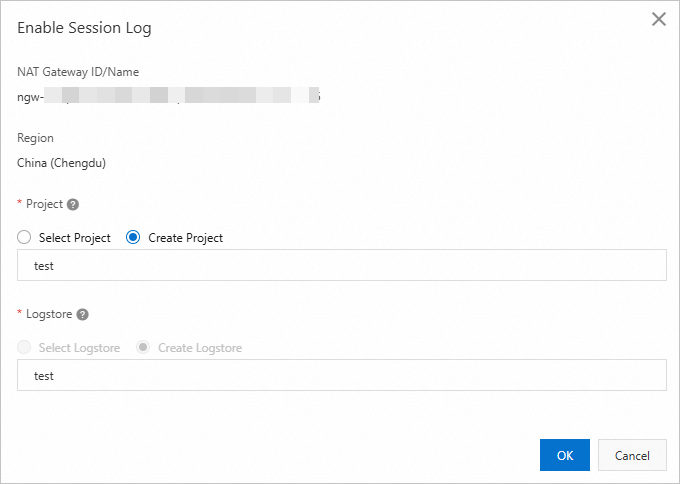
On the Monitoring and Logging tab, choose . In the dialog box that appears, select an existing Simple Log Service project and Logstore.
On the Monitoring and Logging tab, click the name in the Destination Information column to view the log content.

Step 2: Analyze log content
Based on the anomaly time provided by the service provider, use an SQL statement to query the traffic from ECS instances to the service every minute within 5 minutes before and after 15:00 on February 5, 2025.
select
    sum(bytes_from_vpc) as total_bytes, /* Core field for analyzing the cause of the failure */
    date_trunc('minute', __time__) as ts_min /* Statistics by minute */
from
    log
where
    pub_ip = '47.XX.XX.157' /* Filter by specific destination IP */
group by
    ts_min
Based on the analysis from the above statement, you can confirm that the traffic to the service peaked at 14:57. You can identify the ECS instance that caused this failure using the following method.
select pri_ip, sum(bytes_from_vpc) as total_bytes, /* Core field for analyzing the cause of the failure */ date_trunc('minute', __time__) as ts_min /* Statistics by minute */ from log where pub_ip = '47.XX.XX.157' /* Filter by specific destination IP */ group by ts_min, pri_ipNoteWhen the data volume is large, you can convert the data traffic to gigabytes
total_GBfor display.sum(bytes_from_vpc) / 1024 / 1024 / 1024 as total_GB
References
For more information about the fields captured in session logs, see Session logs.
For more information about the syntax of SQL statements, see SQL syntax.