PyODPS provides two methods for feature scaling in DataWorks: min_max_scale normalizes each value to a fixed range (default [0, 1]), and std_scale standardizes values to zero mean and unit variance. Both methods are commonly applied before training machine learning models to ensure numeric features are on a comparable scale.
Prerequisites
Before you begin, make sure you have:
Activated MaxCompute and DataWorks. See Activate MaxCompute and DataWorks and Purchase guide.
Created a workflow in the DataWorks console. This example uses a workspace in basic mode. See Create a workflow.
Scaling methods and parameters
min_max_scale
Normalizes each value to a target range using the formula:
scaled = (x - min) / (max - min) * (range_max - range_min) + range_minThe default range is [0, 1]. If max == min for a column, the scaled value is 0.
| Parameter | Type | Default | Description |
|---|---|---|---|
columns | list | — | Column names to scale (required) |
feature_range | tuple | (0, 1) | Output value range, e.g., (-1, 1) |
preserve | bool | False | If True, keeps the original column and adds a new {column}_scaled column |
suffix | str | _scaled | Suffix appended to the new column name when preserve=True |
group | list | — | Column names to group by; scaling uses per-group min and max |
std_scale
Standardizes each value to zero mean and unit variance:
scaled = (x - mean) / stdIf the standard deviation is 0, the scaled value is 0. The group parameter works the same as in min_max_scale.
| Parameter | Type | Default | Description |
|---|---|---|---|
columns | list | — | Column names to scale (required) |
group | list | — | Column names to group by; statistics are computed per group |
Scale data in a PyODPS node
Step 1: Create a table and import data
Download the iris dataset, extract
iris.data, and rename it toiris.csv.Create a table named
pyodps_irisand uploadiris.csv. See Create tables and upload data.CREATE TABLE if not exists pyodps_iris ( sepallength DOUBLE comment 'sepal length (cm)', sepalwidth DOUBLE comment 'sepal width (cm)', petallength DOUBLE comment 'petal length (cm)', petalwidth DOUBLE comment 'petal width (cm)', name STRING comment 'type' );
Step 2: Create a PyODPS 2 node
Log on to the DataWorks console.
In the left-side navigation pane, click Workspace.
On the DataStudio page, right-click your workflow and choose Create Node > MaxCompute > PyODPS 2.
In the Create Node dialog box, enter a Name and click Confirm.
Step 3: Enter and run the scaling code
On the configuration tab of the PyODPS 2 node, paste the following code into the code editor:
# Load the table as a DataFrame
df = DataFrame(o.get_table('pytable'))

# Normalize fid to [0, 1] (default range)
print df.min_max_scale(columns=['fid']).head()

# Normalize fid to a custom range [-1, 1]
print df.min_max_scale(columns=['fid'],feature_range=(-1,1)).head()

# Keep the original fid column; add fid_scaled with normalized values
print df.min_max_scale(columns=['fid'],preserve=True).head()

# Scale fid within each group defined by the name column
print df.min_max_scale(columns=['fid'],group=['name']).head()

# Standardize fid to zero mean and unit variance
print df.std_scale(columns=['fid']).head()
Click the Run icon in the toolbar.
Step 4: Check the run log
View the results on the Run Log tab.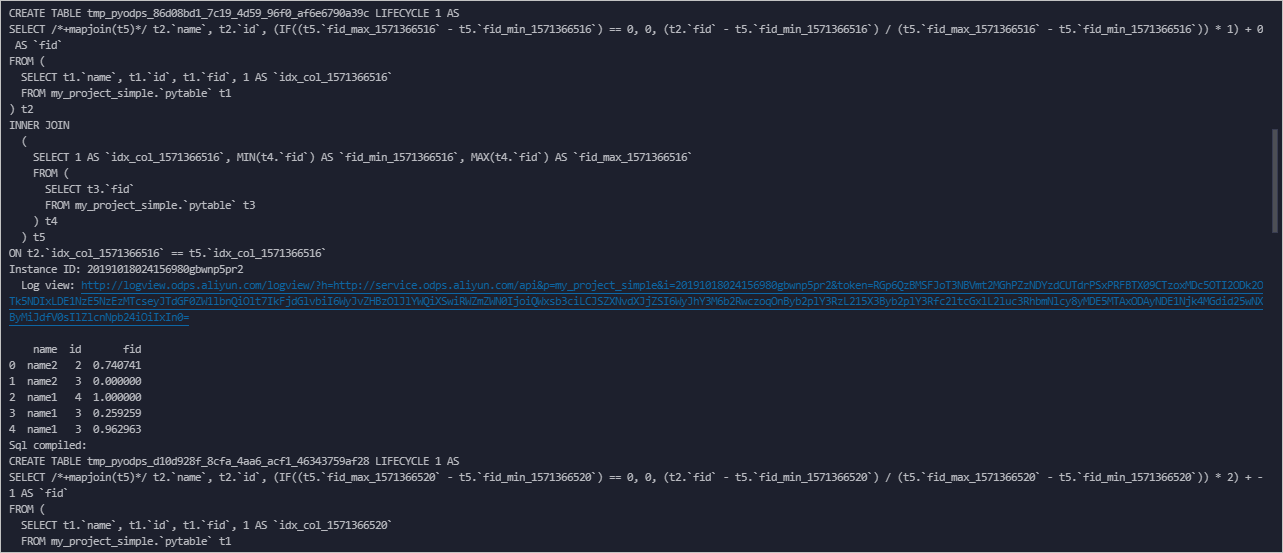
The log shows the compiled SQL and a result table for each scaling call. The sections below explain what to look for in each result.
Basic min_max_scale (default range [0, 1])
    name  id       fid
0  name1   4  1.000000
1  name2   2  0.526316
2  name2   3  0.000000
3  name1   4  0.710526
4  name1   3  0.184211
5  name1   3  0.684211
The global minimum (fid = 1.5) maps to 0.000000 and the global maximum (fid = 5.3) maps to 1.000000. All other values scale proportionally between these bounds.
feature_range=(-1, 1)
    name  id       fid
0  name1   4  1.000000
1  name2   2  0.052632
2  name2   3 -1.000000
3  name1   4  0.421053
4  name1   3 -0.631579
5  name1   3  0.368421
Values are rescaled to [-1, 1] using the same global min and max. The global minimum maps to -1.000000 and the global maximum maps to 1.000000.
preserve=True
    name  id  fid  fid_scaled
0  name1   4  5.3    1.000000
1  name2   2  3.5    0.526316
2  name2   3  1.5    0.000000
3  name1   4  4.2    0.710526
4  name1   3  2.2    0.184211
5  name1   3  4.1    0.684211
The original fid column is preserved. The new fid_scaled column holds the normalized values. Use this when downstream steps need both the original and the scaled values.
group=['name']
    name  id       fid
0  name1   4  1.000000
1  name2   2  1.000000
2  name2   3  0.000000
3  name1   4  0.645161
4  name1   3  0.000000
5  name1   3  0.612903
Scaling is applied separately within each group. In the name2 group, fid = 1.5 is the minimum (scales to 0.000000) and fid = 3.5 is the maximum (scales to 1.000000). In the name1 group, min and max are computed independently. Both groups show values in [0, 1], but relative to different baselines.
std_scale
    name  id       fid
0  name1   4  1.436467
1  name2   2  0.026118
2  name2   3 -1.540938
3  name1   4  0.574587
4  name1   3 -0.992468
5  name1   3  0.496234
Values are centered around 0. Positive values are above the global mean; negative values are below. Unlike min_max_scale, there is no fixed output range — the spread of values depends on the standard deviation of the data.