This topic describes how to install Prometheus in a Kubernetes cluster, collect metric data to a Metricstore, and visualize the metric data in Grafana.
Prerequisites
A Kubernetes cluster is created. The version of the Kubernetes cluster is 1.10 or later.
A Metricstore is created. For more information, see Create a Metricstore.
Grafana is installed. For more information, see Install Grafana.
Background information
Prometheus is a cloud native monitoring application. Most Kubernetes components expose metrics in the Prometheus format, which makes Prometheus a widely used Kubernetes monitoring tool.
Grafana is an open source metric analysis and visualization suite that is compatible with all Prometheus dashboard templates. After you configure Simple Log Service as a Prometheus data source, you can use Grafana to access metric data in Simple Log Service and visualize the data in Grafana.
Install Prometheus in a self-managed Kubernetes cluster
If you use a self-managed Kubernetes cluster, we recommend that you register the cluster in Container Service for Kubernetes (ACK). For more information, see Overview of registered clusters. After the cluster is registered, install Prometheus. For more information, see Install Prometheus in a cluster that is managed by ACK. If you do not want to register a self-managed cluster, install Prometheus by using the Helm package. Before you install Prometheus, you must create a secret and modify the settings in the Helm package.
Install Prometheus in a cluster that is managed by ACK
If you use a cluster that is managed by ACK, perform the following steps to install and configure Prometheus in the ACK console:
Log on to the ACK console.
On the Clusters page, click the cluster that you want to manage.
Create a namespace.
In the left-side navigation pane, choose .
Click Create.
Enter monitoring in the Name field and click OK.
Create a secret.
In the left-side navigation pane, choose .
In the upper part of the page that appears, select the monitoring namespace that you created in Step 3.
Click Create.
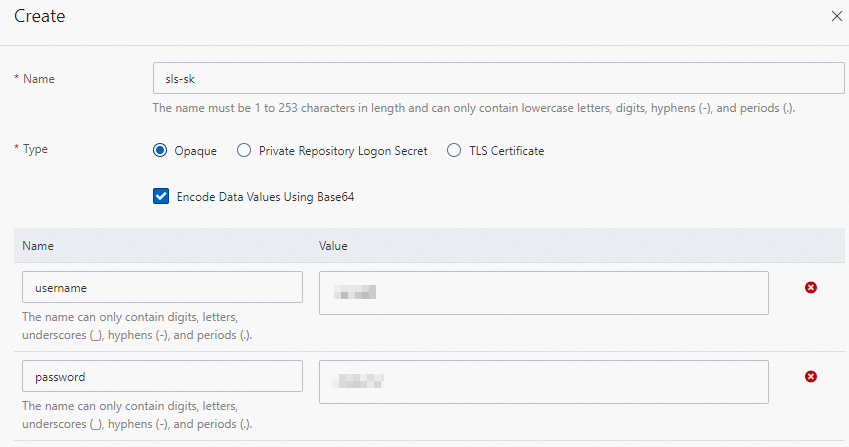
Configure the parameters and click OK. The following table describes the parameters.
Parameter
Description
Name
Set the value to sls-sk.
Type
Select Opaque and add the following key-value pairs:
Set Name to username and Value to the AccessKey ID of your Resource Access Management (RAM) user.
Set Name to password and Value to the AccessKey secret of your RAM user.
We recommend that you use the AccessKey pair of a RAM user that has only the write permissions on the Simple Log Service project. For more information, see Grant a RAM user the write permissions on a project.
Create a Prometheus operator.
Return to the homepage of the ACK console.
In the left-side navigation pane, choose .
Click the ack-prometheus-operator card.
Click Deploy.
In the Basic Information step, select your cluster and namespace, and click Next.
In the Parameters step, modify settings in the Parameters field and click OK.
Set the value of the retention parameter in the prometheusSpec parameter to 1d or 12h.
Replace the values of the required parameters in the remoteWrite parameter with actual values. For more information, see RemoteWriteSpec.
In the remoteWrite parameter, set the value of the url parameter to the actual URL of your Metricstore. Specify the URL in the https://{project}.{sls-endpoint}/prometheus/{project}/{metricstore}/api/v1/write format. The {sls-endpoint} variable specifies the Simple Log Service endpoint. For more information, see Endpoints. The {project} and {metricstore} variables specify the project and Metricstore that you created in the Simple Log Service console.
NoteIf you use an Alibaba Cloud internal network, we recommend that you use an internal Simple Log Service endpoint.
If you want to collect a large amount of metric data by using Prometheus, set the queue_config parameter to the following value:
batchSendDeadline: 30s
capacity: 204800
maxBackoff: 5s
maxSamplesPerSend: 4096
minBackoff: 100ms
minShards: 100
maxShards: 2048
ImportantTo reduce the amount of data that is collected, we recommend that you configure the writeRelabelConfigs parameter in the remoteWrite parameter. The writeRelabelConfigs parameter allows you to remove metrics that you do not need. By default, the Kubernetes metrics that are not commonly used are removed.
      remoteWrite:
      - basicAuth:
          username:
            name: sls-sk
            key: username
          password:
            name: sls-sk
            key: password
        queueConfig:
          batchSendDeadline: 30s
          capacity: 204800
          maxBackoff: 5s
          maxSamplesPerSend: 4096
          minBackoff: 100ms
          minShards: 100
          maxShards: 2048
        writeRelabelConfigs:
        - action: drop
          regex: APIServiceOpenAPIAggregationControllerQueue1_adds|APIServiceOpenAPIAggregationControllerQueue1_depth|APIServiceOpenAPIAggregationControllerQueue1_queue_latency|APIServiceOpenAPIAggregationControllerQueue1_queue_latency_count|APIServiceOpenAPIAggregationControllerQueue1_queue_latency_sum|APIServiceOpenAPIAggregationControllerQueue1_retries|APIServiceOpenAPIAggregationControllerQueue1_work_duration|APIServiceOpenAPIAggregationControllerQueue1_work_duration_count|APIServiceOpenAPIAggregationControllerQueue1_work_duration_sum|APIServiceRegistrationController_adds|APIServiceRegistrationController_depth|APIServiceRegistrationController_queue_latency|APIServiceRegistrationController_queue_latency_count|APIServiceRegistrationController_queue_latency_sum|APIServiceRegistrationController_retries|APIServiceRegistrationController_work_duration|APIServiceRegistrationController_work_duration_count|APIServiceRegistrationController_work_duration_sum|AvailableConditionController_adds|AvailableConditionController_depth|AvailableConditionController_queue_latency|AvailableConditionController_queue_latency_count|AvailableConditionController_queue_latency_sum|AvailableConditionController_retries|AvailableConditionController_work_duration|AvailableConditionController_work_duration_count|AvailableConditionController_work_duration_sum|DiscoveryController_adds|DiscoveryController_depth|DiscoveryController_queue_latency|DiscoveryController_queue_latency_count|DiscoveryController_queue_latency_sum|DiscoveryController_retries|DiscoveryController_work_duration|DiscoveryController_work_duration_count|DiscoveryController_work_duration_sum|admission_quota_controller_adds|admission_quota_controller_depth|admission_quota_controller_queue_latency|admission_quota_controller_queue_latency_count|admission_quota_controller_queue_latency_sum|admission_quota_controller_work_duration|admission_quota_controller_work_duration_count|admission_quota_controller_work_duration_sum|alertmanager_alerts|alertmanager_alerts_invalid_total|alertmanager_alerts_received_total|alertmanager_build_info|alertmanager_cluster_failed_peers|alertmanager_cluster_health_score|alertmanager_cluster_members|alertmanager_cluster_messages_pruned_total|alertmanager_cluster_messages_queued|alertmanager_cluster_messages_received_size_total|alertmanager_cluster_messages_received_total|alertmanager_cluster_messages_sent_size_total|alertmanager_cluster_messages_sent_total|alertmanager_cluster_peers_joined_total|alertmanager_cluster_peers_left_total|alertmanager_cluster_peers_update_total|alertmanager_cluster_reconnections_failed_total|alertmanager_cluster_reconnections_total|alertmanager_cluster_refresh_join_failed_total|alertmanager_cluster_refresh_join_total|alertmanager_config_hash|alertmanager_config_last_reload_success_timestamp_seconds|alertmanager_config_last_reload_successful|alertmanager_http_request_duration_seconds_bucket|alertmanager_http_request_duration_seconds_count|alertmanager_http_request_duration_seconds_sum|alertmanager_http_response_size_bytes_bucket|alertmanager_http_response_size_bytes_count|alertmanager_http_response_size_bytes_sum|alertmanager_nflog_gc_duration_seconds|alertmanager_nflog_gc_duration_seconds_count|alertmanager_nflog_gc_duration_seconds_sum|alertmanager_nflog_gossip_messages_propagated_total|alertmanager_nflog_queries_total|alertmanager_nflog_query_duration_seconds_bucket|alertmanager_nflog_query_duration_seconds_count|alertmanager_nflog_query_duration_seconds_sum|alertmanager_nflog_query_errors_total|alertmanager_nflog_snapshot_duration_seconds|alertmanager_nflog_snapshot_duration_seconds_count|alertmanager_nflog_snapshot_duration_seconds_sum|alertmanager_nflog_snapshot_size_bytes|alertmanager_notification_latency_seconds_bucket|alertmanager_notification_latency_seconds_count|alertmanager_notification_latency_seconds_sum|alertmanager_notifications_failed_total|alertmanager_notifications_total|alertmanager_oversize_gossip_message_duration_seconds_bucket|alertmanager_oversize_gossip_message_duration_seconds_count|alertmanager_oversize_gossip_message_duration_seconds_sum|alertmanager_oversized_gossip_message_dropped_total|alertmanager_oversized_gossip_message_failure_total|alertmanager_oversized_gossip_message_sent_total|alertmanager_peer_position|alertmanager_silences|alertmanager_silences_gc_duration_seconds|alertmanager_silences_gc_duration_seconds_count|alertmanager_silences_gc_duration_seconds_sum|alertmanager_silences_gossip_messages_propagated_total|alertmanager_silences_queries_total|alertmanager_silences_query_duration_seconds_bucket|alertmanager_silences_query_duration_seconds_count|alertmanager_silences_query_duration_seconds_sum|alertmanager_silences_query_errors_total|alertmanager_silences_snapshot_duration_seconds|alertmanager_silences_snapshot_duration_seconds_count|alertmanager_silences_snapshot_duration_seconds_sum|alertmanager_silences_snapshot_size_bytes|apiserver_admission_controller_admission_latencies_seconds_bucket|apiserver_admission_controller_admission_latencies_seconds_count|apiserver_admission_controller_admission_latencies_seconds_sum|apiserver_admission_step_admission_latencies_seconds_bucket|apiserver_admission_step_admission_latencies_seconds_count|apiserver_admission_step_admission_latencies_seconds_sum|apiserver_admission_step_admission_latencies_seconds_summary|apiserver_admission_step_admission_latencies_seconds_summary_count|apiserver_admission_step_admission_latencies_seconds_summary_sum|apiserver_admission_webhook_admission_latencies_seconds_bucket|apiserver_admission_webhook_admission_latencies_seconds_count|apiserver_admission_webhook_admission_latencies_seconds_sum|apiserver_audit_event_total|apiserver_audit_level_total|apiserver_client_certificate_expiration_seconds_bucket|apiserver_client_certificate_expiration_seconds_count|apiserver_client_certificate_expiration_seconds_sum|apiserver_current_inflight_requests|apiserver_registered_watchers|apiserver_request_latencies_bucket|apiserver_request_latencies_count|apiserver_request_latencies_sum|apiserver_request_latencies_summary_count|apiserver_request_latencies_summary_sum|apiserver_response_sizes_bucket|apiserver_response_sizes_count|apiserver_response_sizes_sum|apiserver_storage_data_key_generation_failures_total|apiserver_storage_data_key_generation_latencies_microseconds_bucket|apiserver_storage_data_key_generation_latencies_microseconds_count|apiserver_storage_data_key_generation_latencies_microseconds_sum|apiserver_storage_envelope_transformation_cache_misses_total|authenticated_user_requests|autoregister_adds|autoregister_depth|autoregister_queue_latency|autoregister_queue_latency_count|autoregister_queue_latency_sum|autoregister_retries|autoregister_work_duration|autoregister_work_duration_count|autoregister_work_duration_sum|cadvisor_version_info|container_cpu_cfs_periods_total|container_cpu_load_average_10s|container_cpu_system_seconds_total|container_cpu_user_seconds_total|container_fs_inodes_free|container_fs_inodes_total|container_fs_io_current|container_fs_io_time_seconds_total|container_fs_io_time_weighted_seconds_total|container_fs_reads_merged_total|container_fs_reads_total|container_fs_sector_reads_total|container_fs_sector_writes_total|container_fs_writes_merged_total|container_fs_writes_total|container_last_seen|container_memory_cache|container_memory_failcnt|container_memory_failures_total|container_memory_mapped_file|container_memory_max_usage_bytes|container_memory_swap|container_network_receive_errors_total|container_network_receive_packets_dropped_total|container_network_receive_packets_total|container_network_transmit_errors_total|container_network_transmit_packets_dropped_total|container_scrape_error|container_spec_cpu_period|container_spec_cpu_shares|container_spec_memory_reservation_limit_bytes|container_spec_memory_swap_limit_bytes|container_start_time_seconds|container_tasks_state|coredns_autopath_success_count_total|coredns_forward_request_count_total|coredns_forward_request_duration_seconds_bucket|coredns_forward_request_duration_seconds_count|coredns_forward_request_duration_seconds_sum|coredns_forward_response_rcode_count_total|coredns_forward_sockets_open|coredns_plugin_enabled|coredns_proxy_request_count_total|coredns_proxy_request_duration_seconds_bucket|coredns_proxy_request_duration_seconds_count|coredns_proxy_request_duration_seconds_sum|crdEstablishing_adds|crdEstablishing_depth|crdEstablishing_queue_latency_count|crdEstablishing_queue_latency_sum|crdEstablishing_retries|crdEstablishing_work_duration_count|crdEstablishing_work_duration_sum|etcd_helper_cache_entry_count|etcd_helper_cache_hit_count|etcd_helper_cache_miss_count|etcd_object_counts|etcd_request_cache_add_latencies_summary_count|etcd_request_cache_add_latencies_summary_sum|etcd_request_cache_get_latencies_summary_count|etcd_request_cache_get_latencies_summary_sum|get_token_count|get_token_fail_count|go_memstats_heap_released_bytes_total|grafana_alerting_active_alerts|grafana_alerting_execution_time_milliseconds_count|grafana_alerting_execution_time_milliseconds_sum|grafana_api_admin_user_created_total|grafana_api_dashboard_get_milliseconds_count|grafana_api_dashboard_get_milliseconds_sum|grafana_api_dashboard_save_milliseconds_count|grafana_api_dashboard_save_milliseconds_sum|grafana_api_dashboard_search_milliseconds_count|grafana_api_dashboard_search_milliseconds_sum|grafana_api_dashboard_snapshot_create_total|grafana_api_dashboard_snapshot_external_total|grafana_api_dashboard_snapshot_get_total|grafana_api_dataproxy_request_all_milliseconds_count|grafana_api_dataproxy_request_all_milliseconds_sum|grafana_api_login_oauth_total|grafana_api_login_post_total|grafana_api_models_dashboard_insert_total|grafana_api_org_create_total|grafana_api_response_status_total|grafana_api_user_signup_completed_total|grafana_api_user_signup_invite_total|grafana_api_user_signup_started_total|grafana_aws_cloudwatch_get_metric_data_total|grafana_aws_cloudwatch_get_metric_statistics_total|grafana_aws_cloudwatch_list_metrics_total|grafana_build_info|grafana_db_datasource_query_by_id_total|grafana_info|grafana_instance_start_total|grafana_page_response_status_total|grafana_proxy_response_status_total|grafana_stat_active_users|grafana_stat_total_orgs|grafana_stat_total_playlists|grafana_stat_total_users|grafana_stat_totals_dashboard|grpc_client_handled_total|grpc_client_msg_received_total|grpc_client_msg_sent_total|grpc_client_started_total|http_request_duration_microseconds|http_request_duration_microseconds_count|http_request_duration_microseconds_sum|http_request_duration_milliseconds_count|http_request_duration_milliseconds_sum|http_request_size_bytes|http_request_size_bytes_count|http_request_size_bytes_sum|http_request_total|http_requests_total|http_response_size_bytes|http_response_size_bytes_count|http_response_size_bytes_sum|kube_configmap_created|kube_configmap_info|kube_configmap_metadata_resource_version|kube_daemonset_labels|kube_daemonset_metadata_generation|kube_daemonset_status_current_number_scheduled|kube_daemonset_status_number_available|kube_daemonset_status_number_misscheduled|kube_daemonset_status_number_unavailable|kube_daemonset_updated_number_scheduled|kube_deployment_labels|kube_deployment_spec_paused|kube_deployment_spec_strategy_rollingupdate_max_surge|kube_endpoint_address_available|kube_endpoint_address_not_ready|kube_endpoint_created|kube_endpoint_info|kube_endpoint_labels|kube_ingress_created|kube_ingress_info|kube_ingress_labels|kube_ingress_metadata_resource_version|kube_job_complete|kube_job_created|kube_job_info|kube_job_labels|kube_job_owner|kube_job_spec_completions|kube_job_spec_parallelism|kube_job_status_active|kube_job_status_completion_time|kube_job_status_failed|kube_job_status_start_time|kube_job_status_succeeded|kube_namespace_annotations|kube_namespace_created|kube_namespace_labels|kube_namespace_status_phase|kube_node_created|kube_node_status_allocatable|kube_node_status_capacity|kube_node_status_capacity_pods|kube_pod_completion_time|kube_pod_container_resource_requests|kube_pod_container_status_last_terminated_reason|kube_pod_container_status_ready|kube_pod_container_status_terminated_reason|kube_pod_container_status_waiting_reason|kube_pod_created|kube_pod_start_time|kube_pod_status_ready|kube_pod_status_scheduled|kube_pod_status_scheduled_time|kube_replicaset_created|kube_replicaset_labels|kube_replicaset_metadata_generation|kube_replicaset_owner|kube_replicaset_spec_replicas|kube_replicaset_status_fully_labeled_replicas|kube_replicaset_status_observed_generation|kube_replicaset_status_ready_replicas|kube_replicaset_status_replicas|kube_secret_created|kube_secret_info|kube_secret_labels|kube_secret_metadata_resource_version|kube_secret_type|kube_service_created|kube_service_labels|kube_service_spec_type|kube_service_status_load_balancer_ingress|kube_statefulset_created|kube_statefulset_labels|kube_statefulset_metadata_generation|kube_statefulset_replicas|kube_statefulset_status_current_revision|kube_statefulset_status_observed_generation|kube_statefulset_status_replicas|kube_statefulset_status_replicas_current|kube_statefulset_status_replicas_ready|kube_statefulset_status_replicas_updated|kube_statefulset_status_update_revision|kubelet_certificate_manager_client_expiration_seconds|kubelet_cgroup_manager_latency_microseconds|kubelet_cgroup_manager_latency_microseconds_count|kubelet_cgroup_manager_latency_microseconds_sum|kubelet_containers_per_pod_count|kubelet_containers_per_pod_count_count|kubelet_containers_per_pod_count_sum|kubelet_docker_operations|kubelet_docker_operations_errors|kubelet_docker_operations_latency_microseconds|kubelet_docker_operations_latency_microseconds_count|kubelet_docker_operations_latency_microseconds_sum|kubelet_docker_operations_timeout|kubelet_eviction_stats_age_microseconds_count|kubelet_eviction_stats_age_microseconds_sum|kubelet_network_plugin_operations_latency_microseconds|kubelet_network_plugin_operations_latency_microseconds_count|kubelet_network_plugin_operations_latency_microseconds_sum|kubelet_node_config_error|kubelet_pleg_relist_interval_microseconds|kubelet_pleg_relist_interval_microseconds_count|kubelet_pleg_relist_interval_microseconds_sum|kubelet_pleg_relist_latency_microseconds|kubelet_pleg_relist_latency_microseconds_count|kubelet_pleg_relist_latency_microseconds_sum|kubelet_pod_start_latency_microseconds|kubelet_pod_start_latency_microseconds_count|kubelet_pod_start_latency_microseconds_sum|kubelet_pod_worker_latency_microseconds|kubelet_pod_worker_latency_microseconds_count|kubelet_pod_worker_latency_microseconds_sum|kubelet_pod_worker_start_latency_microseconds|kubelet_pod_worker_start_latency_microseconds_count|kubelet_pod_worker_start_latency_microseconds_sum|kubelet_running_container_count|kubelet_running_pod_count|kubelet_runtime_operations|kubelet_runtime_operations_errors|kubelet_runtime_operations_latency_microseconds|kubelet_runtime_operations_latency_microseconds_count|kubelet_runtime_operations_latency_microseconds_sum|kubernetes_build_info|net_conntrack_dialer_conn_attempted_total|net_conntrack_dialer_conn_closed_total|net_conntrack_dialer_conn_established_total|net_conntrack_dialer_conn_failed_total|net_conntrack_listener_conn_accepted_total|net_conntrack_listener_conn_closed_total|nginx_ingress_controller_leader_election_status|nginx_ingress_controller_ssl_expire_time_seconds|prometheus_api_remote_read_queries|prometheus_build_info|prometheus_config_last_reload_success_timestamp_seconds|prometheus_config_last_reload_successful|prometheus_engine_queries|prometheus_engine_queries_concurrent_max|prometheus_engine_query_duration_seconds|prometheus_engine_query_duration_seconds_count|prometheus_engine_query_duration_seconds_sum|prometheus_http_request_duration_seconds_bucket|prometheus_http_request_duration_seconds_count|prometheus_http_request_duration_seconds_sum|prometheus_http_response_size_bytes_bucket|prometheus_http_response_size_bytes_count|prometheus_http_response_size_bytes_sum|prometheus_notifications_alertmanagers_discovered|prometheus_notifications_dropped_total|prometheus_notifications_errors_total|prometheus_notifications_latency_seconds|prometheus_notifications_latency_seconds_count|prometheus_notifications_latency_seconds_sum|prometheus_notifications_queue_capacity|prometheus_notifications_queue_length|prometheus_notifications_sent_total|prometheus_operator_node_address_lookup_errors_total|prometheus_operator_reconcile_errors_total|prometheus_operator_spec_replicas|prometheus_operator_triggered_total|prometheus_remote_storage_dropped_samples_total|prometheus_remote_storage_enqueue_retries_total|prometheus_remote_storage_failed_samples_total|prometheus_remote_storage_highest_timestamp_in_seconds|prometheus_remote_storage_pending_samples|prometheus_remote_storage_queue_highest_sent_timestamp_seconds|prometheus_remote_storage_remote_read_queries|prometheus_remote_storage_retried_samples_total|prometheus_remote_storage_samples_in_total|prometheus_remote_storage_sent_batch_duration_seconds_bucket|prometheus_remote_storage_sent_batch_duration_seconds_count|prometheus_remote_storage_sent_batch_duration_seconds_sum|prometheus_remote_storage_shard_capacity|prometheus_remote_storage_shards|prometheus_remote_storage_succeeded_samples_total|prometheus_rule_evaluation_duration_seconds|prometheus_rule_evaluation_duration_seconds_count|prometheus_rule_evaluation_duration_seconds_sum|prometheus_rule_evaluation_failures_total|prometheus_rule_evaluations_total|prometheus_rule_group_duration_seconds|prometheus_rule_group_duration_seconds_count|prometheus_rule_group_duration_seconds_sum|prometheus_rule_group_interval_seconds|prometheus_rule_group_iterations_missed_total|prometheus_rule_group_iterations_total|prometheus_rule_group_last_duration_seconds|prometheus_rule_group_last_evaluation_timestamp_seconds|prometheus_rule_group_rules|prometheus_sd_consul_rpc_duration_seconds_count|prometheus_sd_consul_rpc_duration_seconds_sum|prometheus_sd_consul_rpc_failures_total|prometheus_sd_discovered_targets|prometheus_sd_dns_lookup_failures_total|prometheus_sd_dns_lookups_total|prometheus_sd_file_read_errors_total|prometheus_sd_file_scan_duration_seconds_count|prometheus_sd_file_scan_duration_seconds_sum|prometheus_sd_kubernetes_cache_last_resource_version|prometheus_sd_kubernetes_cache_list_duration_seconds_count|prometheus_sd_kubernetes_cache_list_duration_seconds_sum|prometheus_sd_kubernetes_cache_list_items_count|prometheus_sd_kubernetes_cache_list_items_sum|prometheus_sd_kubernetes_cache_list_total|prometheus_sd_kubernetes_cache_short_watches_total|prometheus_sd_kubernetes_cache_watch_duration_seconds_count|prometheus_sd_kubernetes_cache_watch_duration_seconds_sum|prometheus_sd_kubernetes_cache_watch_events_count|prometheus_sd_kubernetes_cache_watch_events_sum|prometheus_sd_kubernetes_cache_watches_total|prometheus_sd_kubernetes_events_total|prometheus_sd_kubernetes_http_request_duration_seconds_count|prometheus_sd_kubernetes_http_request_duration_seconds_sum|prometheus_sd_kubernetes_http_request_total|prometheus_sd_kubernetes_workqueue_depth|prometheus_sd_kubernetes_workqueue_items_total|prometheus_sd_kubernetes_workqueue_latency_seconds_count|prometheus_sd_kubernetes_workqueue_latency_seconds_sum|prometheus_sd_kubernetes_workqueue_longest_running_processor_seconds|prometheus_sd_kubernetes_workqueue_unfinished_work_seconds|prometheus_sd_kubernetes_workqueue_work_duration_seconds_count|prometheus_sd_kubernetes_workqueue_work_duration_seconds_sum|prometheus_sd_received_updates_total|prometheus_sd_updates_total|prometheus_target_interval_length_seconds|prometheus_target_interval_length_seconds_count|prometheus_target_interval_length_seconds_sum|prometheus_target_scrape_pool_reloads_failed_total|prometheus_target_scrape_pool_reloads_total|prometheus_target_scrape_pool_sync_total|prometheus_target_scrape_pools_failed_total|prometheus_target_scrape_pools_total|prometheus_target_scrapes_cache_flush_forced_total|prometheus_target_scrapes_exceeded_sample_limit_total|prometheus_target_scrapes_sample_duplicate_timestamp_total|prometheus_target_scrapes_sample_out_of_bounds_total|prometheus_target_scrapes_sample_out_of_order_total|prometheus_target_sync_length_seconds|prometheus_target_sync_length_seconds_count|prometheus_target_sync_length_seconds_sum|prometheus_template_text_expansion_failures_total|prometheus_template_text_expansions_total|prometheus_treecache_watcher_goroutines|prometheus_treecache_zookeeper_failures_total|prometheus_tsdb_blocks_loaded|prometheus_tsdb_checkpoint_creations_failed_total|prometheus_tsdb_checkpoint_creations_total|prometheus_tsdb_checkpoint_deletions_failed_total|prometheus_tsdb_checkpoint_deletions_total|prometheus_tsdb_compaction_chunk_range_seconds_bucket|prometheus_tsdb_compaction_chunk_range_seconds_count|prometheus_tsdb_compaction_chunk_range_seconds_sum|prometheus_tsdb_compaction_chunk_samples_bucket|prometheus_tsdb_compaction_chunk_samples_count|prometheus_tsdb_compaction_chunk_samples_sum|prometheus_tsdb_compaction_chunk_size_bytes_bucket|prometheus_tsdb_compaction_chunk_size_bytes_count|prometheus_tsdb_compaction_chunk_size_bytes_sum|prometheus_tsdb_compaction_duration_seconds_bucket|prometheus_tsdb_compaction_duration_seconds_count|prometheus_tsdb_compaction_duration_seconds_sum|prometheus_tsdb_compaction_populating_block|prometheus_tsdb_compactions_failed_total|prometheus_tsdb_compactions_total|prometheus_tsdb_compactions_triggered_total|prometheus_tsdb_head_active_appenders|prometheus_tsdb_head_chunks|prometheus_tsdb_head_chunks_created_total|prometheus_tsdb_head_chunks_removed_total|prometheus_tsdb_head_gc_duration_seconds_count|prometheus_tsdb_head_gc_duration_seconds_sum|prometheus_tsdb_head_max_time|prometheus_tsdb_head_max_time_seconds|prometheus_tsdb_head_min_time|prometheus_tsdb_head_min_time_seconds|prometheus_tsdb_head_samples_appended_total|prometheus_tsdb_head_series|prometheus_tsdb_head_series_created_total|prometheus_tsdb_head_series_not_found_total|prometheus_tsdb_head_series_removed_total|prometheus_tsdb_head_truncations_failed_total|prometheus_tsdb_head_truncations_total|prometheus_tsdb_lowest_timestamp|prometheus_tsdb_lowest_timestamp_seconds|prometheus_tsdb_reloads_failures_total|prometheus_tsdb_reloads_total|prometheus_tsdb_size_retentions_total|prometheus_tsdb_storage_blocks_bytes|prometheus_tsdb_symbol_table_size_bytes|prometheus_tsdb_time_retentions_total|prometheus_tsdb_tombstone_cleanup_seconds_bucket|prometheus_tsdb_tombstone_cleanup_seconds_count|prometheus_tsdb_tombstone_cleanup_seconds_sum|prometheus_tsdb_vertical_compactions_total|prometheus_tsdb_wal_completed_pages_total|prometheus_tsdb_wal_corruptions_total|prometheus_tsdb_wal_fsync_duration_seconds_count|prometheus_tsdb_wal_fsync_duration_seconds_sum|prometheus_tsdb_wal_page_flushes_total|prometheus_tsdb_wal_truncate_duration_seconds_count|prometheus_tsdb_wal_truncate_duration_seconds_sum|prometheus_tsdb_wal_truncations_failed_total|prometheus_tsdb_wal_truncations_total|prometheus_wal_watcher_current_segment|prometheus_wal_watcher_record_decode_failures_total|prometheus_wal_watcher_records_read_total|prometheus_wal_watcher_samples_sent_pre_tailing_total|reflector_items_per_list_count|reflector_items_per_list_sum|reflector_items_per_watch|reflector_items_per_watch_count|reflector_items_per_watch_sum|reflector_last_resource_version|reflector_list_duration_seconds_count|reflector_list_duration_seconds_sum|reflector_lists_total|reflector_short_watches_total|reflector_watch_duration_seconds|reflector_watch_duration_seconds_count|reflector_watch_duration_seconds_sum|reflector_watches_total|rest_client_request_latency_seconds_bucket|rest_client_request_latency_seconds_count|rest_client_request_latency_seconds_sum|ssh_tunnel_open_count|ssh_tunnel_open_fail_count|storage_operation_duration_seconds_bucket|storage_operation_duration_seconds_count|storage_operation_duration_seconds_sum|storage_operation_errors_total|volume_manager_total_volumesapiserver_current_inflight_requests
          sourceLabels:
          - __name__
        ### The URL of the Metricstore. Format: https://{project}.{sls-endpoint}/prometheus/{project}/{metricstore}/api/v1/write.
        ### Replace the {sls-endpoint} variable with the Simple Log Service endpoint for the region where the project resides. For more information, see Endpoints.
        ### Replace the {project} variable with the project name, and replace the {metricstore} variable with the Metricstore name.
        url: https://sls-prometheus-test.cn-beijing.log.aliyuncs.com/prometheus/sls-prometheus-test/prometheus-raw/api/v1/write
Use Grafana to access the data that is collected by using Prometheus
Log on to Grafana.
In the left-side navigation pane, choose
 > Data Sources.
 On the Data Sources tab, click Add data source.
Move the pointer over the Prometheus card and click Select.
On the Settings tab, configure the parameters. The following table describes the parameters.
Parameter
Description
Name
Enter a name for the data source. Example: Prometheus-01.
HTTP
URL: Enter the URL of the Metricstore in the https://{project}.{sls-endpoint}/prometheus/{project}/{metricstore} format. The {sls-endpoint} variable specifies the Simple Log Service endpoint. For more information, see Endpoints. The {project} and {metricstore} variables specify the project and Metricstore that you created in the Simple Log Service console. Replace the values with actual values. In this example, the URL is https://sls-prometheus-test.cn-hangzhou.log.aliyuncs.com/prometheus/sls-prometheus-test/prometheus.
ImportantIf you use an Alibaba Cloud internal network, we recommend that you use an internal Simple Log Service endpoint.
To ensure secure transmission, you must use HTTPS.
Whitelisted Cookies: Add a whitelist. This parameter is optional.
Auth
Select only the Basic Auth check box.
Basic Auth Details
User: Enter the AccessKey ID of your Alibaba Cloud account.
Password: Enter the AccessKey secret of your Alibaba Cloud account.
We recommend that you use the AccessKey pair of a RAM user that has the read-only permissions on the Simple Log Service project. For more information, see Grant a RAM user the read-only permissions on a specified project.
Click Save&Test.
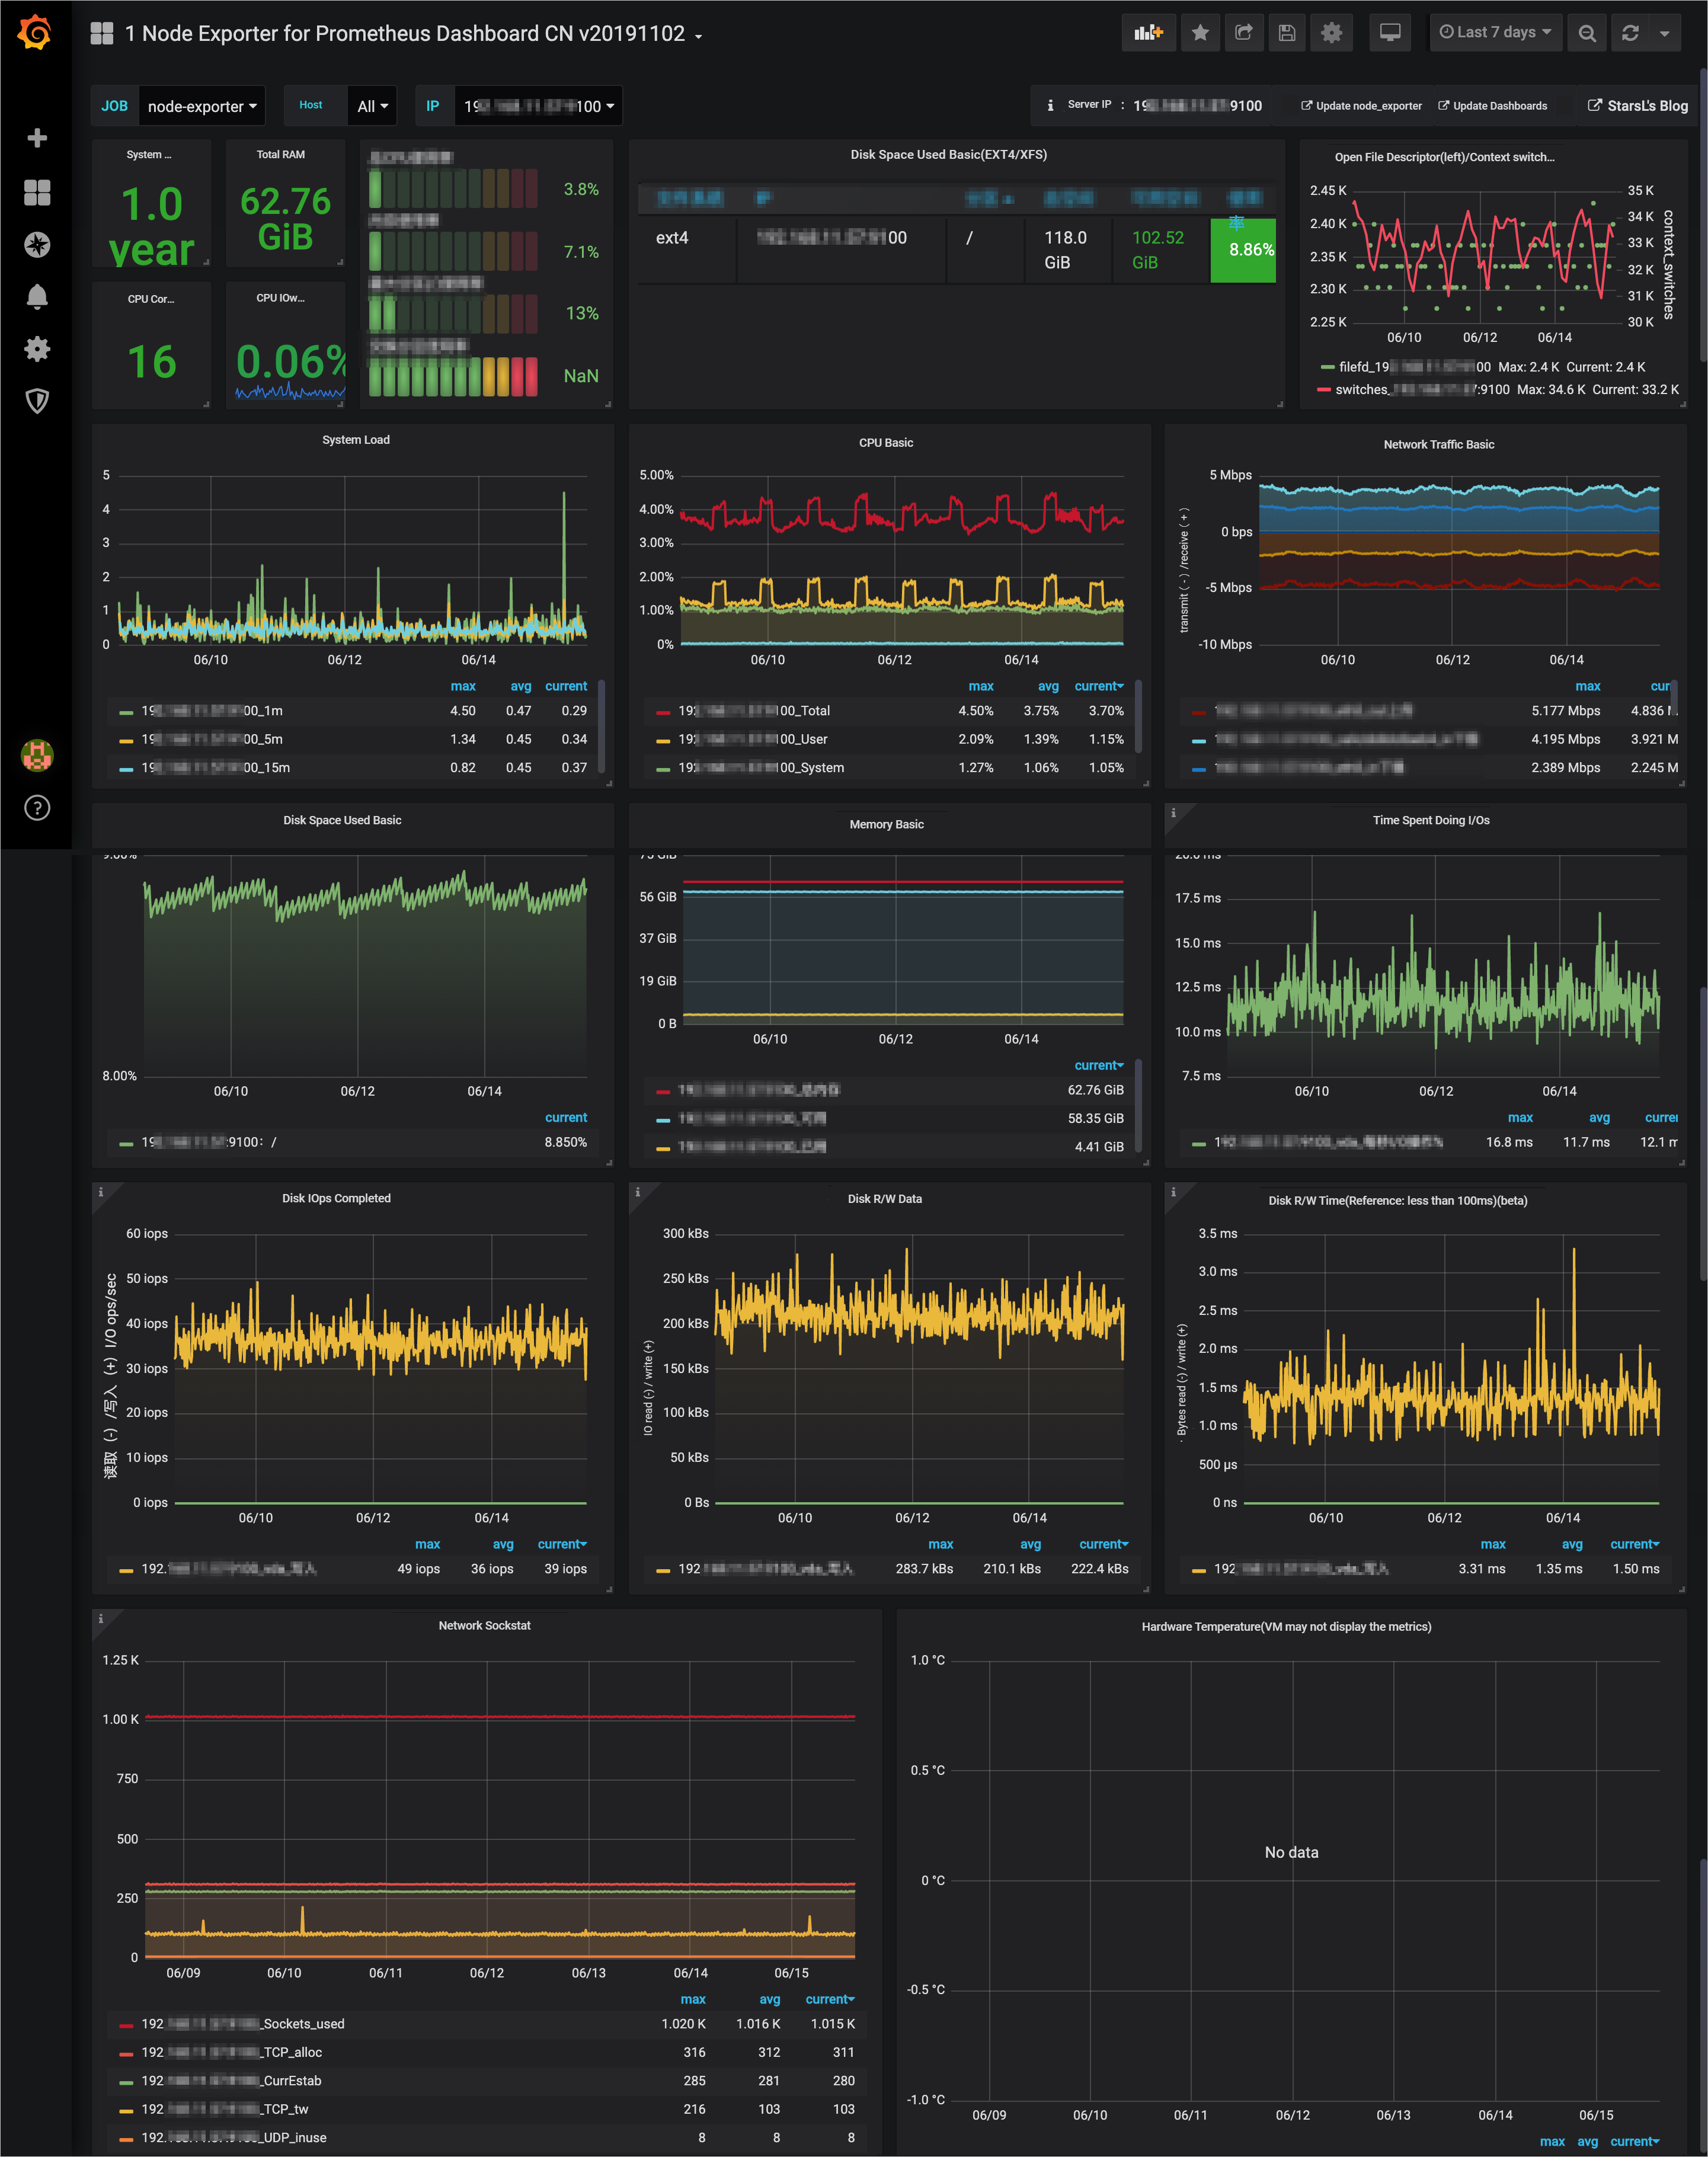
After you configure the settings, you can view the metric data in a dashboard of Grafana.