After you import trace data, you can query the trace data and configure settings to group statistics.
Procedure
Log on to the Simple Log Service console.
Go to the Trace Analysis page.
In the Log Application section, click Trace.
In the list of trace instances, click the instance that you want to manage.
In the left-side navigation pane, click Trace Analysis.
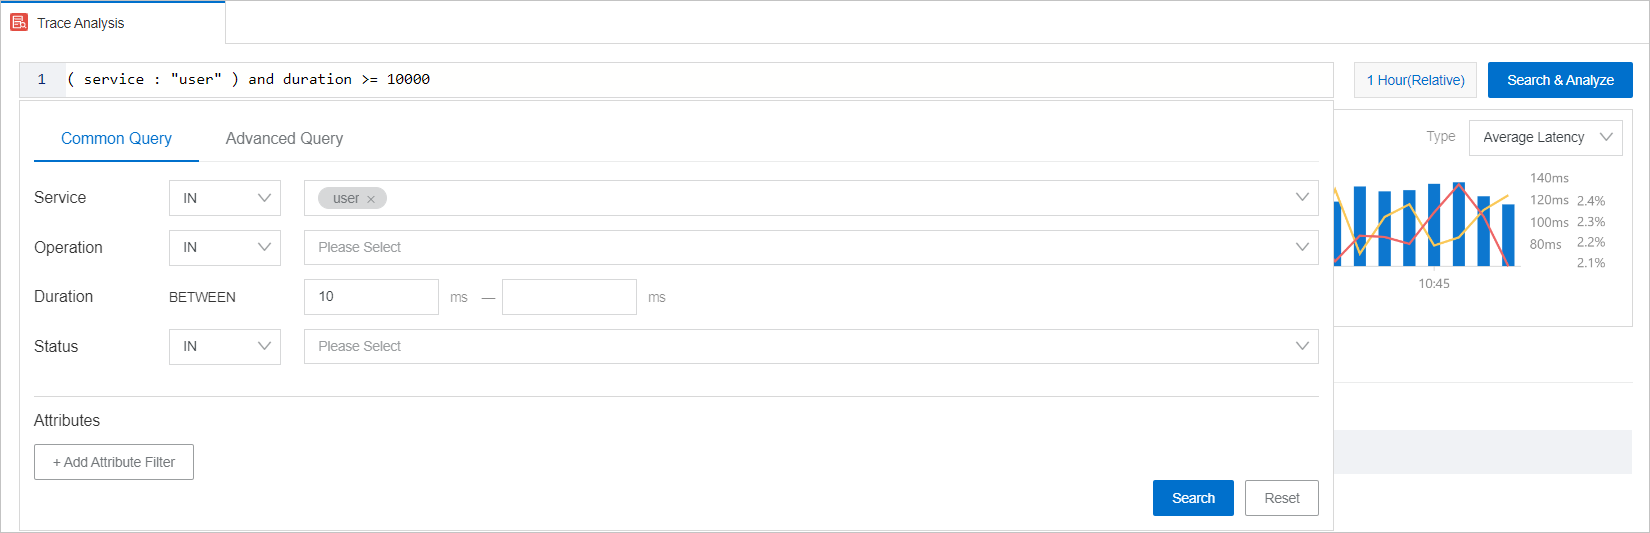
Configure query conditions, select a query time range, and then click Search & Analyze.
Simple Log Service provides preset query conditions for multiple fields, such as Service, Operation, Duration, Status, Attributes, and Resources. You need to only select options for the query conditions based on your business requirements. For more information about the fields, see Trace data formats.
NoteThe value of the Duration field in a query condition is measured in milliseconds. However, the unit of microseconds is actually used. For example, if you set the Duration field to 10 ms, the value is displayed as duration >= 10000 in a conditional expression for filtering.
By default, the value of the Duration field is a left-closed, right-open interval.
The Attributes and Resources fields are of the JSON object type. Simple Log Service allows you to filter data by field key and field value.
For example, if you want to query the trace data of the user service whose latency is greater than 10 ms within the previous hour, you can configure filter conditions based on the following figure.
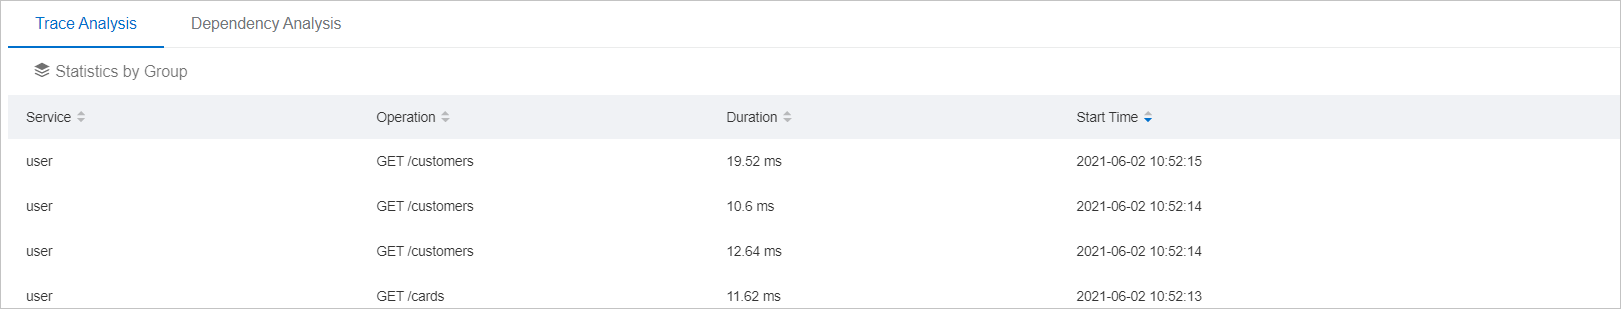
On the Trace Analysis tab, view the query results.
Configure settings to group statistics.
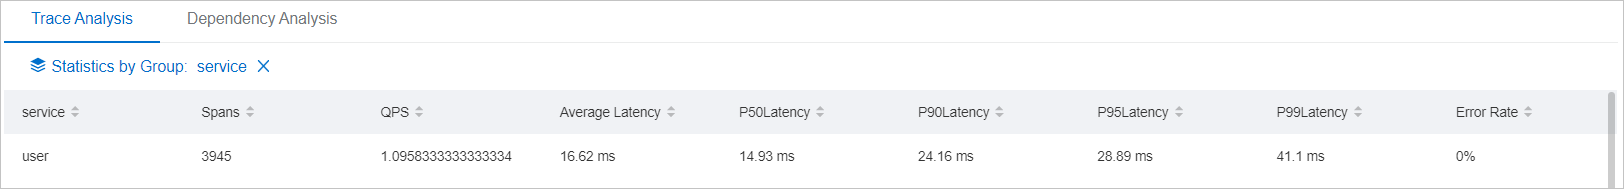
On the Trace Analysis tab, click Statistics by Group.
Select a field to group statistics. For example, select service.
View results.
Simple Log Service displays the information about each service, including Spans, QPS, and Average Latency.