Grafana provides a GUI that allows you to use the alerting feature. You can add a custom notification channel in Grafana so that Grafana can send alerts to the alerting system of Log Service. Then, the alerting system processes the alerts, such as denoising the alerts and sending alert notifications. If your Grafana version is earlier than 8.0, you can follow the instructions in this topic.
Prerequisites
Configure Grafana
- On the New Notification Channel page, configure the following parameters and click Save.
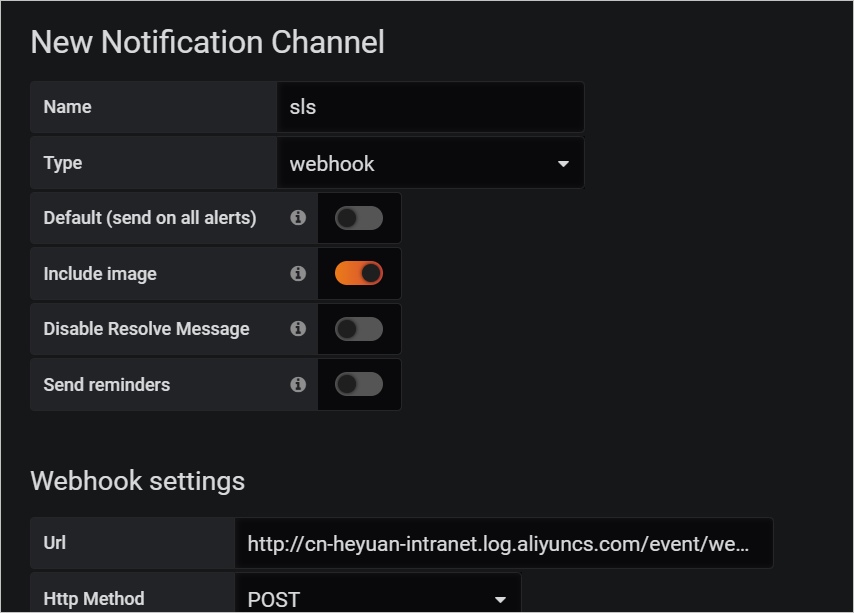
Parameter Description Name The name of the notification channel. Type The type of the notification channel. In this example, select webhook. Url The URL of the notification channel. In this example, enter the full URL of the webhook URL that is generated after you create an alert ingestion service and an alert ingestion application in the alert ingestion system of Log Service. For more information, see Obtain webhook URLs. Note If your Grafana server is deployed on an Elastic Compute Service (ECS) instance, we recommend that you select the region where the ECS instance resides and use an internal endpoint that is accessible over a LAN or virtual private cloud (VPC) when you configure the region information. If your Grafana server is not deployed on an ECS instance, you can use a public endpoint that is accessible over the Internet for a region.
Grafana alerts
The following sample code provides an example of a Grafana alert.
{
    "dashboardId": 1,
    "evalMatches": [
        {
            "value": 173.14285714285714,
            "metric": "go_gc_duration_seconds_count{instance=\"localhost: 9090\", job=\"prometheus\"}",
            "tags": {
                "__name__": "go_gc_duration_seconds_count",
                "instance": "localhost:9090",
                "job": "prometheus"
            }
        }
    ],
    "message": "sadfasdf",
    "orgId": 1,
    "panelId": 4,
    "ruleId": 2,
    "ruleName": "fuxasdfasd",
    "ruleUrl": "http://localhost:3000/d/biSKHC8Mz/new-dashboard-copy?tab=alert&viewPanel=4&orgId=1",
    "state": "alerting",
    "tags": {
        "severity" : "crit",
        "xasdfasdf": "mveonasdf"
    },
    "title": "[Alerting] fuxasdfasd"
}
Field mappings
After a Grafana alert is ingested into Log Service, the alert is converted to a Log Service alert based on field mappings. The following sample code provides an example of a Log Service alert:
{
    "aliuid": "{The ID of the Alibaba Cloud account to which the alert ingestion application belongs}",
    "alert_instance_id": "{The alert instance ID that is automatically generated}",
    "project": "{The project to which Alert Center belongs}",
    "region": "{The region of the project to which Alert Center belongs}",
    "alert_id": "2",
    "alert_type": "sls_pub",
    "alert_name": "sadfasdf",
    "next_eval_interval": 0,
    "alert_time": 1603859020,
    "fire_time": 1603859020,
    "resolve_time": 0,
    "status": "firing",
    "labels": {
        "xasdfasdf": "mveonasdf"
    },
    "annotations": {
        "__pub_alert_region__": "{The region of the endpoint to which the alert is sent}",
        "__config_app__": "sls_pub_alert",
        "__pub_alert_service__": "{The ID of the alert ingestion service}",
        "__pub_alert_app__": "{The ID of the alert ingestion application}",
        "__pub_alert_protocol__": "grafana",
        "severity" : "crit",
        "orgId": "1",
        "dashboardId": "1",
        "panelId": "4",
        "ruleUrl": "http://localhost:3000/d/biSKHC8Mz/new-dashboard-copy?tab=alert&viewPanel=4&orgId=1",
        "imageUrl": "",
        "desc": "sadfasdf",
        "title": "[Alerting] fuxasdfasd"
    },
    "severity": 10,
    "policy": {
        "alert_policy_id": "{The alert policy that is specified for the alert ingestion application}",
        "action_policy_id": "{The action policy that is specified for the alert ingestion application}",
        "repeat_interval": "{The repeat interval that is specified for the alert ingestion application}"
    },
    "drill_down_query": "http://localhost:3000/d/biSKHC8Mz/new-dashboard-copy?tab=alert&viewPanel=4&orgId=1",
    "results": [{
        "query": "go_gc_duration_seconds_count{instance=\"localhost: 9090\", job=\"prometheus\"}",
        "fire_result": {
            "__name__": "go_gc_duration_seconds_count",
            "instance": "localhost:9090",
            "job": "prometheus",
            "value": "173.142",
        }
    }]
}
The following table describes the mappings between Log Service fields and Grafana fields.
| Log Service field | Grafana field | Description |
|---|---|---|
| aliuid | None | The ID of the Alibaba Cloud account to which the alert ingestion application belongs. |
| alert_id | ruleId | The ID of the alert monitoring rule. |
| alert_type | None | The type of the alert. The value is fixed as sls_pub. |
| alert_name | ruleName | The name of the alert monitoring rule. |
| status | state | The status of the alert.
|
| next_eval_interval | None | The interval at which the alert is evaluated. The value is fixed as 0. |
| alert_time | None | The time at which Log Service receives the Grafana alert. |
| fire_time | None | The time at which Log Service receives the Grafana alert. |
| resolve_time | None | The time at which the alert is cleared. The value is fixed as 0. |
| labels | tags | The labels of the alert.
|
| annotations | None | After the Grafana alert is ingested into Log Service, the following fields are added
to the annotations field in the Log Service alert:
If you add an annotation on the Enrichment tab when you create the alert ingestion application, the annotation is added to the
annotations field.
Note If the key of the annotation that is specified on the Enrichment tab is the same as a field in the tags field of the Grafana alert, the annotation on the Enrichment tab prevails.
|
| severity | severity | The severity level of the alert. For more information, see Severity levels. |
| policy | None | The alert policy that is specified for the alert ingestion application. For more information, see Description of the policy variable. |
| project | None | The project to which Alert Center belongs. For more information, see Project. |
| drill_down_query | ruleUrl | The value of the ruleUrl field in the Grafana alert is displayed in the drill_down_query field in the Log Service alert. |
| results | evalMatches | The result set. Each element in evalMatches is mapped to a QueryData structure in the results field. For more information about the mappings, see Table 1. For more information about the results field, see Description of the results variable. |
| QueryData structure | evalMatches field | Description |
|---|---|---|
| query | metric | The query statement. |
| fire_result | tags and value | The tags field in the Grafana alert is expanded into key-value pairs, which are stored in
the fire_result field. The value field is stored in the fire_result field.
The value of the value field is rounded to the third decimal place. |