This topic describes how to configure a timeline chart to display query results.
Background information
A timeline chart records one or more events in chronological order. You can view data at specific points in time. The data points in a timeline chart are continuous, and the event data is accurate.
For more information about the entry point to add a timeline chart, see Add a chart (Pro) to a dashboard.
General Configurations
On the General Configurations tab, you can configure global settings for a timeline chart.
Basic Configurations
Parameter
Description
Title
The title of the chart.
Display Title
If you turn on Display Title, the title of the chart is displayed.
Display Border
If you turn on Display Border, the borders of the chart are displayed.
Display Background
If you turn on Display Background, the background color of the chart is displayed.
Display Time
If you turn on Display Time, the query time range of the chart is displayed.
Fixed Time
If you turn on Fixed Time, the query time range of the chart is independent of the global time range of the dashboard.
Standard Configurations
Parameter
Description
Format
The display format of numeric values.
Unit
The unit of numeric values.
Number of Digits after Decimal Point
The decimal places of numeric values.
Display Name
The name of the display field.
If you specify a value for Display Name, the value is used as the names for all display fields in the chart. If you want to change the name of a display field, you must configure parameters on the Field Configuration tab.
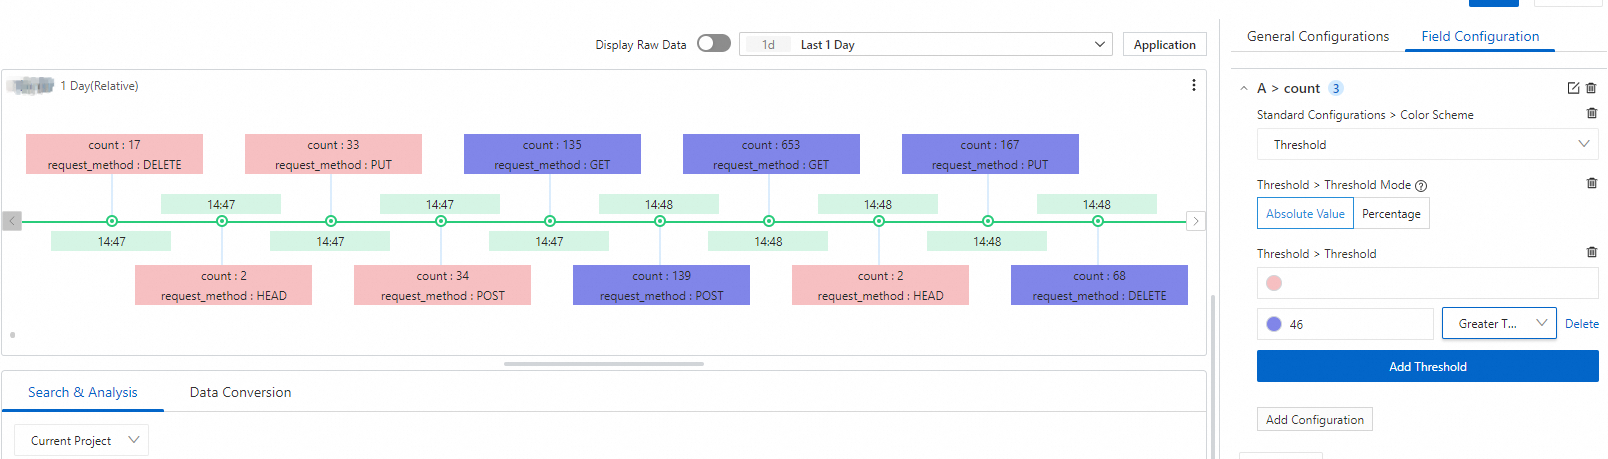
Color Scheme
The color scheme of the chart.
Built-in: uses the built-in color scheme.
Solid: uses the color that you select.
Threshold: uses different colors for different values based on the specified thresholds for the values.
Timeline Configurations
Parameter
Description
Data Column
The number of events that you want to display on the chart.
Alternate Display
The switch of alternate display. If you turn on Alternate Display, the time values and display field values are separately displayed.
Query and Analysis Configurations
Parameter
Description
Axis X Field
Select a field as the x-axis.
Simple Log Service automatically selects a field as the x-axis.
Axis Y Field
Select a field as the y-axis.
Simple Log Service automatically selects a field as the y-axis.
Prompt Column
Select the field that you want to display when you hover on the chart.
Threshold
Parameter
Description
Threshold Mode
The display mode of the thresholds.
Threshold
The thresholds of numeric values.
If you set Color Scheme to Threshold and specify thresholds for numeric values in the Threshold section, the values in the chart are displayed in different colors based on the specified thresholds.
Value Mapping
Parameter
Description
Value Mapping
The settings of value mapping. You can replace values in the chart with text or icons.
For example, if you set Value to 200, Mapping Type to Text, and Mapping Value to Success, all values of 200 in the chart are replaced with Success.
Documentation
Parameter
Description
Add Documentation Link
The button that allows you to specify custom document links and descriptions. After you configure the settings, the specified information is displayed in the upper right corner of the chart.
Field Configuration
On the Field Configuration tab, you can configure personalized display settings for the results of a single query statement or for a single column of data in the results. or more information, see Field Configuration.
For example, you can select A > count to configure settings for the count field in the query results of Statement A. Then, set Standard Configurations > Color Scheme to Threshold and configure thresholds and colors for the count field.