Before you use charts to visualize the results of query statements, you can configure data conversion rules to process the results. For example, you can configure a rule to merge the results of multiple query statements or classify the results of a query statement.
Only charts (Pro) support data conversion. For more information about the charts (Pro) supported by Simple Log Service, see Chart types.
Each data conversion rule has a unique ID. The ID is composed of an uppercase letter T and another uppercase letter. Examples: TA and TB.
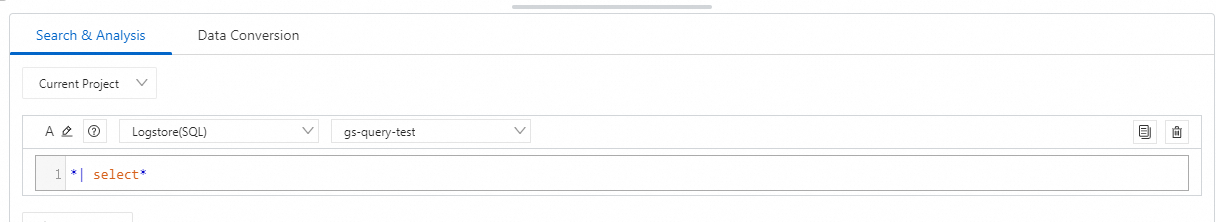
Before you can configure a data conversion rule, you must execute a query statement. For more information, see Query and analysis.
Types of data conversion rules
You can configure data conversion rules when you create a chart. The following types of data conversion rules are supported: Connect, Category, Parse Timestamp, Group By, and Transpose Rows and Columns.
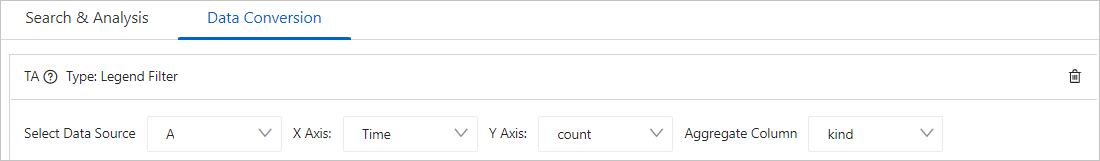
Category: groups the results of a query statement based on specified fields and performs calculation for each group. The following table describes the parameters. For more information, see Example for Category.
Parameter
Description
Select Data Source
Select the query statement whose results you want to classify. For example, if you select A, the results of Query Statement A are classified.
X-axis
Select a field as the x-axis.
Y-axis
Select a field as the y-axis.
Aggregate Column
Select a field based on which you want to further classify and aggregate data. For example, if you select the kind field, the system further classifies and aggregates data based on the kind field.
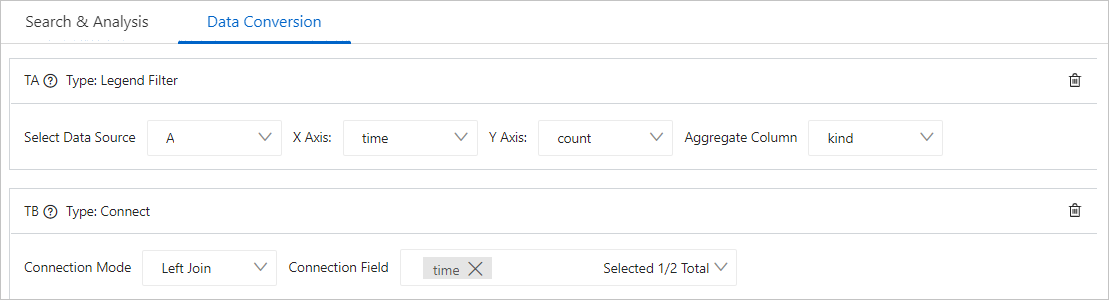
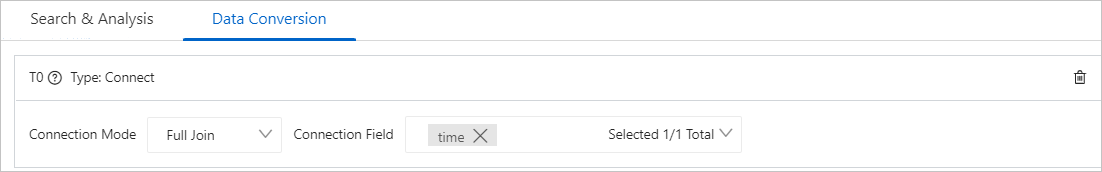
Connect: merges the results of multiple query statements by using Left Join, Right Join, or Full Join and displays the merged results in the chart. The following table describes the parameters. For more information, see Example for Connect.
Parameter
Description
Connection Mode
Select a method to merge the results of the query statements that you specify.
Connection Field
Select a field that exists in all results of the query statements to merge the results.
Example for Connect
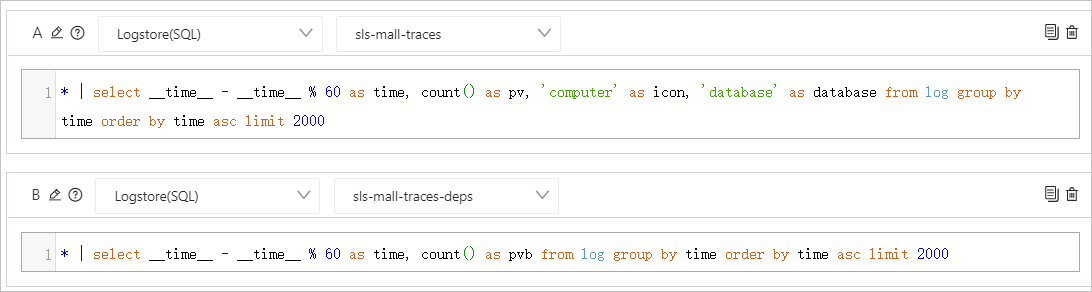
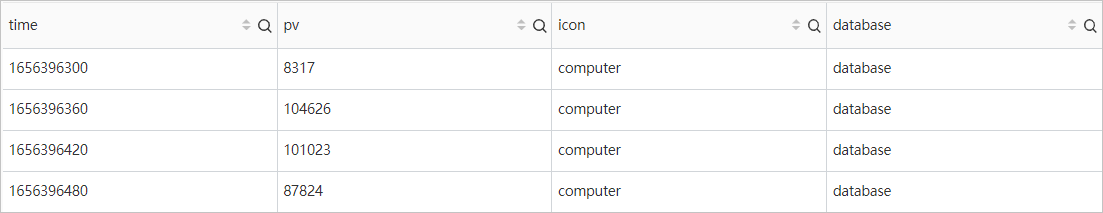
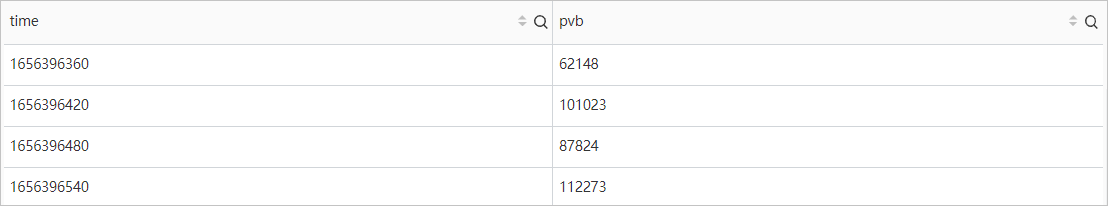
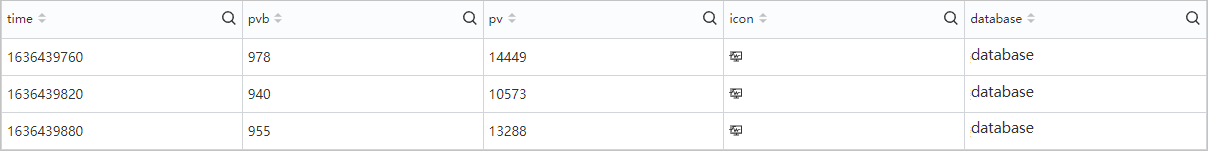
Query Statements A and B are executed, and the results of the statements are returned. The time field exists in both results. The time field can be used for Left Join to merge the results of the query statements and display the merged results in a table.
Query statements
Results of Query Statement A
Results of Query Statement B
Data conversion configuration
Data conversion results
Example for Category
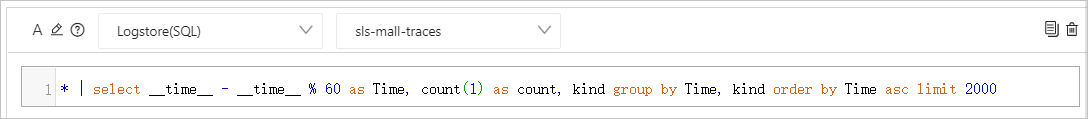
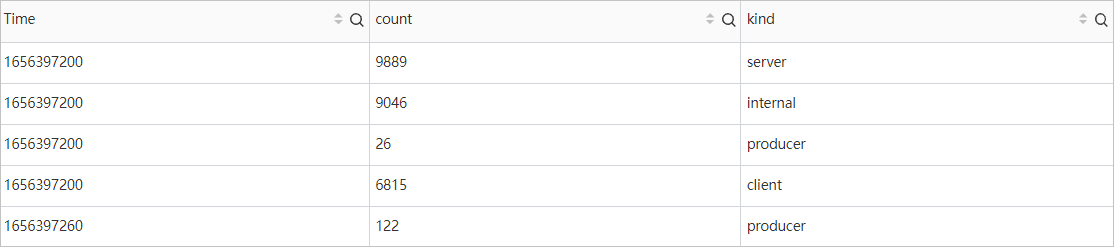
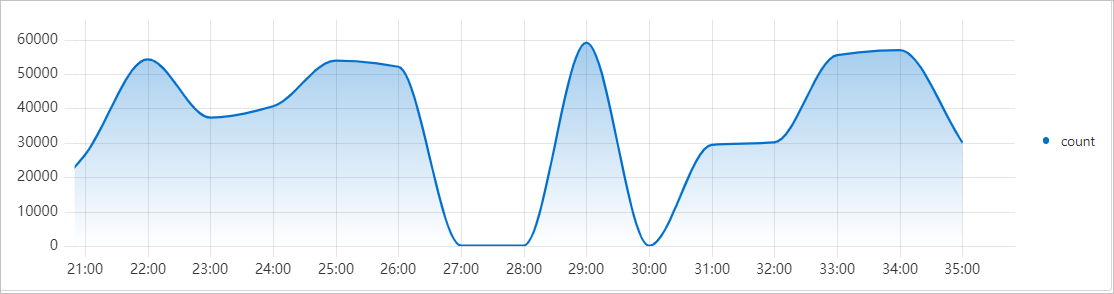
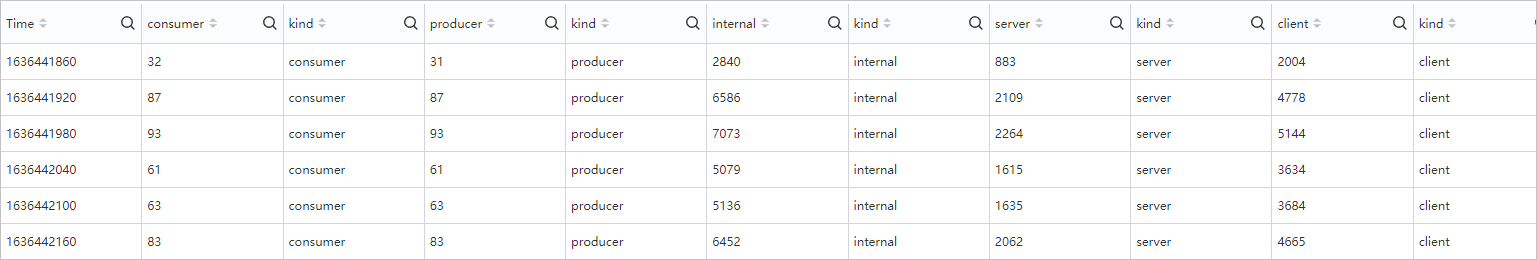
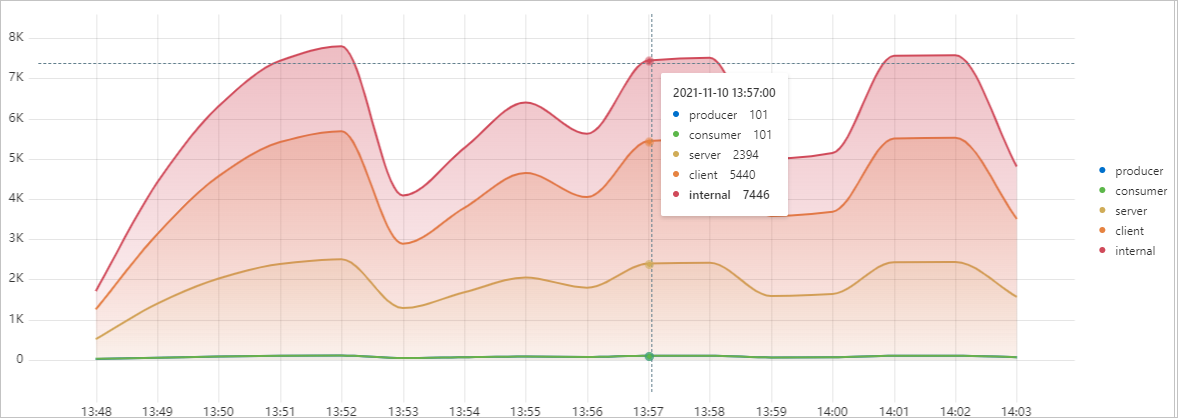
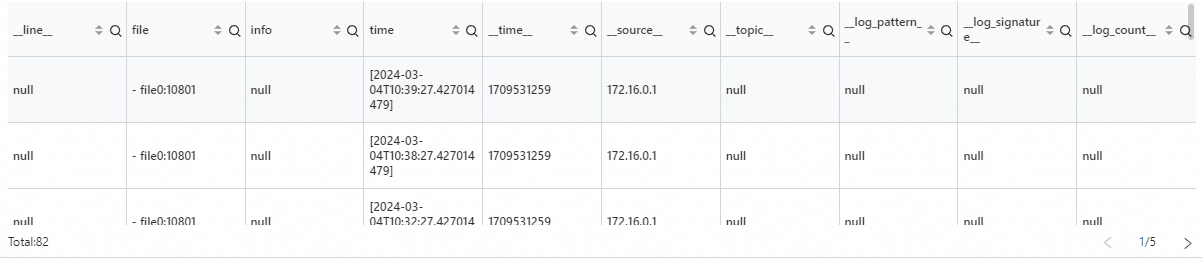
Query Statement A is executed to aggregate data and group the aggregated data based on the kind and time fields. If you use a line chart, only some of the query results are displayed. In this case, you can configure a data conversion rule of the Category type to further classify the query results into five categories based on the kind field. The field values are producer, consumer, server, client, and internal. After you configure the rule, the system can display the number for each category in a line chart.
Query statement
Query results before data conversion
Table
Line chart
Data conversion configuration
Query results after data conversion
Table
Line chart
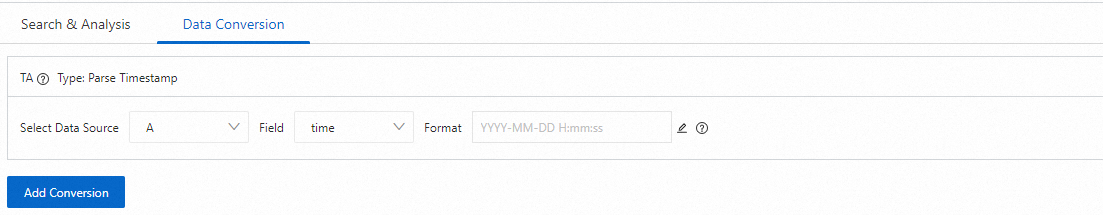
Example for Parse Timestamp
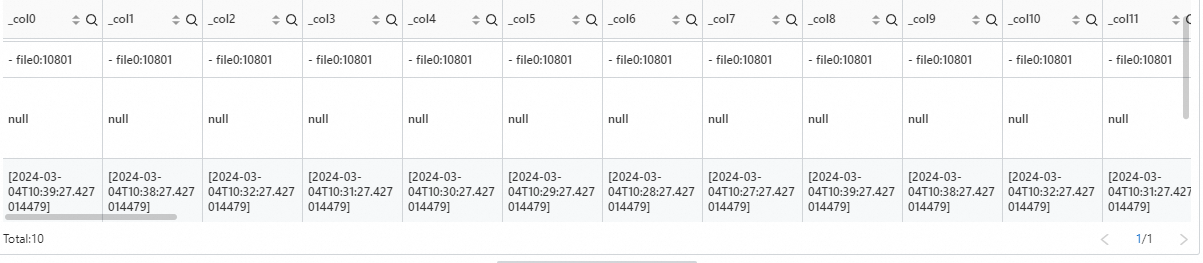
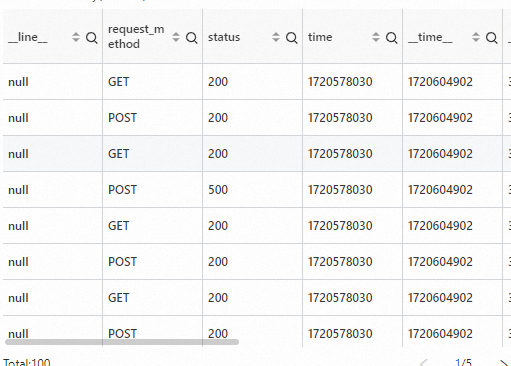
Query Statement A is executed, and the results of the statement are returned. You can configure a data conversion rule of the Parse Timestamp type to parse a specific field in the results of the statement into a UNIX timestamp.
Query statement
Results of Query Statement A
Data conversion configuration
Data conversion results
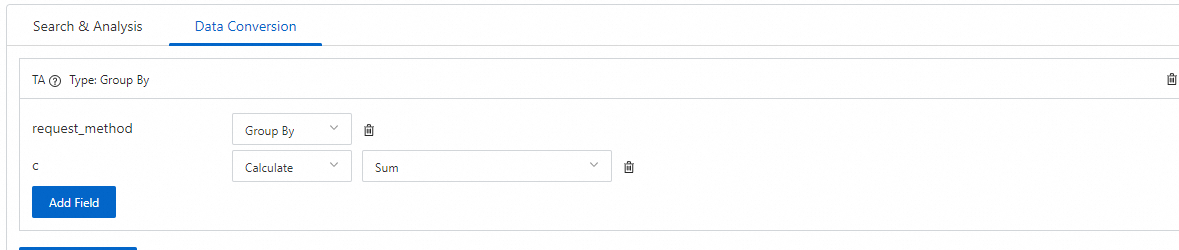
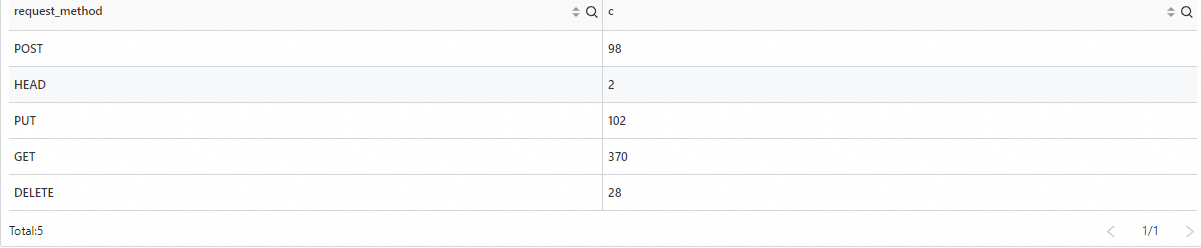
Example for Group By
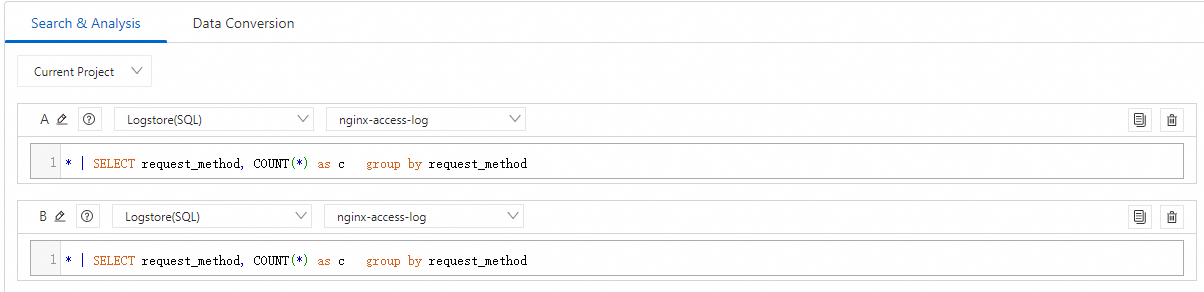
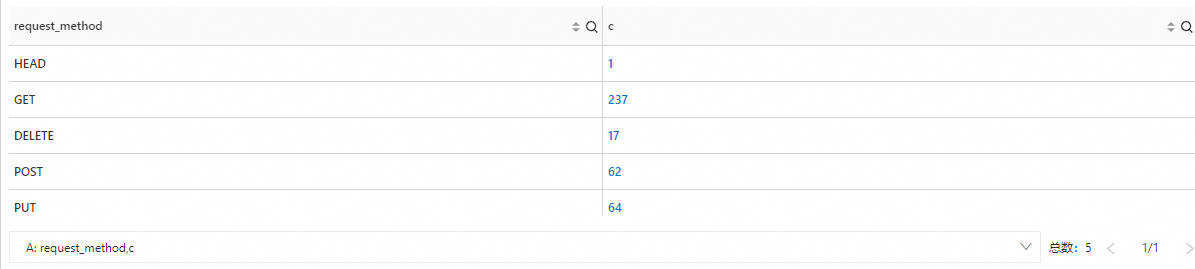
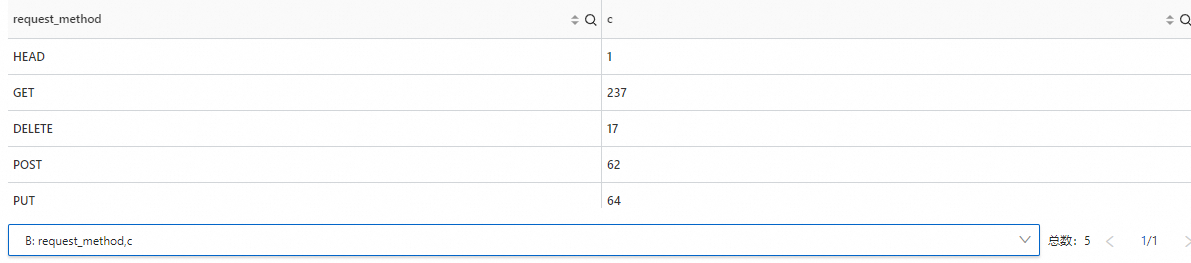
Query Statements A and B are executed, and the results of the statements are returned. The request_method field exists in both results. The request_method field can be used for Group By to merge the results of the query statements and display the merged results in a table.
Query statements
Results of Query Statement A
Results of Query Statement B
Data conversion configuration
Data conversion results
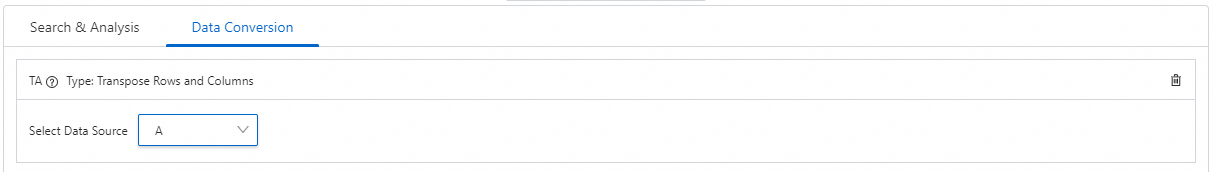
Example for Transpose Rows and Columns
Query Statement A is executed, and the results of the statement are returned. You can configure a data conversion rule of the Transpose Rows and Columns type to transpose the rows and columns in the results of the statement.
Query statement
Results of Query Statement A
Data conversion configuration
Data conversion results