LindormTSDB's index model makes tag-based and time-range queries fast by default, but field-only filters and unbounded time ranges can cause full table scans. Understanding which indexes exist — and which column types they do not cover — lets you write queries that stay within the indexed path.
How it works
Time series data is organized by time series. Each unique combination of tag column values identifies one time series and maps to a specific data source. If a value in a tag column changes, the affected record belongs to a different time series.

Query anti-patterns
Avoid these patterns to prevent slow queries:
| Anti-pattern | Why it's slow | What to do instead |
|---|---|---|
| Filter only on field columns | No index covers field columns — triggers a full table scan | Add at least one tag column filter and a time range filter |
| Very large time ranges | BRIN must scan many blocks; a large time range causes a large data scan, which results in lower query speed | Narrow the time range, or query pre-aggregated (downsampled) data |
| Redundant tag filters when one is more selective | Scanning broader tag ranges adds index-lookup overhead without narrowing the result | Keep only the most selective tag filter |
Query efficiently
Add tag and time range filters
Always include at least one tag column filter and a timestamp filter in your WHERE clause. A query with only field column filters has no index to use.
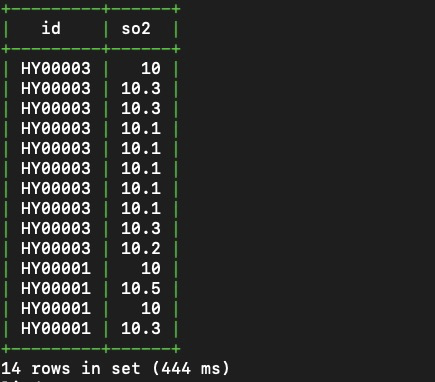
Example: Query all sulfur dioxide (SO2) values reported by devices in the Yuhang district between 2019-04-18 10:00:00 and 2019-04-18 10:30:00.
SELECT id, so2
FROM aqm
WHERE district = 'yuhang'
  AND time >= '2019-04-18 10:00:00'
  AND time < '2019-04-18 10:30:00';
The district filter uses the inverted index to resolve the matching time series. The time filter uses BRIN to skip irrelevant data blocks. Together, they avoid reading the entire table.
Use the most selective tag filter
When your WHERE clause filters on multiple tag columns and one tag identifies a smaller set of time series than another, keep only the more selective filter. Redundant broader filters add index-lookup overhead without narrowing the result set further.
For example, in the aqm table, id maps to a unique device (one time series), but city maps to many devices (many time series). If you filter on both, the city filter adds no selectivity once id is applied.
Query all distinct tag values
To list all distinct values in a tag column, use SELECT DISTINCT. LindormStore resolves this query using the inverted index created for that column — it does not perform a full table scan.
Example: List all device IDs in the aqm table.
SELECT DISTINCT(id) FROM aqm;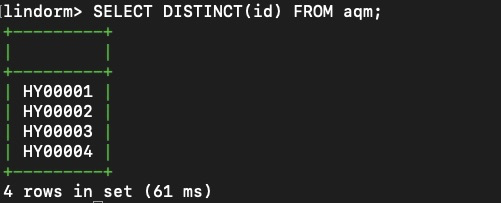
LindormStore queries tag column values based on the indexes created for all tag columns by default. However, an index-based query can be time consuming when data from a very large number of devices is stored in your time series table.
Downsample with SAMPLE BY
SAMPLE BY splits a time range into fixed-width intervals and applies an aggregate function to each. Use it when you need interval statistics rather than raw records — and to reduce data volume when querying long time ranges.
Example: Calculate average PM2.5 and SO2 values per 5-minute interval for the Yuhang district.
SELECT id, time, avg(pm2_5) AS avg_pm2_5, avg(so2) AS avg_so2
FROM aqm
WHERE district = 'yuhang'
  AND time >= '2019-04-18 10:00:00'
  AND time < '2019-04-18 10:30:00'
SAMPLE BY 5m;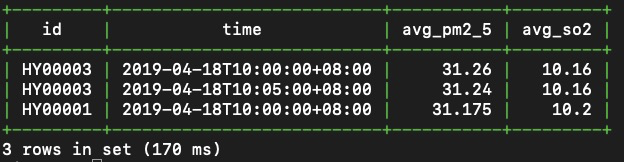
For more details on downsampling syntax and options, see Downsampling queries.
Aggregate across devices
Nest a SAMPLE BY subquery inside an outer GROUP BY to compute statistics across multiple devices or time series.
Example: Find the maximum of the per-interval average PM2.5 and SO2 values across all devices in the Yuhang district. The inner subquery computes per-interval averages with SAMPLE BY; the outer query aggregates across devices with max() and GROUP BY.
SELECT max(avg_pm2_5) AS max_avg_pm25, max(avg_so2) AS max_avg_so2
FROM (
  SELECT district, id, time, avg(pm2_5) AS avg_pm2_5, avg(so2) AS avg_so2
  FROM aqm
  WHERE district = 'yuhang'
    AND time >= '2019-04-18 10:00:00'
    AND time < '2019-04-18 10:30:00'
  SAMPLE BY 5m
)
GROUP BY district;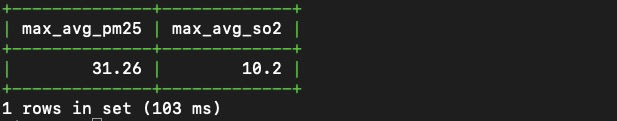
To try these examples yourself, download the SQL script with sample data from SQL script.