You can view the details of an instance in the IoT Platform console. The details include the basic information, resource usage, and security status of each device. This helps you manage the instance. This topic describes how to view the details of an instance.
Background information
For more information about IoT Platform instances, see Overview.
View the details of an instance
Log on to the IoT Platform console. In the upper-left corner, select the region in which the IoT instance resides.
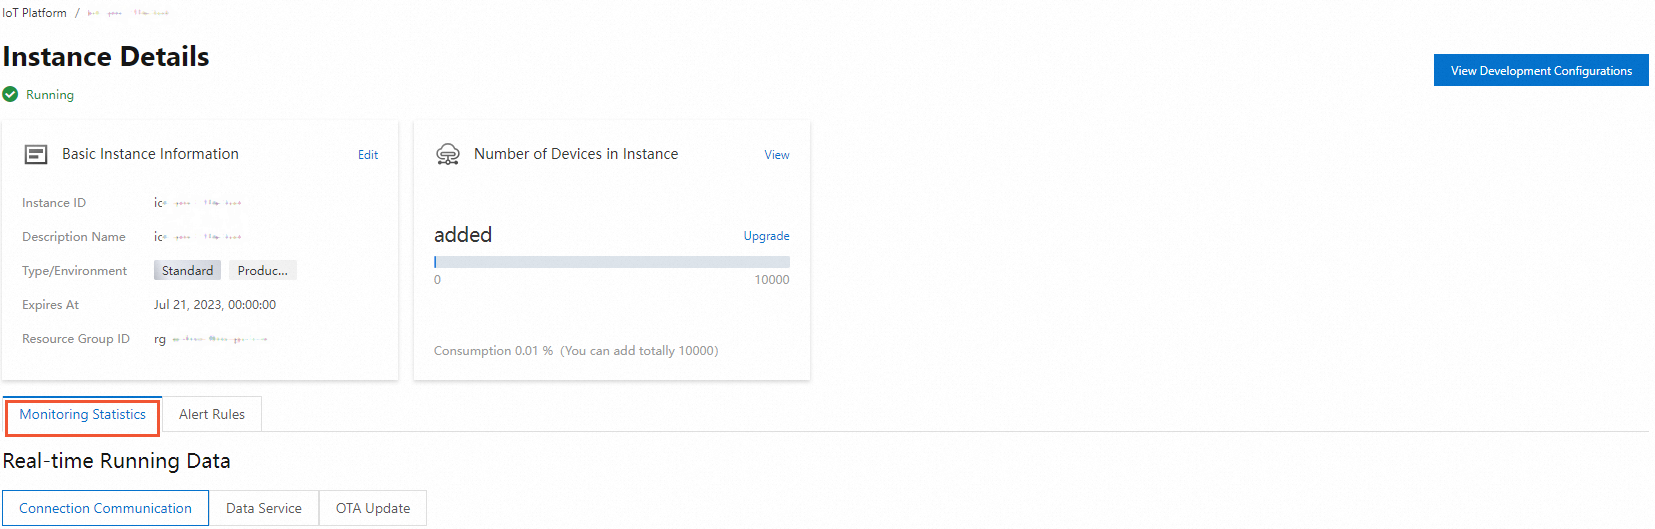
On the Overview tab, click the instance whose details you want to view. On the Instance Details page, you can view instance details, such as the basic information, number of online devices, real-time data, and instance specifications.
Add an alias for an instance
You cannot add an alias for a public instance of the previous version.
The instance ID is used as the default alias of an instance. You can change the alias of an Enterprise Edition instance on the Instance Details page.
In the Basic Instance Information section, click Edit.
In the Edit Instance Information dialog box, enter an alias in the Description Name field.
The alias can contain letters, digits, underscores (_), and hyphens (-). The alias cannot exceed 40 characters in length.
In the Edit Instance Information dialog box, you can also modify the Instance Environment parameter. For more information, see Change the tag value of an Enterprise Edition instance.
Click Save.
View the available resources of an instance
In the Real-time Running Data section on the Monitoring Statistics tab of the Instance Details page, click different tabs to view the resource usage of the instance by metric.
The Real-time Running Data section displays the statistics that are collected every minute on all online devices by metric. The following table describes the metrics and the metric data that are displayed for different types of instances. For information about the statistics on online devices, see the Number of real-time online devices and Number of online devices metrics in the following table.
NoteIf you use a public instance, the Real-time Running Data section displays the data of only the following metrics: Number of real-time online devices, TPS of Real-time Upstream & Downstream Messages, and Real-time Message Forwarding TPS.
Category
Supported instance type
Left-side chart: displays real-time data
Right-side chart: displays the trend in data changes
Communication
Standard Enterprise Edition and Exclusive Enterprise Edition
Number of real-time online devices: The system calculates the number of devices that are currently online.
The following online devices are counted: directly connected devices and sub-devices that use the Message Queuing Telemetry Transport (MQTT) protocol and devices that are connected by using cloud gateways.
Number of online devices: The system calculates the number of online devices every minute and displays the trend of the number of devices within a specific time range.
The following online devices are counted: directly connected devices and sub-devices that use the MQTT protocol and devices that are connected by using cloud gateways.
TPS of Real-time Upstream & Downstream Messages
TPS of Upstream & Downstream Messages
Real-time Message Forwarding TPS
Message Forwarding TPS
Data services
Standard Enterprise Edition and Exclusive Enterprise Edition
Real-time Time-series Data Storage IOPS
Time-series Data Storage IOPS
Real-time Time-series Data Storage Space
Time-series Data Storage Space
Real-time Data Processing Unit
Data Processing Unit
Real-time Offline Data Storage Space
Offline Data Storage Space
LinkVisual
Video
Public Bandwidth Consumption of Real-time Videos
Public Bandwidth Consumption of Videos
Storage Space Consumption of Real-time Videos
Storage Space Consumption of Videos
If the number of resources that are required by an Enterprise Edition instance exceeds the quota, Threshold Alert appears in the upper part of the Instance Details page. You can view or upgrade the resource specifications.
Click Upgrade next to a specification to upgrade the specification. For information about the specifications, see Purchase Enterprise Edition instances.
If the number of resources that are required by a public instance of the new version exceeds the quota, you must upgrade the public instance to an Enterprise Edition instance. For more information, see Upgrade the public instance of the new version to an Enterprise Edition instance.
If your public instance of the previous version consumes 90% or more of an item in the specification quota, the IoT Platform console reminds you to migrate data from the public instance to an Enterprise Edition instance. For more information, see Instance migration.
Click the Alert Rules tab to configure alert rules for instance metrics based on your business requirements.
NoteFor public instances of the previous version, you must go to the page and create an alert rule. For more information, see Configure alert rules.
View the CU usage
Computing units (CUs) are consumed when you use the features of data services. You can view the CU usage of the features on the Instance Details page.
On the Instance Details page, view the CU usage.
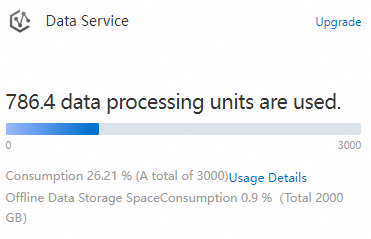
Click Usage Details in the Data Service card.
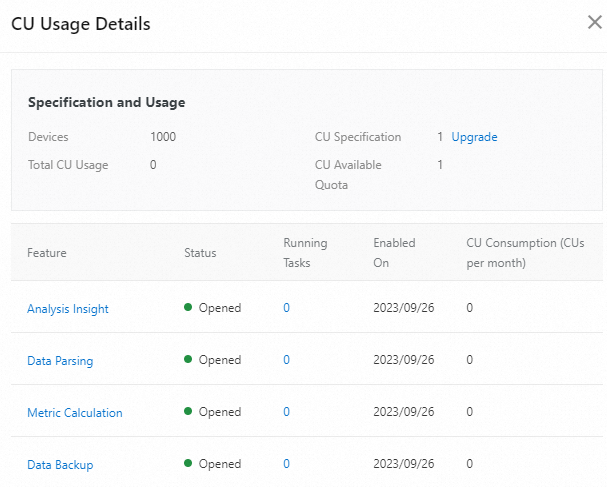
In the CU Usage Details panel, view the following information:
The number of devices that are connected to the IoT Platform instance, the CU specifications of the instance, and the CU usage.
The status, running tasks, activation date, and CU usage of the Analysis Insight, Data Parsing, Metric Calculation, and Data Backup features in data services.
NoteIf the total CU usage of all features is less than the CU specifications of your instance, a message appears above the feature list to remind you that the CU is insufficient. In the feature list, you are notified that the statistics features are disabled.
You can configure an alert rule to monitor the CU usage. This way, you can upgrade CU specifications at the earliest opportunity to ensure the availability of data services.
You can click the Upgrade icon next to CU Specification to purchase additional CUs. For more information, see Purchase Enterprise Edition instances.
References
For more information, see Manage the endpoint of an instance.