Function Compute provides instance-level metrics that allow you to view core metrics such as vCPU usage, memory usage, the network conditions of instances, and the number of requests that an instance concurrently processes. This topic describes the background information, definition, and details of instance-level metrics. This topic also describes how to enable collection of instance-level metrics.
Background information
Function Compute is a fully managed and event-driven computing service. You do not need to maintain compute clusters. However, you may encounter the following issues during code development and running:- How to view the vCPU usage in CPU-intensive scenarios.
- How to set an appropriate number of requests that a single instance can concurrently process.
- How to identify the cause of a function execution failure. Possible causes include code exceptions and instance performance exceptions.
The instance-level metrics provided by Function Compute can help you resolve the preceding issues and track the health status of instances in Function Compute.
What are instance-level metrics?
Instance-level metrics are performance metrics of instances used to execute functions. The instances are monitored and their performance metrics are collected in real time. The metrics are displayed in a visualized manner to provide you with end-to-end monitoring and troubleshooting paths for the instances.
- Function or function qualifier: the function-specific metrics of instances. For example, if Function A is executed by two instances at the same time, the function-specific vCPU metric is the maximum vCPU utilization of these two instances.
- Instance: the metrics of a specific instance.
- The qualifier indicates the version information that is passed in when a function is invoked. A qualifier can be a version number or an alias.
- Instances are dynamically created and reclaimed by Function Compute. Each instance exists only for a short period of time. You cannot manage instances.
Metrics
- Monitoring Center: The Monitoring Center module in Function Compute provides a built-in dashboard that displays instance-level metrics in a visualized manner. You can log on to the Function Compute console and view the following metrics in the dashboard on the Monitoring Center page:
- Metrics of instances that execute the same function
- Metrics of all instances
- Metrics of a specified instance
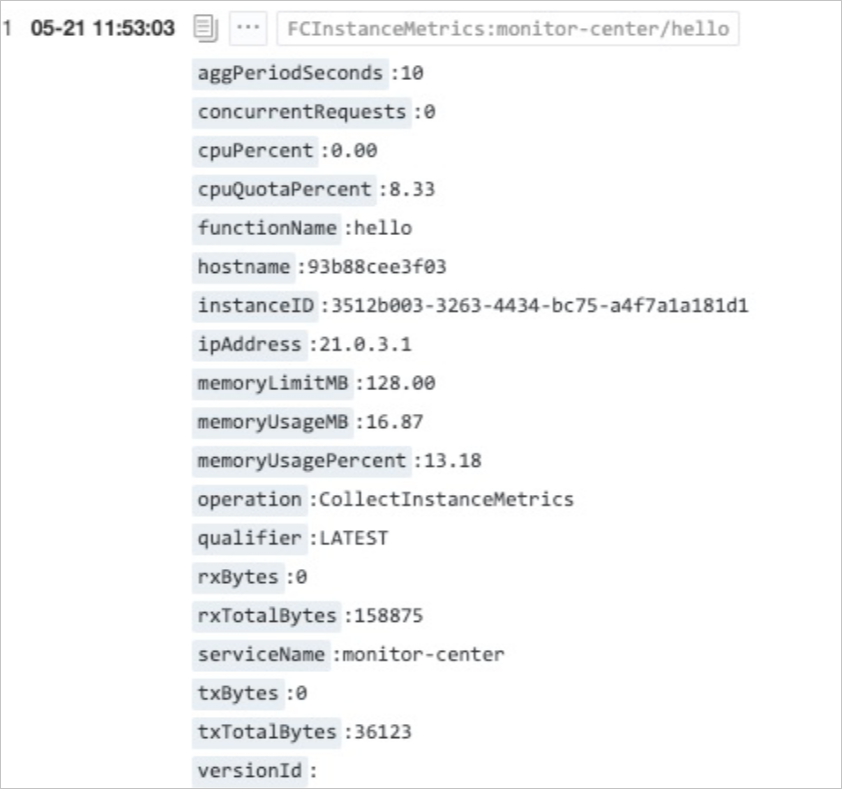
- Log Service: Function Compute imports instance-level metrics into Log Service. You can create a custom visual dashboard by using the analysis capabilities of Log Service. For more information, see Query and analyze logs. The instance-level metrics of each instance are recorded in logs at intervals. The following figure shows the format.
| Metric | Description | Example |
|---|---|---|
| cpuPercent | vCPU usage. The value indicates the number of used vCPUs and may exceed 100%. | 120% |
| cpuQuotaPercent | The maximum vCPU quota of the instance. You can flexibly configure the vCPU and memory specifications. The vCPU-to-memory ratio (vCPU:GB) must be from 1:1 to 1:4. | 50% |
| memoryUsageMB | The amount of memory used by the instance. Unit: MB. | 16.87 |
| memoryLimitMB | The maximum amount of memory that can be used by the instance. Unit: MB. | 1024 |
| rxBytes | The volume of data received by the instance in the time interval at which logs are generated. Unit: bytes. | 158 |
| txBytes | The volume of data sent by the instance in the time interval at which logs are generated. Unit: bytes. | 1598 |
| rxTotalBytes | The volume of data received by the instance since the instance was started. Unit: bytes. | 158875 |
| txTotalBytes | The volume of data sent by the instance since the instance was started. Unit: bytes. | 36123 |
| concurrentRequests | The number of requests that the instance currently processes. | 10 |
| hostname | The name of the host on which the instance runs. | 36123 |
- The value of the cpuQuotaPercent metric is theoretical. The value of the cpuPercent metric may exceed that of the cpuQuotaPercent metric. In this case, the instance preempts the resources of other instances on the same host.
- The communication between instances and system modules generates a small amount of traffic. Therefore, a small amount of sending and receiving traffic is generated even when no network access is performed within a function.
- The traffic of an instance represents only the inbound and outbound traffic of the instance. The Internet traffic and the private network traffic are counted together, and you cannot calculate the traffic fee based on this monitoring chart.
Enable collection of instance-level metrics
- Log on to the Function Compute console. In the left-side navigation pane, click Services & Functions.
- In the top navigation bar, select a region. On the Services page, find the desired service and click Configure in the Actions column.
- In the Log Settings section on the Modify Service page, enable Instance-level Metrics and click Save. Note If you do not enable the logging feature when you create a service, you must enable Logging in the Log Settings section and configure the related the parameters.