X-Pack Watcher provided by Alibaba Cloud Elasticsearch can track network activities, monitor metrics for infrastructure, index data, and cluster health status, and report alerts. You can obtain metrics related to the cross-cluster replication (CCR) feature in the Kibana console of an Elasticsearch cluster and use X-Pack Watcher to monitor the metrics and report alerts for exceptions. This topic describes how to use X-Pack Watcher to monitor CCR-related metrics and report alerts for exceptions. The monitoring and alerting are implemented based on the consumed time of data read requests received by the CCR feature and CCR checkpoints.
Prerequisites
An Alibaba Cloud Elasticsearch cluster is created. For more information, see Create an Alibaba Cloud Elasticsearch cluster.
NoteIn the original network architecture, X-Pack Watcher is available only for single-zone Elasticsearch clusters.
In the new network architecture, you need to configure private connections for Elasticsearch clusters to connect the clusters to the Internet. For more information, see Configure a private connection for an Elasticsearch cluster.
For more information about the network architecture, see [Notice] Network architecture adjustment.
X-Pack Watcher is enabled for the Elasticsearch cluster. By default, X-Pack Watcher is disabled. For more information, see Configure the YML file.
An Elastic Compute Service (ECS) instance is created in your virtual private cloud (VPC). For more information, see Create an instance by using the wizard.
NoteX-Pack Watcher cannot directly access the Internet and must use the internal endpoint of your Elasticsearch cluster to access the Internet. In this case, you can enable source network address translation (SNAT) for or associate an elastic IP address (EIP) with an ECS instance that is deployed in your VPC. This way, you can use the ECS instance as a proxy to forward requests. For more information, see Associate an EIP or Configure SNAT.
Procedure
Step 1: Configure a DingTalk chatbot
Create a DingTalk group that is used to receive alert notifications.
Click the
 icon in the upper-right corner of the chat window of the DingTalk group. In the Group Settings panel, click Bot.
 In the Robot Management panel, click Add Robot.
In the Robot dialog box, click Add Robot.
Click the Custom card. In the Robot details dialog box, click Add.
In the Add Robot dialog box, select Custom Keywords for Security Settings. In the field that appears, enter one or more keywords.
ImportantThe keywords must be included in the alert information you configured.
Read and agree to the terms of service, and click Finished.
Click Copy on the right side of Webhook to copy the webhook URL of the chatbot.
Keep the webhook URL for later use. In addition, you must keep the webhook URL confidential. If the webhook URL is leaked, risks may arise.
Step 2: Configure an NGINX proxy and configure a security group rule for the ECS instance
Configure an NGINX proxy on the ECS instance.
The NGINX proxy is used to forward alerts notifications. X-Pack Watcher sends alert notifications to the proxy, which then forwards the notifications to DingTalk or WeCom.
Install NGINX on the ECS instance.
Configure the nginx.conf file.
Replace the
serverconfiguration in the nginx.conf file with the following code:server { listen 8080;# The listening port. server_name localhost;# The domain name. index index.html index.htm index.php; root /usr/local/webserver/nginx/html;# The website directory. location ~ .*\.(php|php5)?$ { #fastcgi_pass unix:/tmp/php-cgi.sock; fastcgi_pass 127.0.0.1:9000; fastcgi_index index.php; include fastcgi.conf; } location ~ .*\.(gif|jpg|jpeg|png|bmp|swf|ico)$ { expires 30d; # access_log off; } location / { proxy_pass <Webhook URL of the DingTalk chatbot>; } location ~ .*\.(js|css)?$ { expires 15d; # access_log off; } access_log off; }Replace <Webhook URL of the DingTalk chatbot> with the webhook URL of the DingTalk chatbot that you configured to receive alert notifications.
Reload the NGINX configuration file and restart NGINX.
/usr/local/webserver/nginx/sbin/nginx -s reload            # Reload the NGINX configuration file.
/usr/local/webserver/nginx/sbin/nginx -s reopen            # Restart NGINX.
Configure a security group rule for the ECS instance.
The security group rule is used to allow the NGINX proxy on the ECS instance to receive alert notifications from the Elasticsearch cluster.
Log on to the ECS console.
In the left-side navigation pane, choose Instances & Images > Instances.
On the Instances page, find the ECS instance and click its name.
On the instance details page, click the Security Groups tab.
On the Security Groups tab, click the name of the desired security group.
On the Inbound tab of the Access Rule section, click Add Rule.
Configure the parameters.
Parameter
Description
Action
Select Allow.
Priority
Retain the default value.
Protocol Type
Select Custom TCP.
Port Range
Set this parameter to the port that you frequently use. In this example, port 8080 is used.
Authorization Object
Enter the IP addresses of all nodes in the Elasticsearch cluster.
NoteFor more information about how to obtain the IP addresses of the nodes, see View the basic information of nodes.
Description
The description of the rule.
Click Save.
Step 3: Configure a watch for alerting
- Log on to the Kibana console of your Elasticsearch cluster and go to the homepage of the Kibana console as prompted. For more information about how to log on to the Kibana console, see Log on to the Kibana console.Note In this example, an Elasticsearch V6.7.0 cluster is used. Operations on clusters of other versions may differ. The actual operations in the console prevail.
- In the left-side navigation pane of the page that appears, click Dev Tools.
On the Console tab of the page that appears, run the following command to create a watch.
PUT _watcher/watch/ccr_watcher
{
  "trigger": {
    "schedule": {
      "interval": "10s"
    }
  },
  "input": {
    "search": {
      "request": {
        "indices": [
          ".monitoring-es*"
        ],
        "body": {
          "size": 0,
          "sort": [
            {
              "timestamp": {
                "order": "desc"
              }
            }
          ],
          "query": {
            "bool": {
              "must": [
                {
                  "range": {
                    "timestamp": {
                      "gte": "now-10m"
                    }
                  }
                },
                {
                  "term": {
                    "type": {
                      "value": "ccr_stats"
                    }
                  }
                },
                {
                  "bool": {
                    "should": [
                      {
                        "range": {
                          "ccr_stats.time_since_last_read_millis": {
                            "gte": 600000
                          }
                        }
                      },
                      {
                        "script": {
                          "script": "long gap = doc['ccr_stats.leader_global_checkpoint'].value - doc['ccr_stats.follower_global_checkpoint'].value;\n            return gap>1000;"


                        }
                      }
                    ]
                  }
                }
              ]
            }
          },
          "aggs": {
            "NAME": {
              "terms": {
                "field": "ccr_stats.follower_index",
                "size": 1000
              }
            }
          }
        }
      }
    }
  },
  "condition": {
    "compare": {
      "ctx.payload.hits.total": {
        "gt": 0
      }
    }
  },
  "transform": {
    "script": """
    StringBuilder message = new StringBuilder();
for (def bucket : ctx.payload.aggregations.NAME.buckets) {
  message.append(bucket.key).append('  ')
}
    return [ 'delay_indices' : message.toString().trim()  ]
"""
  },
  "actions" : {
     "add_index": {
      "index": {
        "index": "ccr_delay_indices",
        "doc_type": "doc"
      }
    },
     "my_webhook": {
     "webhook" : {
        "method" : "POST",
        "url" : "http://<yourAddress>:8080",
        "body" : "{\"msgtype\": \"text\", \"text\": { \"content\": \"Please note: {{ctx.payload}}\"}}"
      }
    }
  }

}
The following table describes some key parameters used in the preceding code.
Parameter
Description
trigger
The interval at which checks are performed. Configure this parameter based on your business requirements. In this example, this parameter is set to 10s, which indicates that checks are performed at an interval of 10 seconds.
input.search.request.indices
The indexes that you want to query and check. The .monitoring-es* indexes store all metrics that are supported by an Elasticsearch cluster, including CCR-related metrics.
input.search.request.body
The request body. In this example, CCR-related metric information generated in the last 10 minutes is queried from the monitoring system. If one of the following conditions is met, the system determines whether to report an alert based on the value of the condition parameter:
ccr_stats.time_since_last_read_millis > 600000 ms (10 min): The latency at which a read request is sent to the leader index is greater than 10 minutes. Configure this parameter based on your business requirements.
ccr_stats.leader_global_checkpoint - ccr_stats.follower_global_checkpoint > 1000: The lag between the leader and the follower is greater than 1,000. Configure this parameter based on your business requirements.
condition
The condition to perform actions. In this example, alerts can be reported only if the conditions specified in the input.search.request.body parameter are met and the number of aggregated documents that are returned is greater than 0.
transform
The preprocessing method. In this example, the keys of buckets are obtained in loops and are separated by space. This way, the names of indexes on which latency occurs can be identified.
actions
The actions that are performed if the specified conditions are met. In this example, the following actions are specified:
add_index: Write the returned results to the index and define the index that is used to debug the watch configurations.
my_webhook: Send alert notifications by using the webhook URL.
<yourAddress>
The host address that is used to receive alert notifications.
If your Elasticsearch cluster is deployed in the new network architecture, set this parameter to the domain name of the endpoint. Requests are forwarded based on the domain name. For more information about how to obtain the domain name of an endpoint, see Configure a private connection for an Elasticsearch cluster.
If your Elasticsearch cluster is deployed in the original network architecture, set this parameter to one of the following items:
IP address of the NGINX proxy. In this case, requests are forwarded over the Internet by using the NGINX proxy that resides in the same VPC as the Elasticsearch cluster.
Webhook URL of the DingTalk chatbot.
body
You must configure this parameter based on the security settings of the DingTalk chatbot.
For example, in Step 1: Configure a DingTalk chatbot, Security Settings is set to Custom Keywords and the note keyword is specified. In this case, the DingTalk chatbot sends alert notifications only if the content field in the body parameter contains note.
NoteIf the error
No handler found for uri [/_xpack/watcher/watch/log_error_watch_2] and method [PUT]is returned after you run the preceding command, X-Pack Watcher is disabled for the Elasticsearch cluster. In this case, enable X-Pack Watcher and run the command again. For more information, see Configure the YML file.
Step 4: View the alert notifications
In normal cases, if the conditions specified in Step 3: Create a watch for alerting are met, alert notifications are sent to the DingTalk group, as shown in the following figure.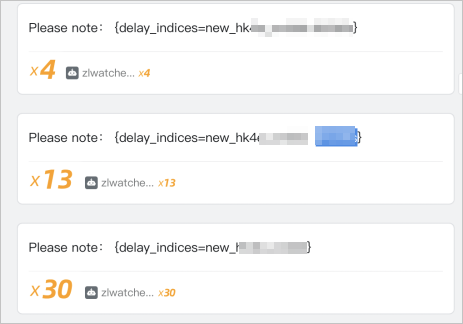
If you no longer require this watch, you can run the following command to delete the watch:
DELETE _xpack/watcher/watch/ccr_watcher