NetFlow is a network traffic analysis protocol that lets you monitor, analyze, and diagnose traffic in real time. This tutorial shows you how to set up a complete data collection pipeline: deploy a Fleet agent on an Elastic Compute Service (ECS) instance, use Fleet Server to manage the agent, and send NetFlow data to Kibana for analysis.
Key concepts
Term | Description |
Fleet | A centralized management solution in Elasticsearch for managing Fleet agents |
Fleet agent | A lightweight data collection agent that runs on various operating systems and collects multiple data types |
Fleet Server | A component that transfers data collected by a Fleet agent from a source server to Elasticsearch |
Prerequisites
Before you begin, ensure that you have:
An Alibaba Cloud Elasticsearch cluster (V8.5 is used in this example) — Create an Alibaba Cloud Elasticsearch cluster
An ECS instance in the same virtual private cloud (VPC) as the Elasticsearch cluster — Create an instance by using the wizard
The ECS instance serves as the source server. Fleet agent runs on it to collect NetFlow data.
Create an agent policy and add integrations
Step 1: Create an agent policy
Log on to the Kibana console of your Elasticsearch cluster. For more information, see Log on to the Kibana console.
Click the
 icon in the upper-left corner. In the left-side navigation pane, choose Management > Fleet.
On the Fleet page, click the Agent policies tab.
Click Create agent policy. In the Create agent policy panel, configure the policy:
Enter
netflow-login the Name field.Clear Collect system logs and metrics.
Click Advanced options. In the Agent monitoring section, clear Collect agent logs and Collect agent metrics.
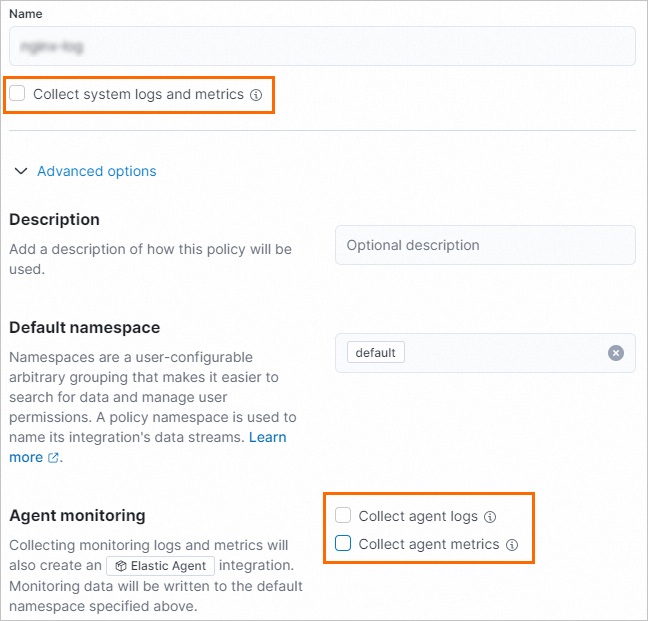
This tutorial only collects NetFlow Records logs, so system logs, agent logs, and agent metrics are not needed.
Click Create agent policy.
Step 2: Add a Fleet Server integration
On the Agent policies tab, find the netflow-log policy and click its name.
On the Integrations tab, click Add integration.
On the Browse integrations tab, search for
Fleet Server, then click the Fleet Server card.Install the Fleet Server integration:
On the Fleet Server page, click the Settings tab.
Click Install Fleet Server assets. In the confirmation dialog, click Install Fleet Server.
After installation, the integration version appears on the Settings tab.
In the upper-right corner of the Fleet Server page, click Add Fleet Server.
On the Add Fleet Server integration page:
In the Configure integration section, enter a name in the Integration name field.
In the Where to add this integration section, select
netflow-logfrom the Agent policy drop-down list.
Click Save and continue. In the confirmation message, click Add Elastic Agent later.
Step 3: Add a NetFlow Records integration
On the Integrations tab of the netflow-log agent policy, click Add integration.
On the Browse integrations tab, search for
NetFlow Records, then click the NetFlow Records card.Install the NetFlow Records integration:
On the NetFlow Records page, click the Settings tab.
Click Install NetFlow Records assets. In the confirmation dialog, click Install NetFlow Records.
After installation, the integration version appears on the Settings tab.
In the upper-right corner of the NetFlow Records page, click Add NetFlow Records.
On the Add NetFlow Records integration page, configure the integration:
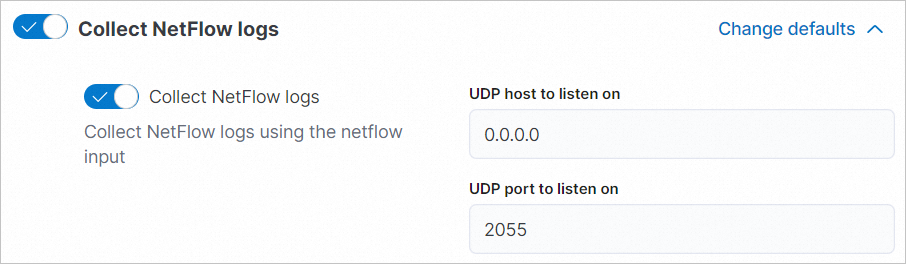
In the Configure integration section, enter
netflow-1in the Integration name field.Click Change defaults next to Collect NetFlow logs. Set the following values:
Field
Value
Description
UDP host to listen on
0.0.0.0Listens on all network interfaces
UDP port to listen on
2055Keep the default; softflowd sends to this port
On the Existing hosts tab of the Where to add this integration section, select
netflow-logfrom the Agent policy drop-down list.
Click Save and continue. In the confirmation message, click Add Elastic Agent later.
Add a Fleet agent and start NetFlow
Step 1: Configure Fleet Server host and output
Log on to the Kibana console. For more information, see Log on to the Kibana console.
Click the
icon in the upper-left corner. In the left-side navigation pane, choose Management > Fleet.On the Fleet page, click the Settings tab.
Configure the Fleet Server host:
In the Fleet server hosts section, click Edit hosts.
In the Fleet Server hosts panel, enter the host URL in the Specify host URL field. Use the format
https://<private-IP-of-ECS>:<port>, for examplehttps://172.16.*.***:8220.Enter the primary private IP address of your ECS instance. For details on Fleet Server host settings, see Fleet Server hosts.
Click Save and apply settings. In the confirmation dialog, click Save and deploy.
Configure the output to point to your Elasticsearch cluster:
In the Outputs section, click the
 icon in the Actions column.
In the Edit output panel, enter the internal endpoint URL of your Elasticsearch cluster in the Hosts field. Use the format
http://<internal-endpoint>:<port>, for examplehttp://es-cn-uqm3auln80001****.elasticsearch.aliyuncs.com:9200.Click Save and apply settings. In the confirmation dialog, click Save and deploy.
Step 2: Add a Fleet agent
To collect NetFlow traffic from multiple source servers, repeat this step for each server. Each Fleet agent collects data from its respective source server, and Fleet Server manages all agents centrally.
Click the
icon in the upper-left corner. In the left-side navigation pane, choose Management > Fleet.On the Fleet page, click the Agent policies tab.
Find the netflow-log agent policy, click the
 icon in the Actions column, and select Add agent.
On the Enroll in Fleet tab of the Add agent panel, click Add Fleet Server. In the Add a Fleet Server panel, click Advanced. In the Select a policy for Fleet Server section, keep the default value
netflow-log.In the Choose a deployment mode for security section, keep the default Quick start.
In the Add your Fleet Server host section, click Add host.
In the Generate a service token section, click Generate service token.
In the Install Fleet Server to a centralized host section, copy the generated command and run it on the ECS instance. If
Successfullyappears in the output, Fleet agent is installed and running on the ECS instance.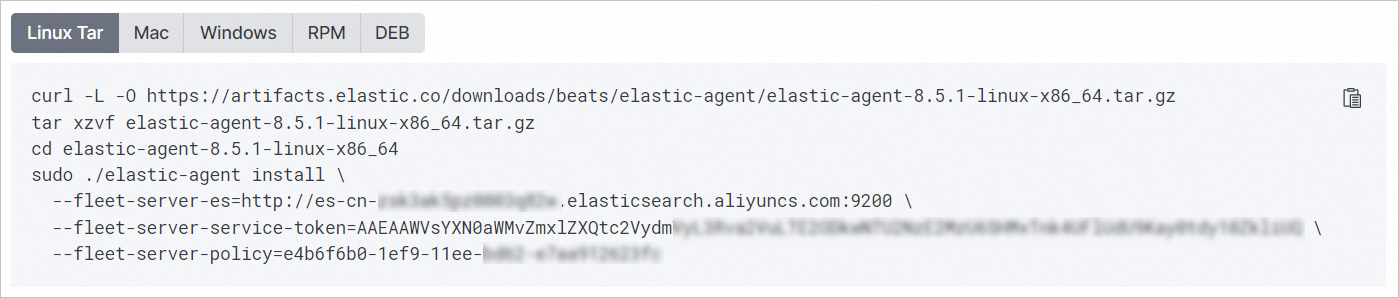
Step 3: Configure the NetFlow service
This tutorial uses softflowd to generate NetFlow traffic data. Run the following commands on the ECS instance.
Download the softflowd source package:
wget https://storage.googleapis.com/google-code-archive-downloads/v2/code.google.com/softflowd/softflowd-0.9.9.tar.gzInstall the libpcap development library (required for packet capture):
yum install libpcap-develBuild and install softflowd:
tar -xvf softflowd-0.9.9.tar.gz
cd softflowd-0.9.9
./configure
make
make install
Start softflowd:
Flag
Value
Description
-v9Use NetFlow version 9
-D—
Run as a daemon
-ieth0Capture traffic on the eth0 interface
-tmaxlife=1Export flows after a maximum lifetime of 1 minute
-nlocalhost:2055Send NetFlow records to port 2055 (matches the integration config)
nohup softflowd -v 9 -D -i eth0 -t maxlife=1 -n localhost:2055 >/dev/null 2>&1 &The following table explains the key flags:
View the collected data
After the pipeline is running, use any of the following methods to verify that NetFlow data is being collected.
Method 1: View data in dashboards
Click the
icon in the upper-left corner. In the left-side navigation pane, choose Management > Fleet.On the Fleet page, click the Data streams tab to see collected NetFlow log data in the dataset list.
Find the desired dataset, click the
icon in the Actions column, and select View Dashboards. Select a dashboard to explore, for example [Logs Netflow] Overview.
Method 2: Explore data in Discover
Click the ![]() icon in the upper-left corner. In the left-side navigation pane, choose Analytics > Discover. On the Discover page, browse the data in the destination index.
icon in the upper-left corner. In the left-side navigation pane, choose Analytics > Discover. On the Discover page, browse the data in the destination index.
Method 3: Query data from Dev Tools
Click the
icon in the upper-left corner. In the left-side navigation pane, choose Management > Dev Tools.On the Console tab, run the following query:
GET logs-netflow.log-default/_search