Alibaba Cloud Logstash allows you to specify a keyword and a time range in the Elasticsearch console to query specific logs of your Logstash cluster. The logs help you identify cluster issues and perform cluster O&M in an efficient manner. This topic describes how to query logs and describes common types of logs.
Procedure
Go to the Logstash Clusters page of the Alibaba Cloud Elasticsearch console.
Navigate to the desired cluster.
In the top navigation bar, select the region where the cluster resides.
On the Logstash Clusters page, find the cluster and click its ID.
In the left-side navigation pane of the page that appears, click Logs. Then, you can view the logs of the cluster.
The following types of logs are supported: cluster logs, slow logs, garbage collection (GC) logs, and debug logs. The following table describes each type of log and their use scenarios. For more information about the logs, see Common types of logs.
Log type
Description
Use scenario
Cluster log
This type of log records the status of a Logstash cluster.
If you want to view the status of each node in a Logstash cluster or the information about pipelines in the cluster, you can view the cluster logs of the cluster. The information about pipelines includes network connectivity between a source and a destination, operations performed to create pipelines or modify pipeline configurations, or errors reported for pipeline running.
ImportantIf errors occur in your business, we recommend that you first view the cluster logs and monitoring data of your cluster to troubleshoot performance or configuration issues.
Slow log
This type of log records events for pipelines that require a long period of time to finish running. If the time that is required to finish running a pipeline exceeds a specific time threshold, the system displays information about the event in slow logs.
ImportantBy default, slow log collection is enabled in the YML configuration file. This helps you locate Logstash issues. We recommend that you do not delete the configurations for slow log collection. For more information, see Configure a YML file.
If a long period of time is required to complete data write operations in your business, you can troubleshoot the issue based on slow logs. This issue may be caused by one of the following reasons:
The resources of the source or destination that you specify in the pipeline configurations are insufficient. We recommend that you replenish resources for the source or destination.
The values of the Pipeline Batch Size and Pipeline Workers parameters are excessively small. We recommend that you set both parameters to larger values. For more information, see Use configuration files to manage pipelines.
GC log
This type of log records information about GC for a Logstash cluster. GC logs contain information about GC triggered by JVM heap memory usage. You can obtain GC details, including information about GC based on the Old GC, Concurrent Mark Sweep (CMS) GC, Full GC, and Minor GC mechanisms.
If a performance bottleneck occurs on a Logstash cluster, you can view GC details in the GC logs of the cluster and check whether GC operations require a long period of time to complete or are frequently performed.
Debug log
This type of log records information about the output data of a Logstash pipeline. By default, debug log collection is disabled. To enable debug log collection, you must install the logstash-output-file_extend plug-in for the Logstash cluster and configure the file_extend parameter in the output configuration of the pipeline.
If you want to view the output data of a Logstash pipeline or debug pipeline configurations in the Elasticsearch console, you can view the debug logs of the Logstash cluster.
On a tab of the Logs page, enter a query string, select the start time and end time, and then click Search.
You can query logs that were generated during the previous seven days. By default, the logs are displayed by time in descending order. The Lucene query syntax is supported. For more information, see Query string syntax.
In this example, the logs that meet the following conditions are queried on the Cluster Log tab: The value of the level field is INFO, the value of the host field is 172.16.xx.xx, and the value of the content field contains the running keyword. In this case, the query string is
host:172.16.xx.xx AND level:info AND content:running.ImportantANDin the query string must be uppercase.If you do not specify an end time, the current system time is used as the end time. If you do not specify a start time, the start time is 1 hour earlier than the end time.
After you click Search, the logs that match your query string are displayed.
Common types of logs
Cluster logs
The Cluster Log tab displays the operational logs of the cluster. Each operational log contains the following information: Time, Node IP Address, and Content.
Parameter | Description |
Time | The time when the log is generated. |
Node IP Address | The IP address of the node that generates the log. |
Content | The details of the log. The following fields are contained:
|
GC logs
By default, GC log collection is enabled. Each GC log contains the following information: Time, Node IP Address, and Content. For more information, see Cluster logs.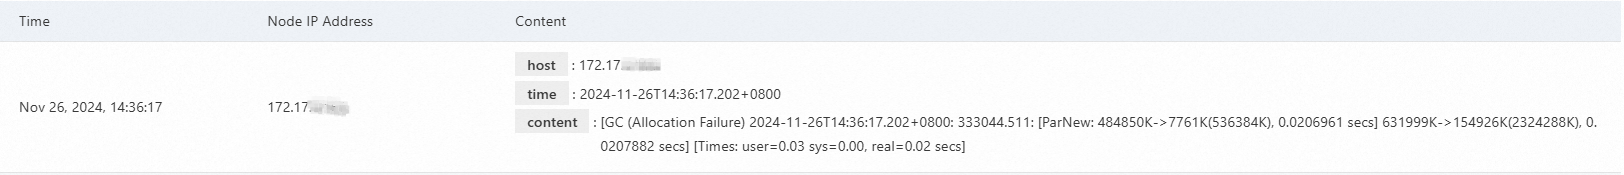
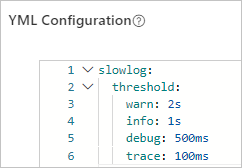
Slow logs
By default, slow log collection is enabled. You can view or modify the default configurations for slow logs in the YML configuration file of a Logstash cluster. For more information, see Configure a YML file.
To facilitate the troubleshooting of Logstash issues, we recommend that you do not delete the configurations for slow log collection.
Debug logs
If the configuration of a Logstash pipeline is incorrect, the output data of the pipeline may not meet requirements. In this case, you must repeatedly check the format of the data on the destination and modify the pipeline configuration in the console. This increases time and labor costs. To resolve this issue, you can use the pipeline configuration debugging feature provided by Logstash. This feature allows you to view the output data of your Logstash pipeline in debug logs in the Kibana console after you create and deploy the pipeline. This helps reduce your debugging costs. For more information, see Use the pipeline configuration debugging feature.
By default, debug log collection is disabled. To enable debug log collection, perform the following steps:
Install the logstash-output-file_extend plug-in. For more information, see Install and remove a plug-in.
Configure the file_extend parameter in the output configuration of the pipeline. For more information, see Use configuration files to manage pipelines.
After you enable debug log collection, you can obtain the output data of the pipeline on the Debug Log tab.