The log feature of Alibaba Cloud Elasticsearch lets you enter keywords and specify a time range to locate specific logs. This helps you quickly identify cluster issues and supports cluster operations and maintenance (O&M). This topic describes how to query logs and explains common log types.
Limits
ES access log: The access log feature is available only for Elasticsearch instances running version 6.7 (minor engine version 1.0.2 or later) or version 7.10 or later.
Audit log: You can view audit logs in the console only for instances running version 7.x or later in the following regions.
Country or greater region
Region
China
China (Beijing), China (Hangzhou), China (Shanghai), China (Zhangjiakou)
Asia-Pacific
Singapore, Malaysia (Kuala Lumpur), Indonesia (Jakarta), Japan (Tokyo)
Europe and Americas
US (Virginia), US (Silicon Valley), Germany (Frankfurt), UK (London)
Procedure
Log on to the Alibaba Cloud Elasticsearch console.
In the left navigation menu, choose Elasticsearch Clusters.
Navigate to the target cluster.
In the top navigation bar, select the resource group to which the cluster belongs and the region where the cluster resides.
On the Elasticsearch Clusters page, find the cluster and click its ID.
In the left navigation pane, click Log Search to view the operational logs of the cluster.
Alibaba Cloud Elasticsearch supports the following log types: main log, searching slow log, indexing slow log, GC log, ES access log and audit log. The following table describes these log types and their use cases. For more information, see Log descriptions.
Log type
Description
Scenario
Main log
Logs related to cluster health status, index queries, and writes. For example, write-related logs include index creation, index mapping updates, and full write queues. Query-related logs include query queues and query exceptions.
View the main log to check the operational status of each node in the cluster and the status of queries and writes. For example, you can monitor node connectivity, Full GC events, index creation or deletion, and cluster-level query errors.
ImportantIf an issue occurs on your application side, first check the main log and Cluster Monitoring to rule out performance bottlenecks or configuration issues in the cluster.
Searching slow log
Slow query logs. If a query exceeds the specified threshold, the related information is recorded in the slow query log. The slow query threshold is configured in the index template of the scenario-specific configuration template. The default value is optimal and can be applied with one click. For more information, see Index template configuration.
If queries in your business take a long time, view the searching slow log to troubleshoot the issue.
Longer queries consume more cluster resources. If many slow logs are generated, check cluster resources and load to identify bottlenecks. Then, expand the corresponding resources or use the aliyun-qos plugin to limit traffic and ensure cluster stability.
Indexing slow log
Slow write logs. If a write operation exceeds the specified threshold, the related information is recorded in the slow write log. The slow write threshold is configured in the index template of the scenario-specific configuration template. The default value is optimal and can be applied with one click. For more information, see Index template configuration.
If write operations in your business take a long time, view the indexing slow log to troubleshoot the issue.
Longer write operations consume more cluster resources. If many slow logs are generated, check cluster resources and load to identify bottlenecks. Then, expand the corresponding resources or use the aliyun-qos plugin to limit traffic and ensure cluster stability.
GC log
Garbage collector logs. These logs record all garbage collection events triggered by JVM heap memory usage. You can obtain detailed garbage collection information from GC logs, including Old GC, CMS GC, Full GC, and Minor GC.
If the cluster encounters performance bottlenecks, you can obtain detailed GC information from the GC logs to check for time-consuming or frequent GC events. If such events exist, expand cluster resources or use the aliyun-qos plugin to limit traffic and ensure cluster stability.
ImportantBy default, Alibaba Cloud Elasticsearch clusters use the CMS garbage collector. If a data node has 32 GB or more of memory, use the G1 garbage collector to improve GC efficiency. For more information, see Configure a garbage collector.
ES access log
Cluster access logs. These logs provide detailed information about restSearchAction requests received by the Elasticsearch cluster, including the URI, body size, and request time.
ImportantYou can view ES access logs in the console only for instances running version 6.7.0 (minor engine version 1.0.2 or later) or 7.10.
ES access logs do not support logs for the following query scenarios: SQL queries, multi-queries, scroll queries, and queries triggered by some visualization tools in Kibana.
To obtain more complete information about query and write requests, enable audit logs. For more information, see Configure audit logs.
View ES access logs to identify which clients are sending query requests to the Elasticsearch cluster.
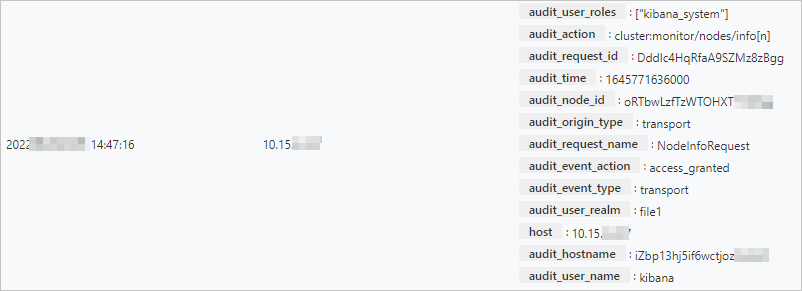
Audit log
Audit logs generated for operations such as create, delete, update, and query on an Elasticsearch instance.
ImportantYou can view audit logs in the console only for instances running version 7.x or later in the regions listed in Limits. For other instances, you must enable audit logs in the YML configuration. After enabling this feature, audit logs are written to the current Elasticsearch cluster as an index. You can view the audit logs by checking indices that start with .security_audit_log-* in the Kibana console. For more information, see Configure YML parameters.
Before viewing audit logs in the console, click Log Settings to enable audit log collection.
By default, the following event types are collected for audit logs: access_denied, anonymous_access_denied, authentication_failed, connection_denied, tampered_request, run_as_denied, run_as_granted. To change the collected event types, modify the xpack.security.audit.logfile.events.include parameter in the cluster's YML file. For more information, see Configure audit logs.
View audit logs to troubleshoot issues such as authentication failures and connection denials. You can also use them to monitor data access events and investigate suspicious activities in the cluster, such as changes to data access authorization and user security configurations.
In the search box on the log page, enter search criteria, select a start time and an end time, and then click Search.
After a successful search, Alibaba Cloud Elasticsearch returns log query results based on your criteria and displays them on the log query page.
Alibaba Cloud Elasticsearch lets you query logs from the last seven consecutive days. By default, logs are displayed in reverse chronological order.
The Lucene-based query syntax is supported. For more information, see Query string syntax.
The
ANDoperator in the search criteria must be in uppercase.If you leave the end time empty, the current time is used. If you leave the start time empty, the time one hour before the end time is used.
For example, to query main logs where content contains the keyword health, level is info, and host is 172.16.xx.xx, use the following search criteria:
host:172.16.xx.xx AND content:health AND level:info.ImportantAlibaba Cloud Elasticsearch can return a maximum of 10,000 log entries.
If the 10,000 returned log entries do not include the content you need, narrow the time range for your query.
A single log entry in Alibaba Cloud Elasticsearch can display a maximum of 10,000 characters.
Log descriptions
Main log
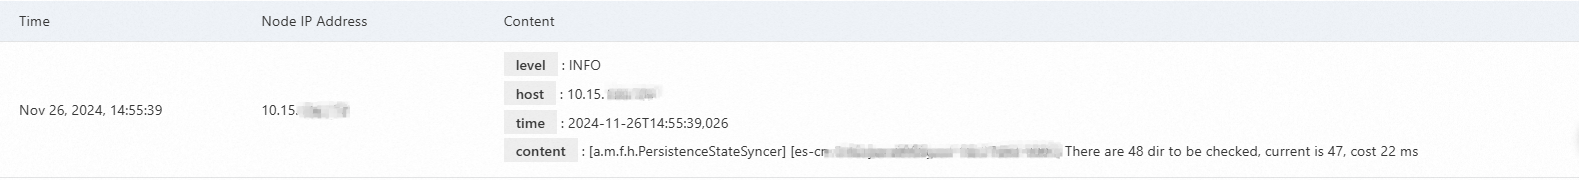
The main log displays the operational logs of the cluster, including the time the log was generated, the IP address of the node where the log was generated, and the log content.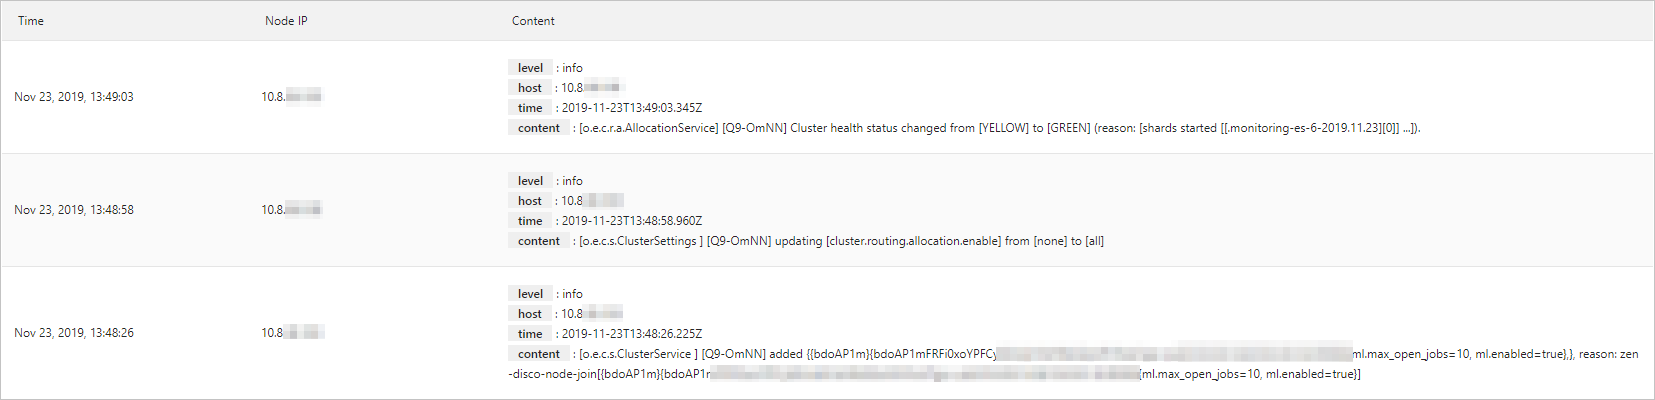
Parameter | Description |
Time | The time when the log was generated. |
Node IP | The IP address of the node that generated the log. |
Content | The details of a log mainly consist of level, host, time, and content:
|
Slow logs
Slow logs are enabled by default. They display logs for indexing (indexing slow logs) and queries (searching slow logs) that exceed a specified time threshold. If you encounter issues such as load imbalance, read/write exceptions, or slow data processing, you can query slow logs to analyze the cause.
By default, the slow logs of an Alibaba Cloud Elasticsearch instance record read and write operations that take 5 to 10 seconds. This makes it difficult to troubleshoot issues. After creating an instance, you can use one of the following methods to reduce the time interval for logging and capture more logs:
After the cluster is created, the scenario-specific configuration template is enabled by default and automatically applied to the cluster. The index template configuration defines the slow log configuration. You can keep the default settings. The default slow log configuration for the general-purpose scenario is as follows:
"settings": { "index": { "search": { "slowlog": { "level": "info", "threshold": { "fetch": { "warn": "200ms", "trace": "50ms", "debug": "80ms", "info": "100ms" }, "query": { "warn": "500ms", "trace": "50ms", "debug": "100ms", "info": "200ms" } } } }, "refresh_interval": "10s", "unassigned": { "node_left": { "delayed_timeout": "5m" } }, "indexing": { "slowlog": { "level": "info", "threshold": { "index": { "warn": "200ms", "trace": "20ms", "debug": "50ms", "info": "100ms" } }, "source": "1000" } } } }NoteIf the Scenario-specific Configuration Template is Disabled, you must enable and submit the template configuration to apply the default slow log configuration to the cluster. For more information, see Modify a scenario-specific configuration template.
Log on to the Kibana console of the instance and run the following command to modify the slow log configuration. For more information, see Log on to the Kibana console.
PUT _settings{ "index.indexing.slowlog.threshold.index.warn" : "200ms", "index.indexing.slowlog.threshold.index.trace" : "20ms", "index.indexing.slowlog.threshold.index.debug" : "50ms", "index.indexing.slowlog.threshold.index.info" : "100ms", "index.search.slowlog.threshold.fetch.warn" : "200ms", "index.search.slowlog.threshold.fetch.trace" : "50ms", "index.search.slowlog.threshold.fetch.debug" : "80ms", "index.search.slowlog.threshold.fetch.info" : "100ms", "index.search.slowlog.threshold.query.warn" : "500ms", "index.search.slowlog.threshold.query.trace" : "50ms", "index.search.slowlog.threshold.query.debug" : "100ms", "index.search.slowlog.threshold.query.info" : "200ms"}
After the configuration is modified, if a read or write task takes longer than the configured time, you can find the corresponding log on the Slow Log tab.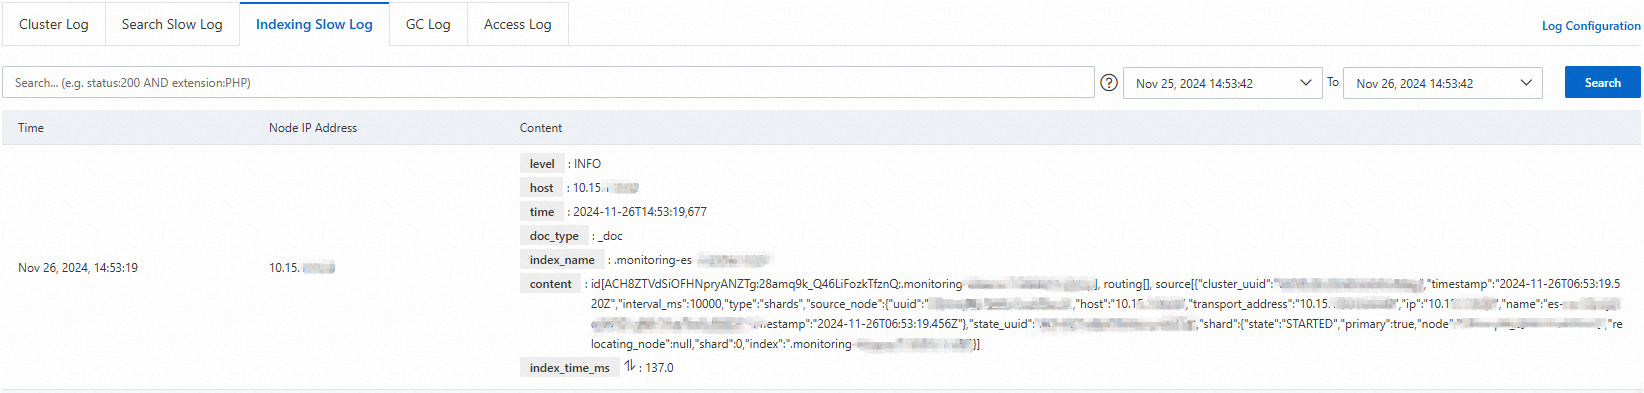
GC log
The GC log is enabled by default. It includes the time the log was generated, the IP address of the node where it was generated, and the log content. For more information, see Main log.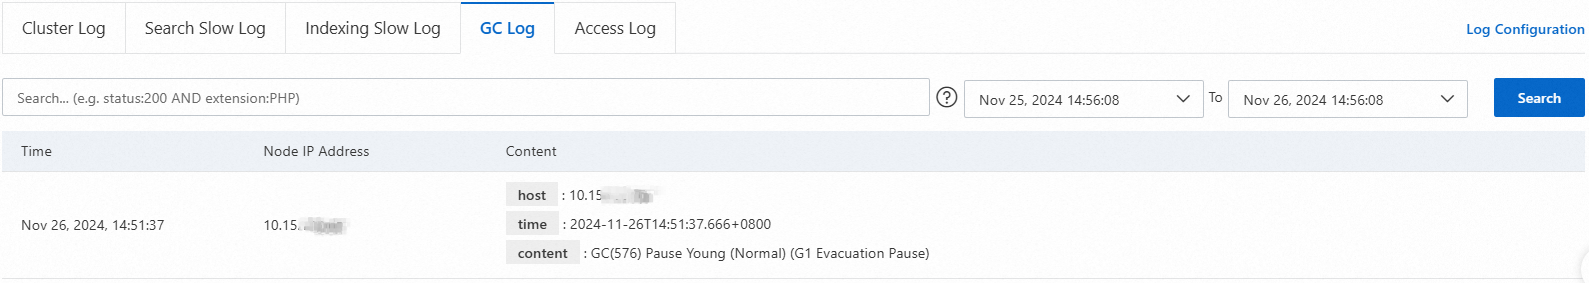
ES access log
The access log shows detailed information about restSearchAction requests received by the Elasticsearch cluster. This includes the cluster node and IP address, body size, request content, request time, IP address of the client that initiated the request, and URI.
You can view ES access logs in the console only for instances running version 6.7.0 or 7.10.
To obtain more complete information about query and write requests, enable audit logs. For more information, see Configure audit logs.
Audit log
You can view audit logs in the console only for instances running version 7.x or later in the regions listed in Limits.
The audit log displays logs generated for operations such as create, delete, update, and query on an Elasticsearch instance. This feature is disabled by default. You can perform the following steps to enable it and view audit logs:
On the Log Search page, click Log Settings on the right.
In the Log Settings dialog box, turn on the Audit Log Collection switch.
ImportantAfter you enable Audit Log Collection, you can query the audit logs of the cluster on the current page. To change the collected audit event types, go to the cluster configuration page to modify the xpack.security.audit.logfile.events.include parameter. For more information, see Configure audit logs.
Enabling or disabling Audit Log Collection triggers a cluster restart. Alibaba Cloud Elasticsearch clusters are restarted using a rolling restart. If the cluster is in a Normal (green) state, each index has at least one replica, and resource usage is not excessively high, the cluster can continue to provide services during the restart. However, we recommend that you perform this operation during off-peak hours.
When prompted, click Confirm.
After you confirm, the cluster restarts. During the restart, you can view the progress in the Task List. After the cluster successfully restarts, audit log collection is enabled.
ImportantAudit log information consumes disk space and can affect performance. If you do not need to view audit logs, you can disable the Audit Log Collection feature in the same way.
On the Log Search page, click the Audit Log tab to view the audit logs.