This topic describes how to create an Alibaba Cloud Logstash cluster and configure a Logstash pipeline to synchronize data between Alibaba Cloud Elasticsearch clusters.

Background information

Make sure that you have understood the following information:

Prerequisites

Limits

  • The source Elasticsearch cluster, Logstash cluster, and destination Elasticsearch cluster must reside in the same VPC. If they reside in different VPCs, you must configure Network Address Translation (NAT) gateways for the Logstash cluster. This way, the Logstash cluster can connect to the source Elasticsearch cluster and destination Elasticsearch cluster over the Internet. For more information, see Configure a NAT gateway for data transmission over the Internet.
  • The versions of the source Elasticsearch cluster, Logstash cluster, and destination Elasticsearch cluster must meet compatibility requirements. For more information, see Compatibility matrixes.

Procedure

  1. Preparations
    Create a source Elasticsearch cluster and a destination Elasticsearch cluster, enable the Auto Indexing feature for the destination Elasticsearch cluster, and prepare test data.
  2. Step 1: Create a Logstash cluster
    Create a Logstash cluster. After the state of the Logstash cluster changes to Active, you can create and run a Logstash pipeline.
  3. Step 2: Create and run a Logstash pipeline
    Create and configure a Logstash pipeline to synchronize data.
  4. Step 3: View synchronization results
    Log on to the Kibana console of the destination Elasticsearch cluster and view data synchronization results.

Preparations

  1. Create Alibaba Cloud Elasticsearch clusters.
    1. Log on to the Elasticsearch console.
    2. In the left-side navigation pane, click Elasticsearch Clusters.
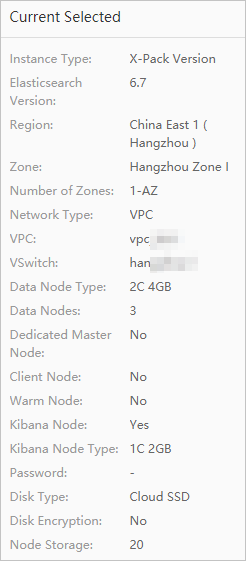
    3. Click Create on the Elasticsearch Clusters page and create two Elasticsearch clusters.
      The two Elasticsearch clusters are used as the input and output of a Logstash pipeline. For more information, see Create an Alibaba Cloud Elasticsearch cluster. In this example, a Logstash V6.7.0 cluster is used to synchronize data between Elasticsearch V6.7.0 clusters of the Standard Edition. The code provided in this topic applies only to this type of data synchronization. The following figure shows the configurations of the created Elasticsearch clusters.
      Note If you want to perform other types of data synchronization, you must check whether your Elasticsearch clusters and Logstash cluster meet compatibility requirements based on the instructions in Compatibility matrixes. If they do not meet compatibility requirements, you can upgrade their versions or purchase new clusters.
      Cluster configuration
      Note The default user that is used to access an Elasticsearch cluster is elastic. If you want to use a user other than elastic, you must grant the required permissions to a role and assign the role to the user. For more information, see Use the RBAC mechanism provided by Elasticsearch X-Pack to implement access control. In this example, the default user is used.
  2. Enable the Auto Indexing feature for the destination Elasticsearch cluster.
    For more information, see Configure the YML file.
    Note To ensure data security, Alibaba Cloud Elasticsearch disables the Auto Indexing feature by default. When you use Alibaba Cloud Logstash to transfer data to an Alibaba Cloud Elasticsearch cluster, indexes are created in the Elasticsearch cluster by submitting data instead of calling the create index API. Therefore, before you use Alibaba Cloud Logstash to transfer data, you must enable the Auto Indexing feature for the destination Elasticsearch cluster, or create an index in the destination Elasticsearch cluster and configure mappings for the index.
  3. Prepare test data.
    Log on to the Kibana console of the source Elasticsearch cluster. In the left-side navigation pane, click Dev Tools. On the Console tab of the page that appears, create an index and insert documents into the index.
    Notice
    • For more information about how to log on to the Kibana console, see Log on to the Kibana console.
    • The following code applies only to Elasticsearch V6.7 clusters and is used for tests only. For more information about sample code for Elasticsearch clusters of V7.0 or later, see Getting started with Elasticsearch.
    1. Create an index whose name is my_index and type is my_type.
      PUT /my_index
      {
          "settings" : {
            "index" : {
              "number_of_shards" : "5",
              "number_of_replicas" : "1"
            }
          },
          "mappings" : {
              "my_type" : {
                  "properties" : {
                    "post_date": {          
                         "type": "date"       
                     },
                    "tags": {
                         "type": "keyword"
                     },
                      "title" : {
                          "type" : "text"
                      }
                  }
              }
          }
      }
    2. Insert a document named 1 into the my_index index.
      PUT /my_index/my_type/1?pretty
      {
        "title": "One", 
        "tags": ["ruby"],
        "post_date":"2009-11-15T13:00:00"
      }
    3. Insert a document named 2 into the my_index index.
      PUT /my_index/my_type/2?pretty
      {
        "title": "Two", 
        "tags": ["ruby"],
        "post_date":"2009-11-15T14:00:00"
      }

Step 1: Create a Logstash cluster

  1. Go to the Logstash Clusters page.
    1. In the top navigation bar, select the region where the destination Elasticsearch cluster resides.
    2. In the left-side navigation pane, click Logstash Clusters.
  2. On the Logstash Clusters page, click Create.
  3. On the buy page, configure cluster launch settings.
    In this example, Billing Method is set to Pay-As-You-Go, Logstash Version is set to 6.7, and default values are retained for other parameters. For more information, see Create an Alibaba Cloud Logstash cluster.
    Note
    • We recommend that you purchase pay-as-you-go Logstash clusters for program development or functional testing.
    • Discounts are offered for subscription clusters.
  4. Read the terms of service, select Logstash (Pay-as-you-go) Terms of Service, and then click Buy Now.
  5. After a message that indicates creation success is displayed, click Console.
  6. In the top navigation bar, select the region where the Logstash cluster resides. In the left-side navigation pane, click Logstash Clusters. On the Logstash Clusters page, view the newly created Logstash cluster.

Step 2: Create and run a Logstash pipeline

After the state of the newly created Logstash cluster changes to Active, you can create and run a Logstash pipeline to synchronize data.

  1. On the Logstash Clusters page, find the newly created Logstash cluster and click Manage Pipeline in the Actions column.
  2. On the Pipelines page, click Create Pipeline.
  3. In the Config Settings step, configure Pipeline ID and Config Settings.
    In this example, the following configurations are used for the pipeline:
    input {
        elasticsearch {
            hosts => ["http://es-cn-0pp1f1y5g000h****.elasticsearch.aliyuncs.com:9200"]
            user => "elastic"
            password => "your_password"
            index => "*,-.monitoring*,-.security*,-.kibana*"
            docinfo => true
        }
    }
    filter {}
    output {
        elasticsearch {
            hosts => ["http://es-cn-mp91cbxsm000c****.elasticsearch.aliyuncs.com:9200"]
            user => "elastic"
            password => "your_password"
            index => "%{[@metadata][_index]}"
            document_type => "%{[@metadata][_type]}"
            document_id => "%{[@metadata][_id]}"
        }
        file_extend {
            path => "/ssd/1/ls-cn-v0h1kzca****/logstash/logs/debug/test"
        }
    }
    Parameter Description
    hosts The endpoint of the source or destination Elasticsearch cluster. In the input part, specify a value for this parameter in the format of http://<ID of the source Elasticsearch cluster>.elasticsearch.aliyuncs.com:9200. In the output part, specify a value for this parameter in the format of http://<ID of the destination Elasticsearch cluster>.elasticsearch.aliyuncs.com:9200.
    user The username that is used to access the source or destination Elasticsearch cluster. The default username is elastic.
    password The password that is used to access the source or destination Elasticsearch cluster. The password is specified when you create the cluster. If you forget the password, you can reset it. For more information about the procedure and precautions for resetting a password, see Reset the access password for an Elasticsearch cluster.
    index The name of the index whose data you want to synchronize or the index to which you want to synchronize data. If you set this parameter to *,-.monitoring*,-.security*,-.kibana* in the input part, the system synchronizes data in indexes other than system indexes whose names start with a period (.). The value %{[@metadata][_index]} indicates that the system matches the index parameter in metadata. In this case, the name of the destination index is the same as the name of the source index.
    Note System indexes are used to store the monitoring logs of Elasticsearch clusters and do not need to be synchronized.
    docinfo The value true indicates that the system extracts the metadata of Elasticsearch documents, such as the index, type, and ID.
    document_type The type of the destination index. The value %{[@metadata][_type]} indicates that the system matches the document_type parameter in metadata. In this case, the type of the destination index is the same as that of the source index.
    document_id The IDs of documents in the destination index. The value %{[@metadata][_id]} indicates that the system matches the document_id parameter in metadata. In this case, the IDs of the documents in the destination index are the same as the IDs of documents in the source index.
    file_extend specifies whether the pipeline configuration debugging feature is enabled. This parameter is optional. You can use the path field to specify the path that stores debug logs. We recommend that you configure this parameter. After the parameter is configured, you can directly view the output data of the pipeline in the console. If the parameter is not configured, you need to check the output data of the pipeline in the destination. If the output data is incorrect, you need to modify the configuration of the pipeline in the console. This increases time and labor costs. For more information, see Use the pipeline configuration debugging feature.
    Notice Before you use the file_extend parameter, you must install the logstash-output-file_extend plug-in. For more information, see Install and remove a plug-in. By default, the path field is set to a system-specified path. We recommend that you do not change the path. You can click Start Configuration Debug to obtain the path.

    For more information about the code structure in Config Settings and the supported data types, see Structure of a Config File. The supported data types may differ in different versions.

  4. Click Next to configure pipeline parameters.
    In the Pipeline Parameters step, configure the parameters. Set Pipeline Workers to the number of vCPUs that you configured for the Logstash cluster. In this example, default values are retained for other parameters. For more information, see Use configuration files to manage pipelines.
  5. Click Save or Save and Deploy.
    • Save: After you click this button, the system stores the pipeline settings and triggers a cluster change. However, the settings do not take effect. After you click Save, the Pipelines page appears. On the Pipelines page, find the created pipeline and click Deploy in the Actions column. Then, the system restarts the Logstash cluster to make the settings take effect.
    • Save and Deploy: After you click this button, the system restarts the Logstash cluster to make the settings take effect.
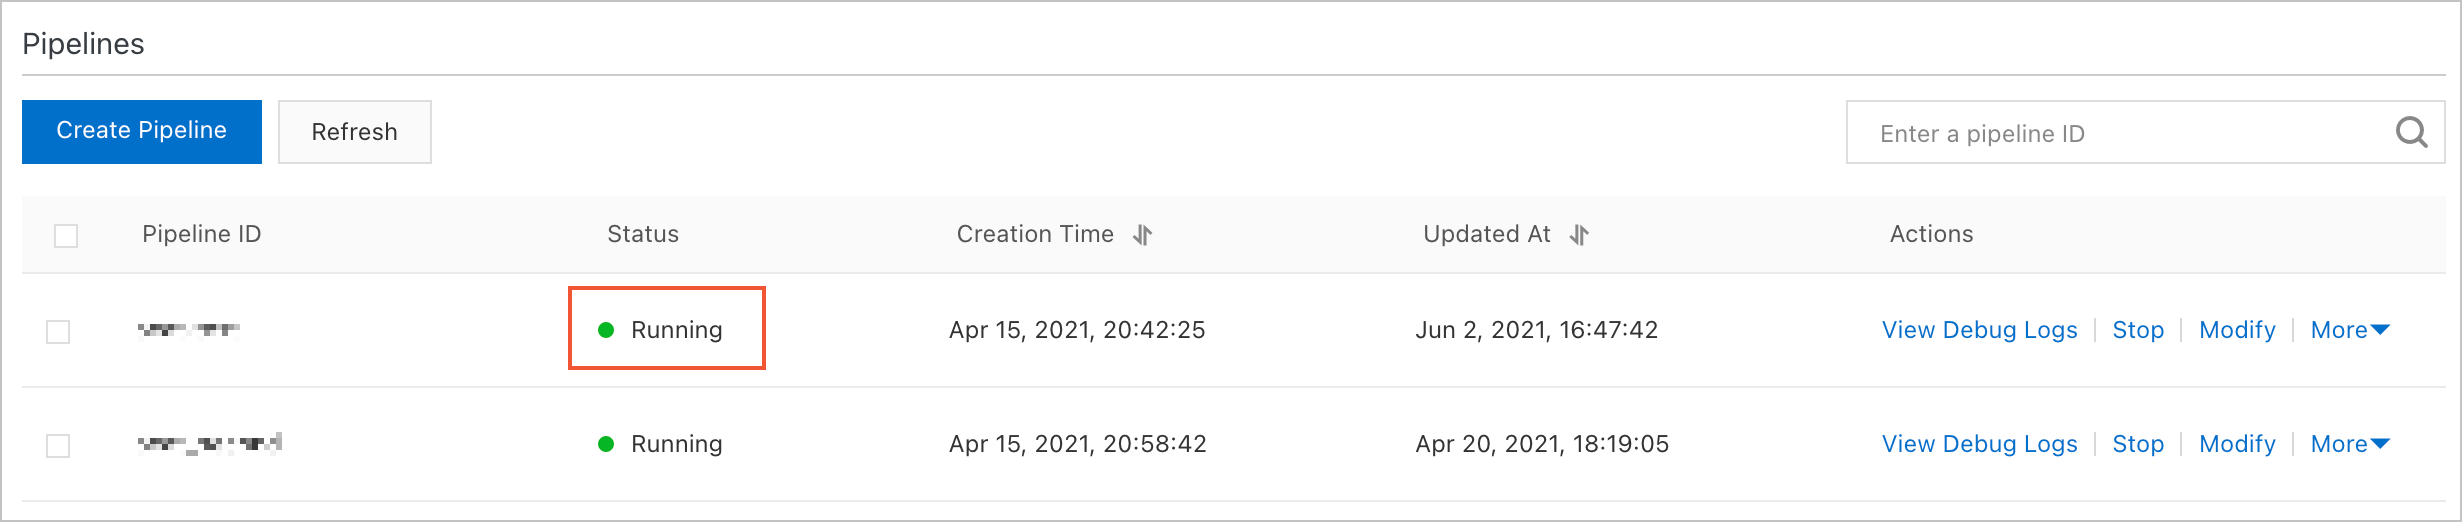
  6. In the message that appears, click OK.
    Then, you can view the newly created pipeline in the Pipelines section. After the state of the pipeline changes to Running, the system starts to synchronize data. Pipelines

Step 3: View synchronization results

After the Logstash pipeline is created and starts to run, you can log on to the Kibana console of the destination Elasticsearch cluster to view data synchronization results.

  1. Log on to the Kibana console of your Elasticsearch cluster and go to the homepage of the Kibana console as prompted.
    For more information about how to log on to the Kibana console, see Log on to the Kibana console.
    Note In this example, an Elasticsearch V6.7.0 cluster is used. Operations on clusters of other versions may differ. The actual operations in the console prevail.
  2. In the left-side navigation pane of the page that appears, click Dev Tools.
  3. On the Console tab of the page that appears, run the following command to view data synchronization results:
    GET /my_index/_search
    {
      "query": {
        "match_all": {}
      }
    }
    If the command is successfully run, the result shown in the following figure is returned. Command output
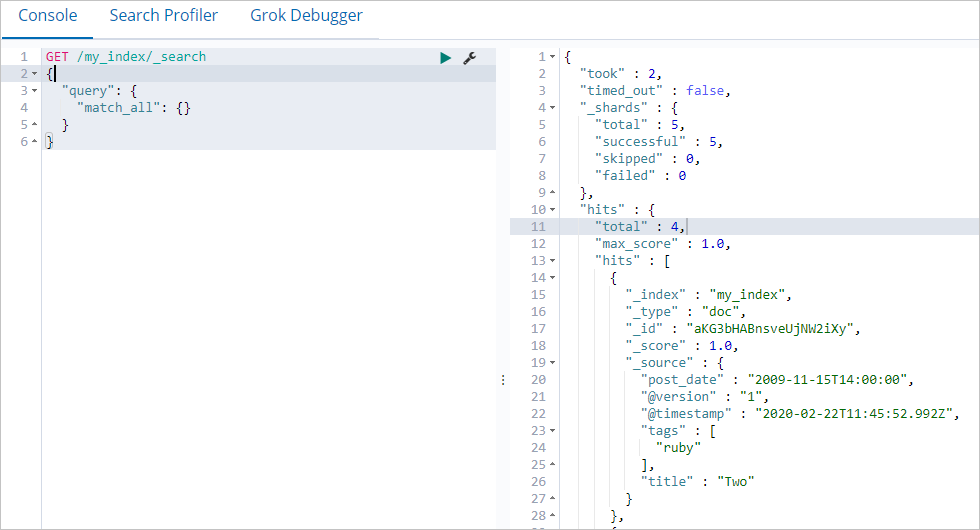
If the data in the destination Elasticsearch cluster is the same as the data in the source Elasticsearch cluster, data is successfully synchronized. You can also run the GET _cat/indices?v command and check whether the size of the destination index is the same as the size of the source index to determine whether data is successfully synchronized.

References

FAQ