On the details page of an elastic container instance (ECI), you can view events and logs to troubleshoot issues. You can also view monitoring metrics such as CPU utilization of an ECI instance to understand the status of the instance. This topic describes how to view the events, logs, and monitoring metrics of an ECI instance.
Procedure
Log on to the Elastic Container Instance console.
In the top navigation bar, select a region.
-
On the Container Group page, find the instance that you want to view and click its ID.
-
On the details page, switch tabs to view the events, logs, or monitoring metrics.
-
View events
You can view the most recent 50 entries of events of the current ECI instance. For more information about common events and the corresponding resolutions, see ECI custom events.
Click the Events tab. The event list displays the Event name, Type (Normal / Warning), Description, Start time, and End time.
-
View logs
You can specify a container name and the start time of query to filter logs. For more information, see Configure log collection for an ECI instance.
You can also select the container exit log checkbox to view logs from exited containers. After you set the filter conditions, click OK to view the log output.
View monitoring metrics
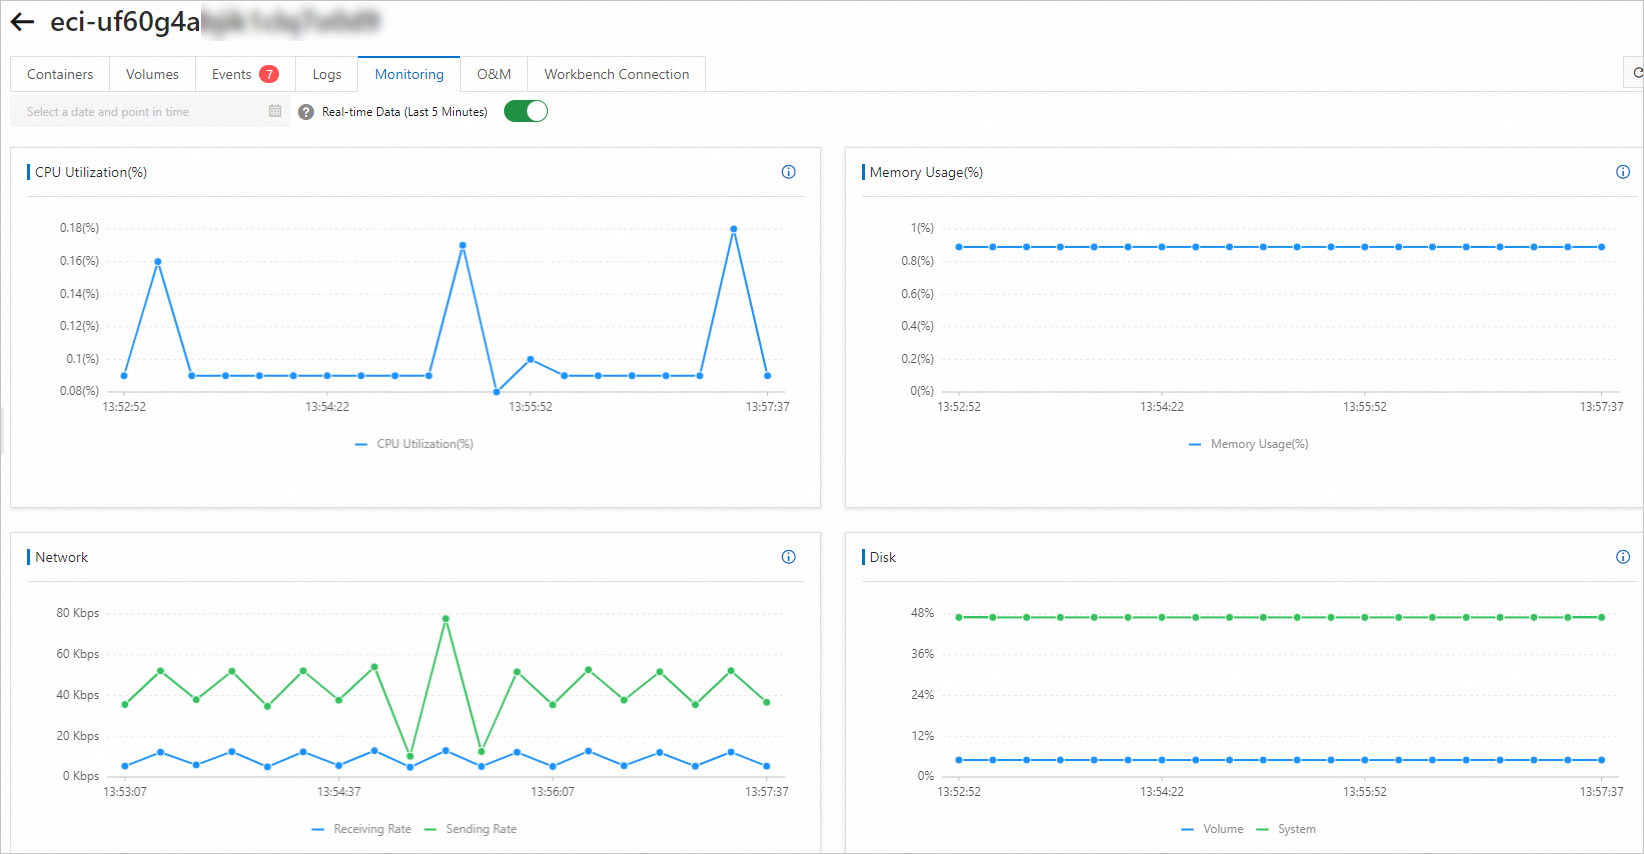
You can view metrics, such as CPU utilization, memory usage, network traffic, and disk usage. For more information, see View the monitoring metrics of an ECI instance.
-