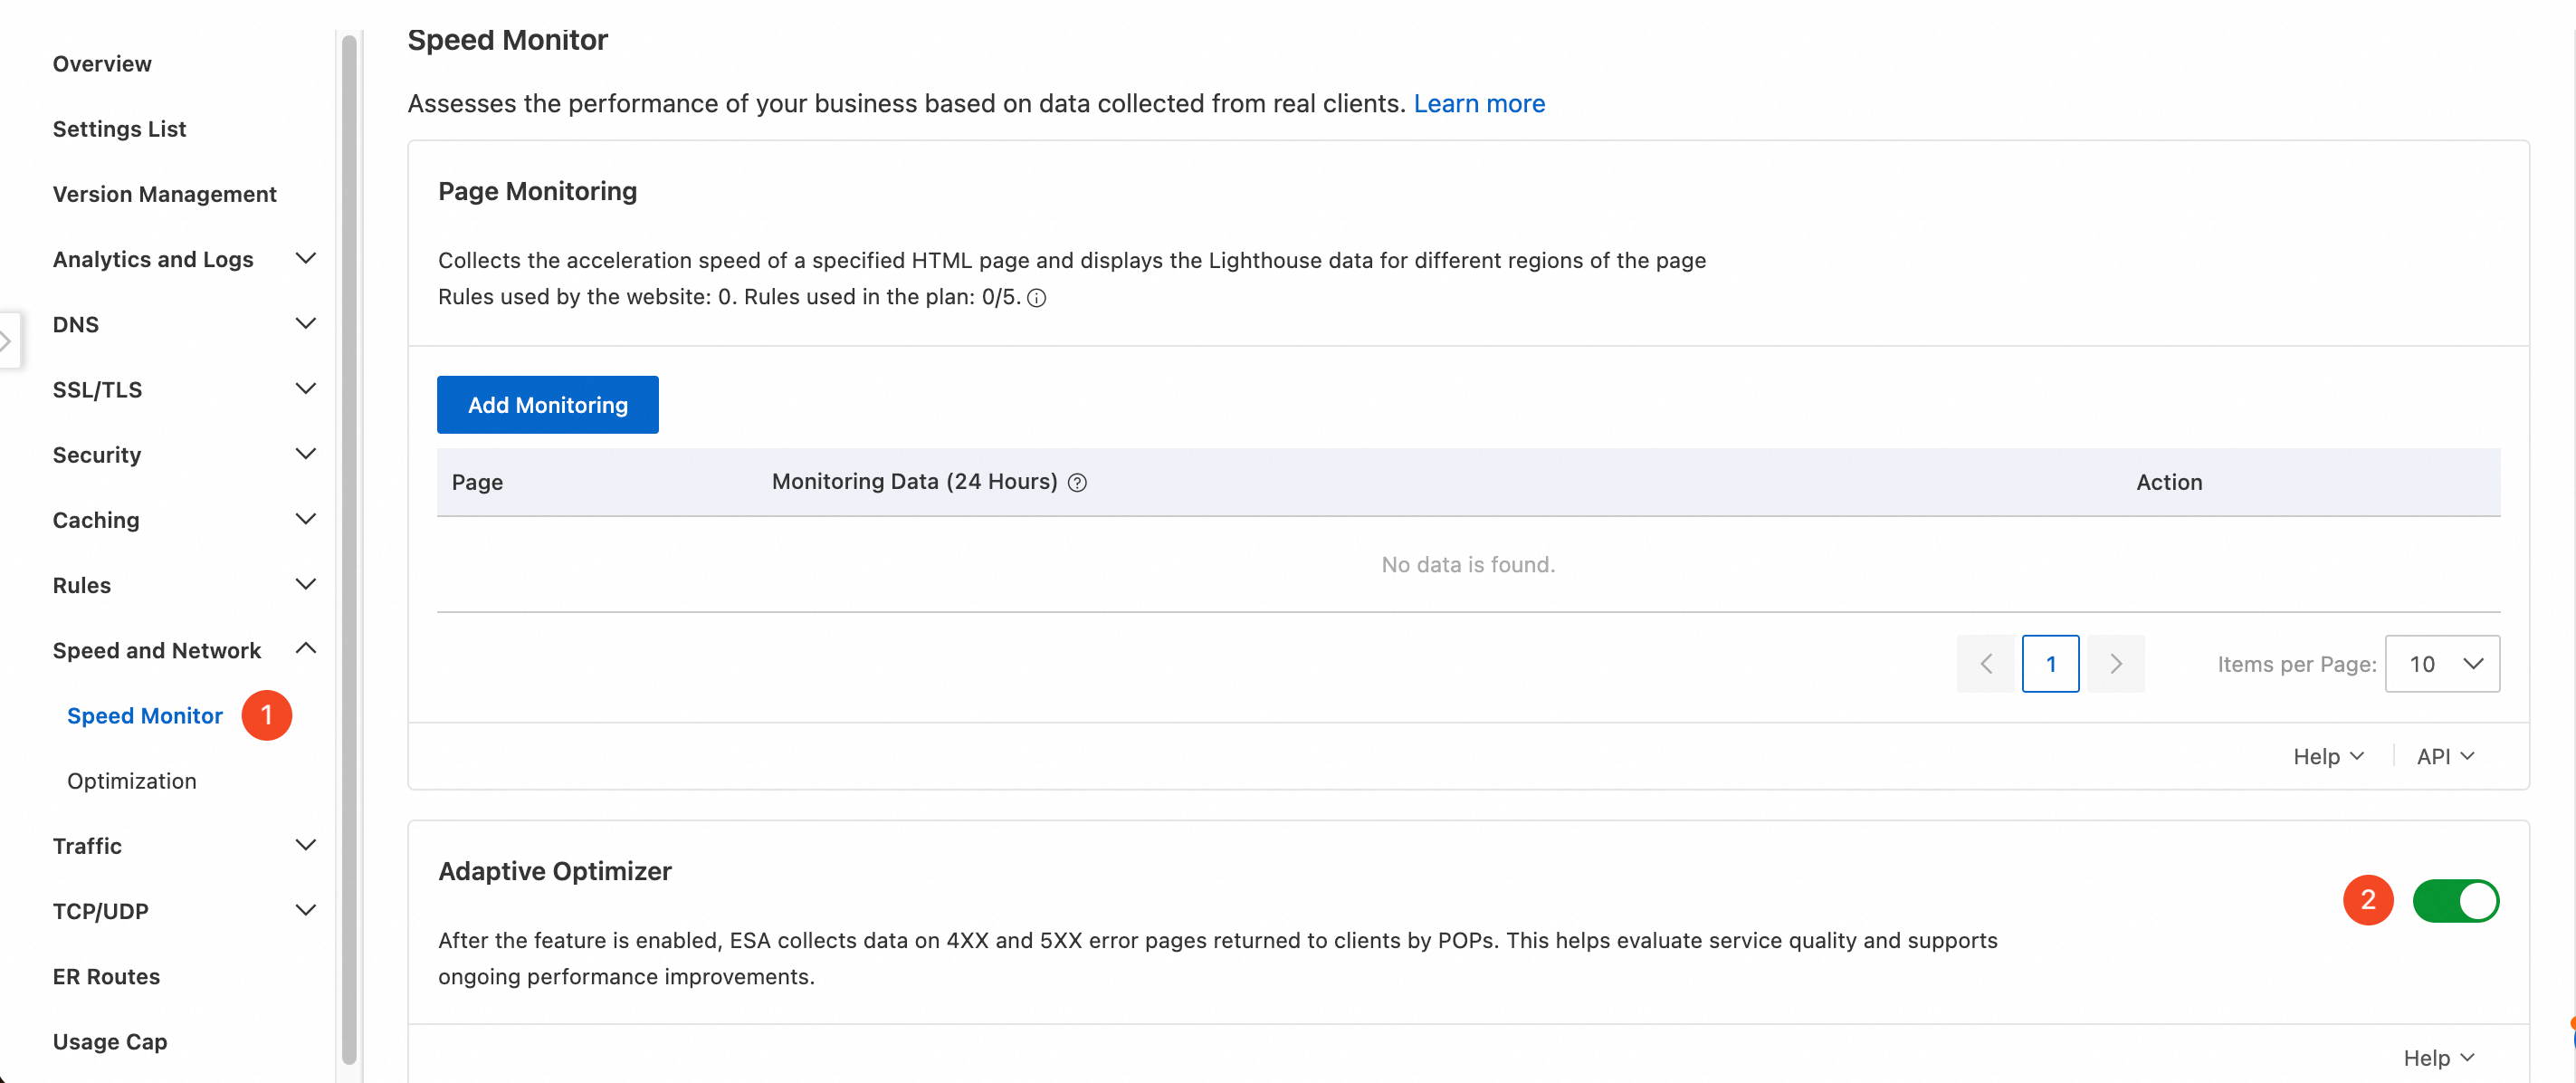
Adaptive Optimizer in ESA Speed Monitor injects an anonymized JavaScript snippet into specific error and CAPTCHA pages to collect client-side performance data and send it to a data center for analysis.
How it works
ESA Adaptive Optimizer samples network performance data from the client to help you identify the root causes of service anomalies and improve long-term performance. ESA collects the following metrics from the client:
-
HTTP status code: The response status code.
-
DNS resolution time: The time to resolve the domain name.
-
TCP connection time: The time to establish a TCP connection.
-
SSL handshake time: The time to complete the SSL/TLS handshake.
-
Time to First Byte (TTFB): The time until the client receives the first byte of the response.
-
Total request time: The end-to-end time for the entire request.
-
Request sending time: The time to send the HTTP request.
-
Response size: The size of the response payload received by the client, in bytes.
-
Protocol version: The HTTP protocol version used, such as HTTP/1.1 or HTTP/2.
Considerations
-
The data collection script may send requests to nearby ESA points of presence (PoPs) to assess client connectivity and network quality.
-
For users outside the Chinese mainland, collected data, which consists only of network performance metrics, is transmitted to a data center in Singapore. ESA does not collect or store any personally identifiable information (PII).
Configuration
-
In the ESA console, select Websites. In the Website column, click the desired website.
-
In the left-side navigation pane, click . Then, enable Adaptive Optimizer.