If malicious attacks or traffic abuse target your domain, you may see a sudden spike in bandwidth or traffic usage. This can lead to unexpectedly high bills that are ineligible for waivers or refunds. To mitigate this risk, you can block anomalous attacks by using access control, web application firewall (WAF) protection, and other methods.
Background
In recent years, with the rapid development of the internet industry, security incidents involving traffic abuse have been on the rise. The ESA service is a solution designed to improve user experience and accelerate resource access efficiency. Its billing model is based on the traffic generated from downloading a customer's resources. Because download volume is positively correlated with customer fees, malicious attacks can result in unexpectedly high costs.
Preventive measures
Set a usage cap
A usage cap helps you manage unexpected traffic spikes by automatically applying rules to your site based on your settings, which prevents large postpaid bills. However, this feature can disrupt your service, so use it with caution.
In the ESA console, choose Websites. In the Website column, click the target site.
In the navigation pane on the left, choose Usage Cap.
On the Usage Cap page, click Create Rule. Enter a Rule Name, and set the match conditions and Statistical Cycle.
Every 5 Minutes: A 5-minute time window.
Every Hour: A 1-hour time window.
Every Day: A calendar day (00:00–23:59).
Every Month: A calendar month (first to last day of the current month).
Select an action and click OK.
Disable Website: When traffic reaches the threshold, the site is suspended and all acceleration, security, and computing services become unavailable. This affects your online business — use with caution. Set a threshold higher than your planned usage.
Delete DNS Records: When traffic reaches the threshold, a specific subdomain record is deleted. Use this option to avoid taking the site offline.
WarningDeleting a subdomain record is irreversible. You must manually re-add the record and its configuration. Use with caution.
Enable real-time log delivery
Real-time log delivery transmits access logs from ESA points of presence (POPs) to your analysis system in real time. This lets you rapidly identify abnormal behaviors such as hotlinking, traffic bursts, and unauthorized access. It also helps you accurately locate abuse sources and apply countermeasures, like blocking or rate limiting, to promptly stop attacks. This significantly reduces bandwidth consumption and security risks. To gain these benefits, enable the real-time log feature. The scope of requests recorded by each log type is as follows:
|
Log type |
Dimension |
Recorded content |
Scenarios |
|
Edge Routine Log |
Account |
Records request data from ESA edge function invocations in the current account. |
Business analysis and optimization |
|
Edge Container Log |
Records business logs from edge containers in the current account. |
|
|
|
Access and Origin Log |
Website |
Records request details when users access a website or service accelerated by ESA, and back-to-origin request details from ESA nodes. |
|
|
Firewall Log |
Records malicious requests detected and blocked by the ESA Web Application Firewall (WAF). |
|
|
|
TCP/UDP Proxy Log |
Records content transmitted through ESA transport-layer acceleration. |
|
|
|
DNS Logs |
Records DNS resolution requests accelerated by ESA. |
|
Abuse scenarios
Traffic abuse scenarios typically involve various types of malicious requests. The following table describes common attack methods and their countermeasures:
Type | Description | Characteristics | Mitigation |
Spoofed User-Agent attack | Attackers send many requests with a spoofed | Spoofed
| Configure a |
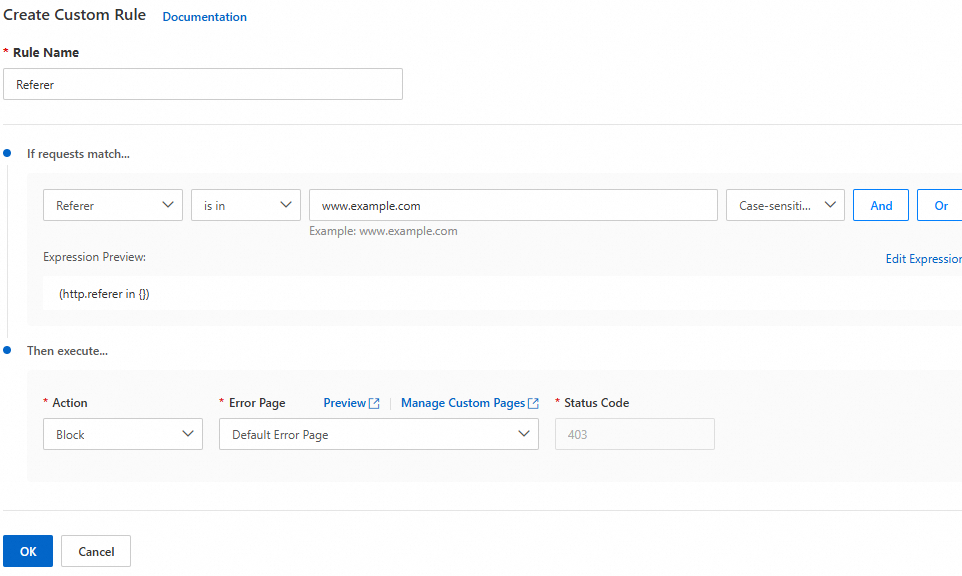
Spoofed Referer attack | Attackers spoof the | The URL in the | Configure a |
Frequent requests for the same resource | Attackers frequently request the same resource, such as an API operation, in a short period. This causes high server load, resource consumption, and increased costs. | High-frequency requests come from the same IP address or a few IP addresses. |
|
Malicious bots and scraping | Attackers use malicious bot tools to scrape a large amount of website content. | High-frequency requests for the same resource, or request patterns that follow a fixed rule. | Use the ESA Bot Management feature to detect and block malicious bots by analyzing request frequency and patterns. |
Troubleshoot anomalies
ESA provides log collection and analysis features. You can use network traffic analysis, standard logs, and other methods to analyze data from high-traffic periods and select appropriate countermeasures based on the anomaly type.
Traffic analysis
The data for network traffic analysis comes from ESA access logs. These logs record information about every request that passes through an ESA POP, including the client IP, request time, request type, and response status. By analyzing these logs, ESA provides accurate traffic statistics and reports.
View and download reports
In the ESA console, select Websites, and in the Website column, click the target site.
In the left navigation pane, choose .
On the Traffic Analytics page, view the traffic statistics and analysis. You can also click the
 icon to print the page report or click the
  icon to download the data as a CSV file. You can use filters to sort the data. For the time range, select Custom Time Range, and choose the date and time period when the suspected traffic abuse occurred.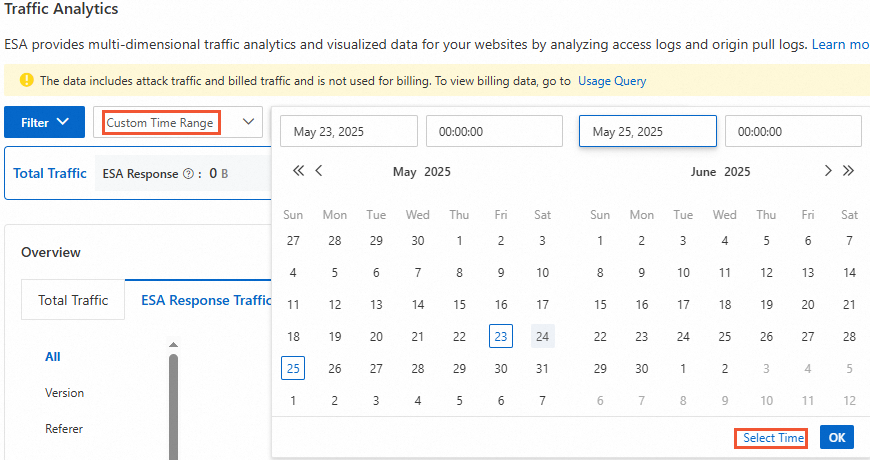
On the Traffic Analysis page, you can see a line chart of the total traffic and the traffic served by ESA. This helps you visualize and analyze historical traffic trends.
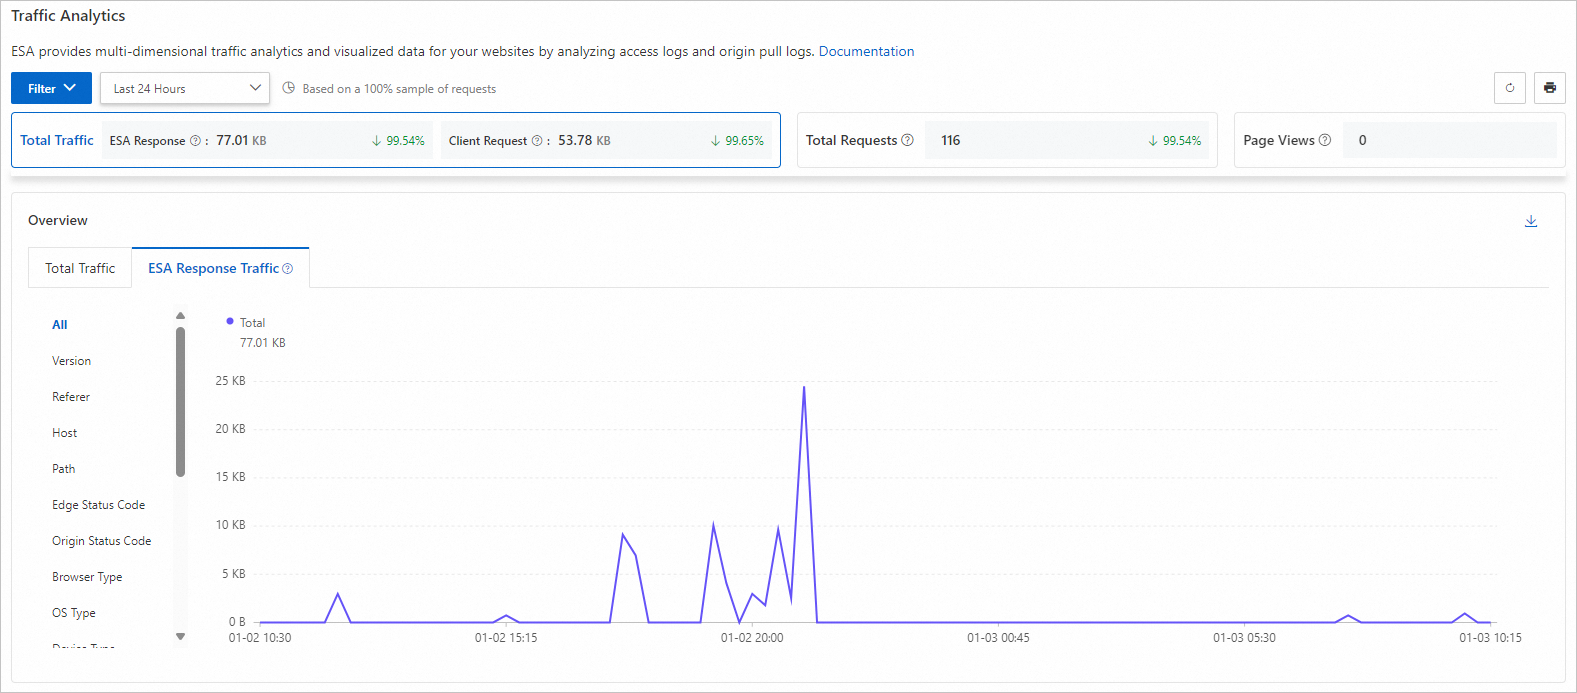
Total Traffic: All traffic transmitted from ESA to clients.
Total Requests: The total number of requests received by ESA from clients.
Page Views: The number of successful HTTP responses with a content type of HTML.
Metric Change Percentage: The percentage change for each data metric compares the selected time range to the preceding one of the same duration. If there is no data for the previous time range, the percentage change is not displayed.
For example, if you select the Last 30 Days time range and the number of requests shows a 2.03% increase, it means that the number of requests received by the ESA server in the last 30 days increased by 2.03% compared to the 30-day period from 60 days ago to 30 days ago.
You can use this module to gain a deeper understanding of the geographical distribution of traffic and identify regions with anomalous traffic.
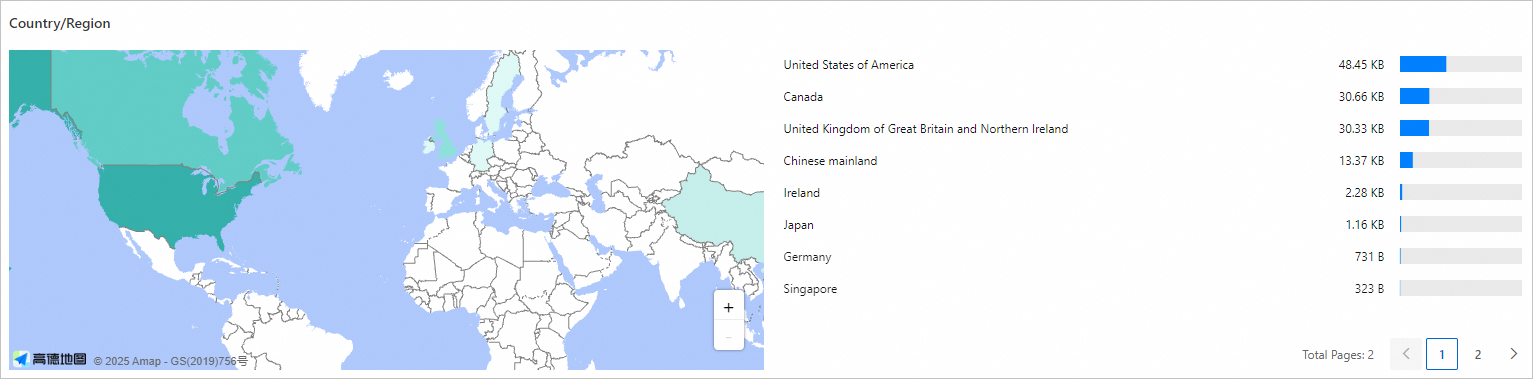
The network traffic analysis feature provides traffic and user behavior analysis across multiple dimensions. These modules together give you a comprehensive overview of traffic and user behavior. You can select a time range to view detailed data and visualizations for these dimensions.
NoteBy default, network traffic analysis displays the top 5 data entries. You can click More to view more information.
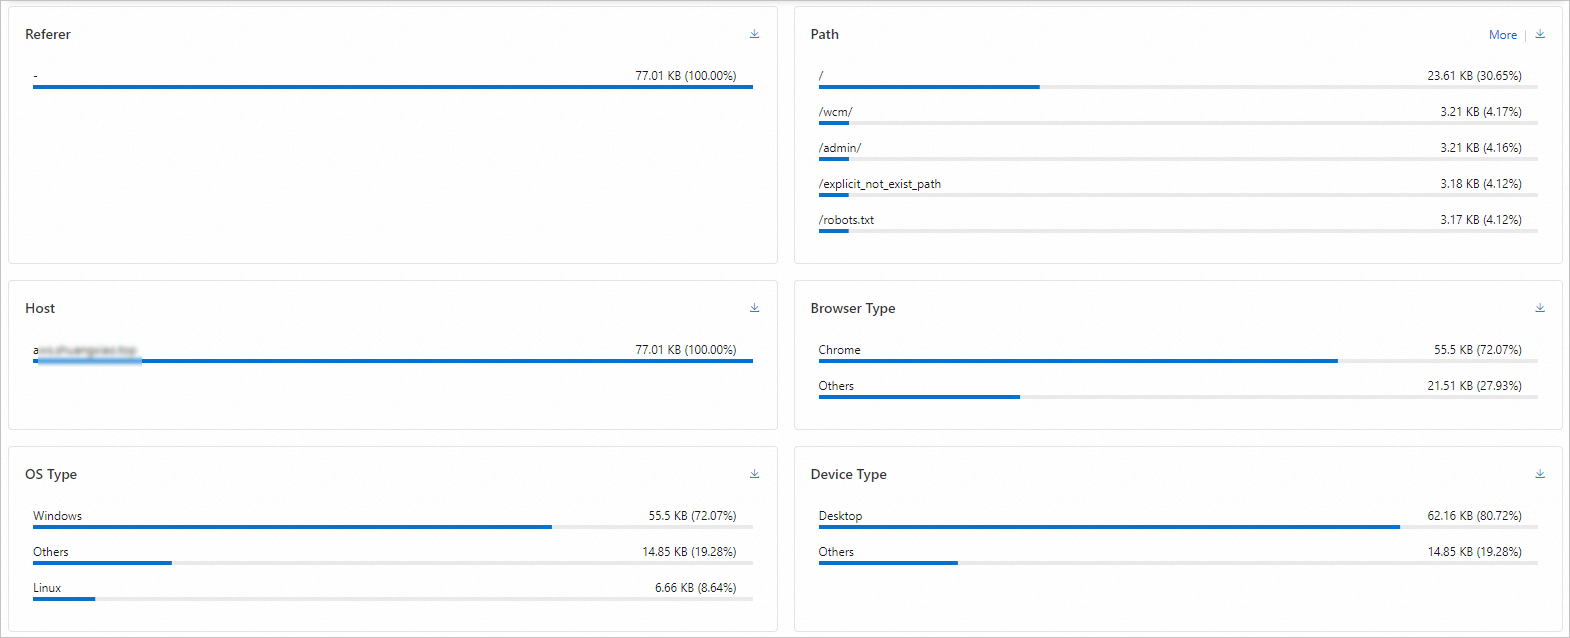
Filter and analyze abnormal requests by client IP
Using the multi-dimensional analysis modules on the Traffic Analysis page, you can view request statistics by client IP to quickly find IPs with abnormally high request rates and distinguish them from normal traffic.
In the multi-dimensional data area at the bottom of the Traffic Analysis page, find the client IP dimension and click More to view the complete IP list.
Observe the number of requests and traffic percentage for each IP. If a single IP generates a request volume far exceeding normal business levels in a short period (for example, the number of requests per minute from a single IP is several times higher than the normal peak), it can be identified as an abnormal IP. Use the time filter to select the suspected traffic abuse period and compare the IP request distribution between normal and abnormal periods.
After you confirm the abnormal IPs, use an IP access rule to manage them with a blacklist or whitelist. Add the confirmed malicious IPs to a blacklist to block them, and add your own server or partner IPs to a whitelist to allow them.
Standard log analysis
To identify the characteristics of abuse requests, you need to analyze standard logs from the alert period. By cross-analyzing multiple fields, you can build a profile of the abuse behavior based on dimensions such as source IP, URL path, request parameters, User-Agent, and Referer. This data supports the creation of precise countermeasures.
Download the standard log.
Upload the log file to a local Linux server.
Log on to the local Linux server and count the number of lines in the file, which represents the total number of requests.
wc -l [$Log_File]Count the number of visits per hour.
awk -F' ' '{print \$4}' [$Log_File] | sed 's/^\[\(.*\/.*\/.*\):\(.*\):.*$/\1 \2:00/' | sort | uniq -c | sort -nr | head -n 10After you count the total number of requests, you can confirm whether the request volume is abnormal.
ImportantThe following configurations must be based on your actual service requests. Proceed with caution to avoid affecting your normal users.
Run the following command to query the top 10 IPs by visit count.
cat [$Log_File] | awk '{print $3}' |sort|uniq -c|sort -nr |head -10Restrict access from suspicious IPs. For more information, see IP access rule.
Run the following command to query the top 10 User-Agents by visit count.
grep -o '"Mozilla[^"]*' [$Log_File] | cut -d'"' -f2 | sed 's/ ANCHASHI-SCAN[^)]*)//g' | sort | uniq -c | sort -nr | head -n 10Filter suspicious User-Agents. For more information, see Custom Rules.
Run the following command to query the top 10 paths by visit count.
grep -oP '"https?://[^"]+"' [$Log_File] | sort | uniq -c | sort -nr | head -n 10
Targeted measures
You can select appropriate countermeasures based on the characteristics of the attack source. During anomaly analysis, you may find multiple attack characteristics. You can configure multiple mitigation policies simultaneously to achieve comprehensive protection.
WAF mitigation rule
ESA integrates with the edge web application firewall (WAF) to provide WAF protection on ESA POPs. This feature effectively identifies malicious characteristics in business traffic and sends only safe, normal traffic to your origin server. This approach prevents website intrusions, secures core data, and resolves server performance issues caused by malicious attacks.
In the ESA console, select Websites, and in the Website column, click the target site.
In the left-side navigation pane, choose .
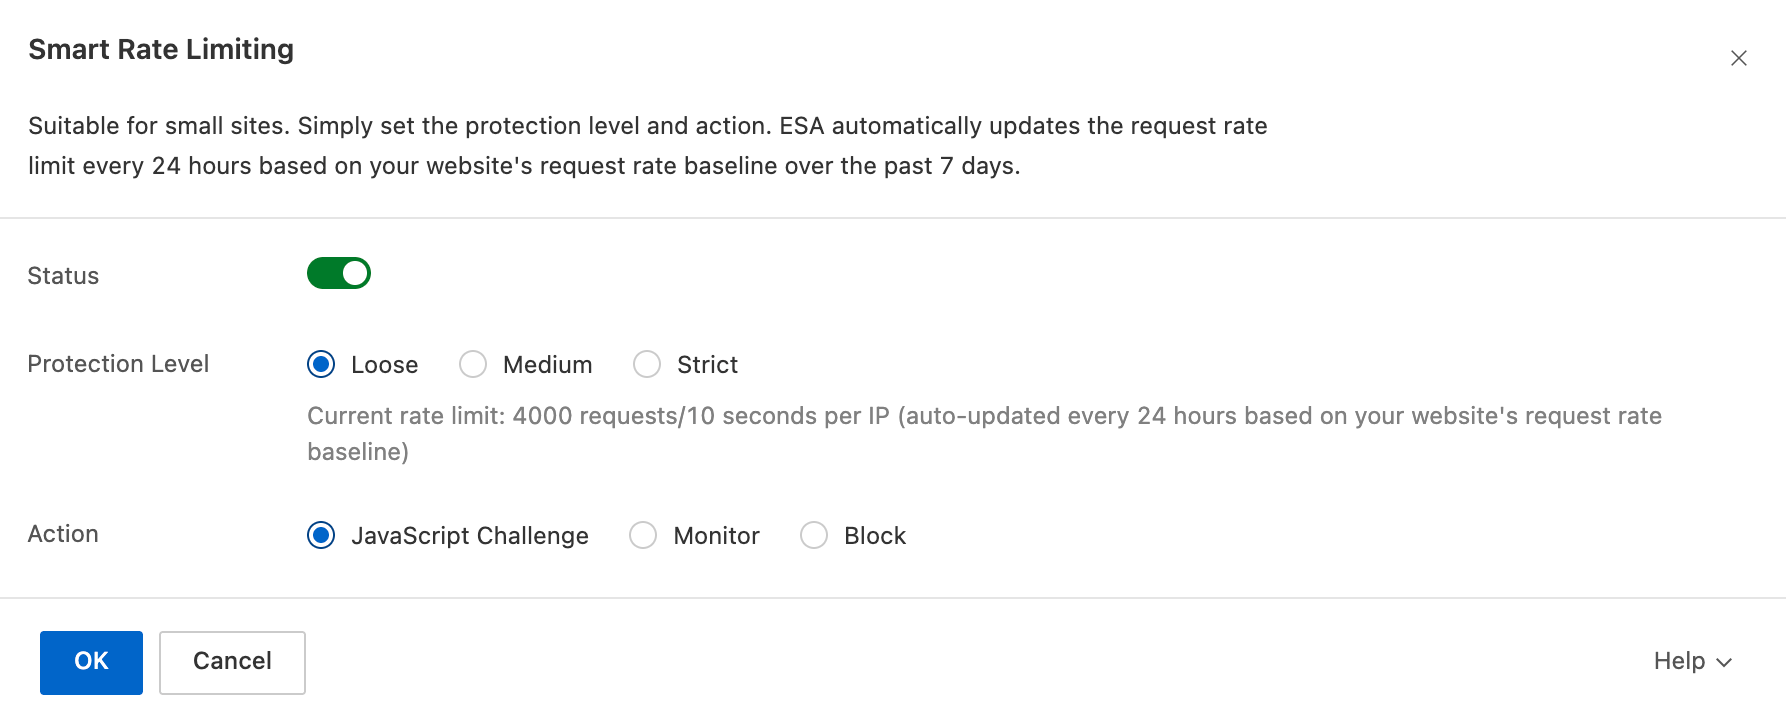
On the Overview tab, in the Smart Rate Limiting area, click Configure, turn on the Status switch, and select an appropriate Protection Level and Action.
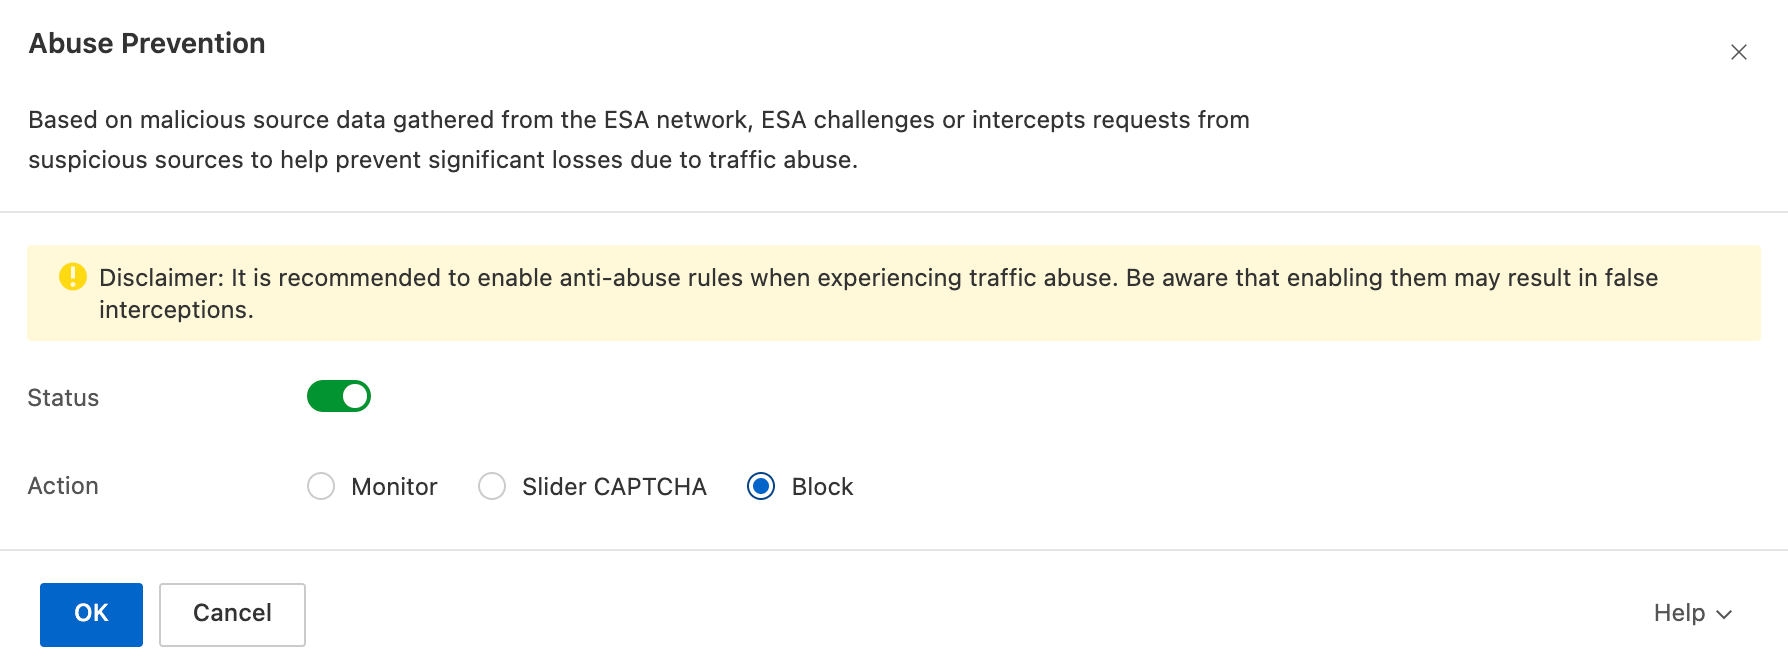
On the Overview tab, in the Abuse Prevention area, click Configure, turn on the Status switch, and select an appropriate Action.
If enabling Smart Rate Limiting and Abuse Prevention does not meet your business needs, you can configure a custom mitigation policy.
Limit requests
Configure the rule as described in rate limiting rule.
A sudden increase in API access volume triggers a monitoring alert. When you view real-time logs, you may find that during an attack period, a single IP accesses the API more than 3,000 times within 60 seconds. During a normal period, a single IP accesses the API at most 100 times within 60 seconds. In this case, you can configure a rate limiting rule with a threshold set to two or three times the normal access frequency.
NoteYou must view real-time logs to locate the attacked resource and compare the access frequency during attack and normal periods. If you find a discrepancy, you can configure this mitigation policy.
In normal business scenarios, if a server calls resources through a public API and access is concentrated from internal IPs, you must add a match condition to exclude those IPs from being counted.
You must adjust the protection path and trigger threshold based on your business needs and the attacker's access frequency found in real-time logs. The following is a configuration example.
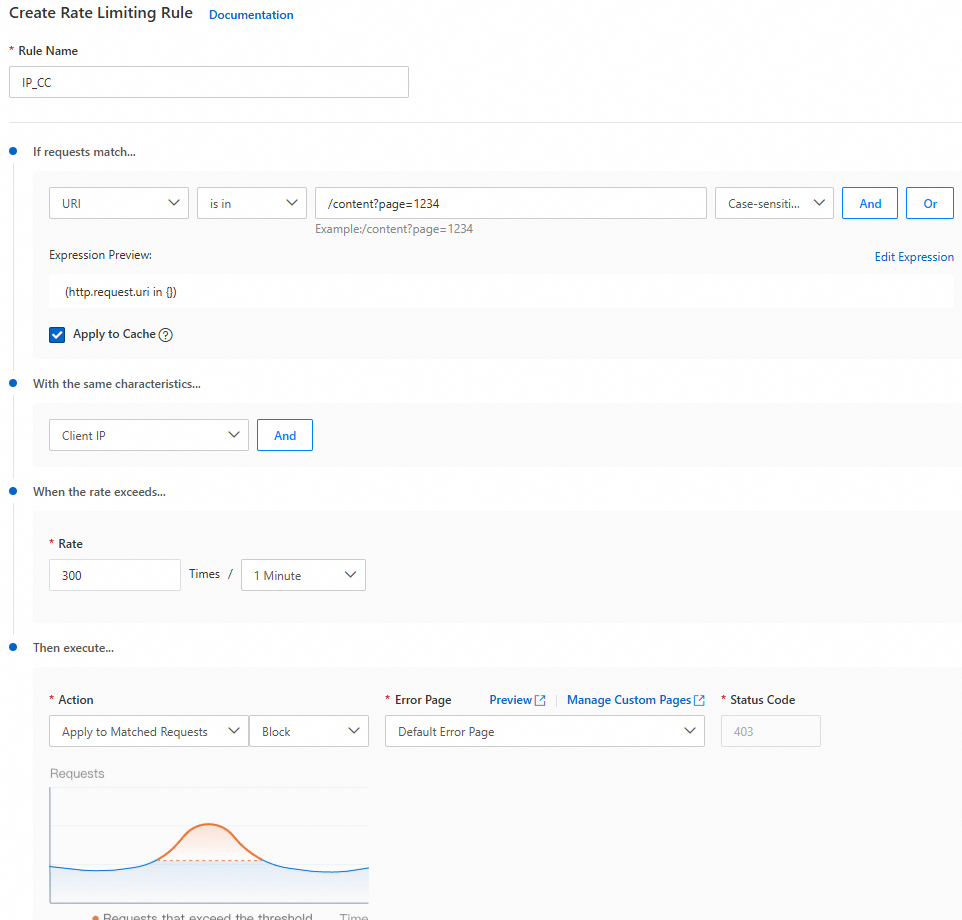
Parameter
Example
Description
Rule Name
A custom rule name. The name must meet the following requirements:
It can contain Chinese characters, letters, digits, and underscores (
_).The name can be up to 64 characters long.
N/A
If requests match...
URI contains
/your_pathFilters requests where the resource path contains
/your_path.With the same characteristics...
Client IP
Specifies the client IP as the statistical object.
When the rate exceeds...
Rate: 300 times/1 minute
If a client IP matches the condition more than 300 times within 1 minute, the action is triggered for that IP.
Then execute...
Apply to Matched Requests: Block, Duration: 1 Hour
Blocks the client IP that triggers the rule for 1 hour (3,600 seconds). All subsequent requests from this IP are blocked during this period.
Block requests
Configure the rule as described in Custom Rules.
NoteFor app scenarios where a normal User-Agent is empty, do not use this policy.
If the User-Agent value is an app name for normal business, you must add the app name to the match content.
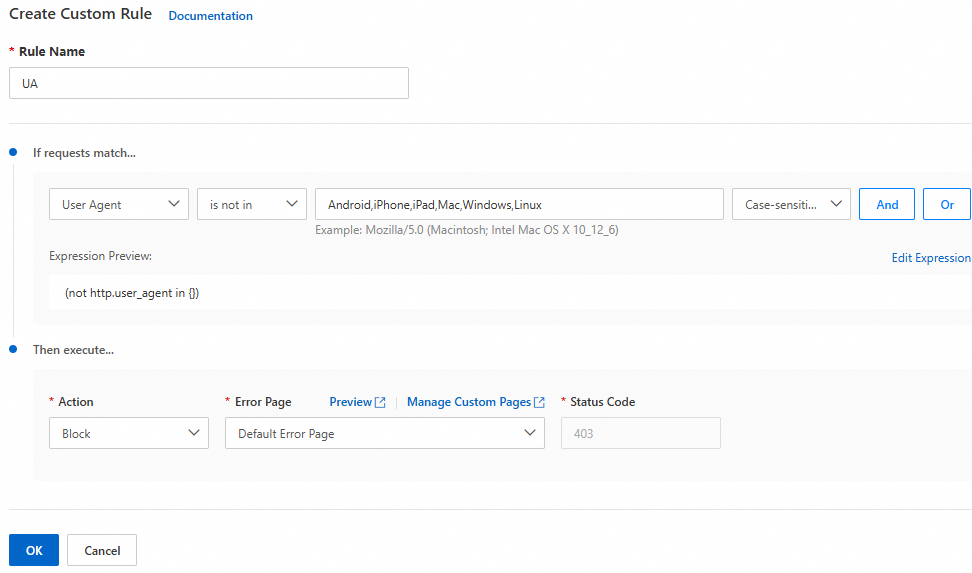
Parameter
Example
Description
Rule Name
A custom rule name. The name must meet the following requirements:
It can contain Chinese characters, letters, digits, and underscores (_).
The name can be up to 64 characters long.
If the User-Agent of a request does not contain
Android,iPhone,iPad,Mac,Windows,Linux, the request is blocked.Matching Condition
Set Match Field to User-Agent.
Set Logical Operator to Does not equal any of.
Enter
Android,iPhone,iPad,Mac,Windows,Linuxfor Match Content.
Then execute...
Actions: Select Block.
Error Page: Select Default Block Page.
Status Code: 403.
Block IPs
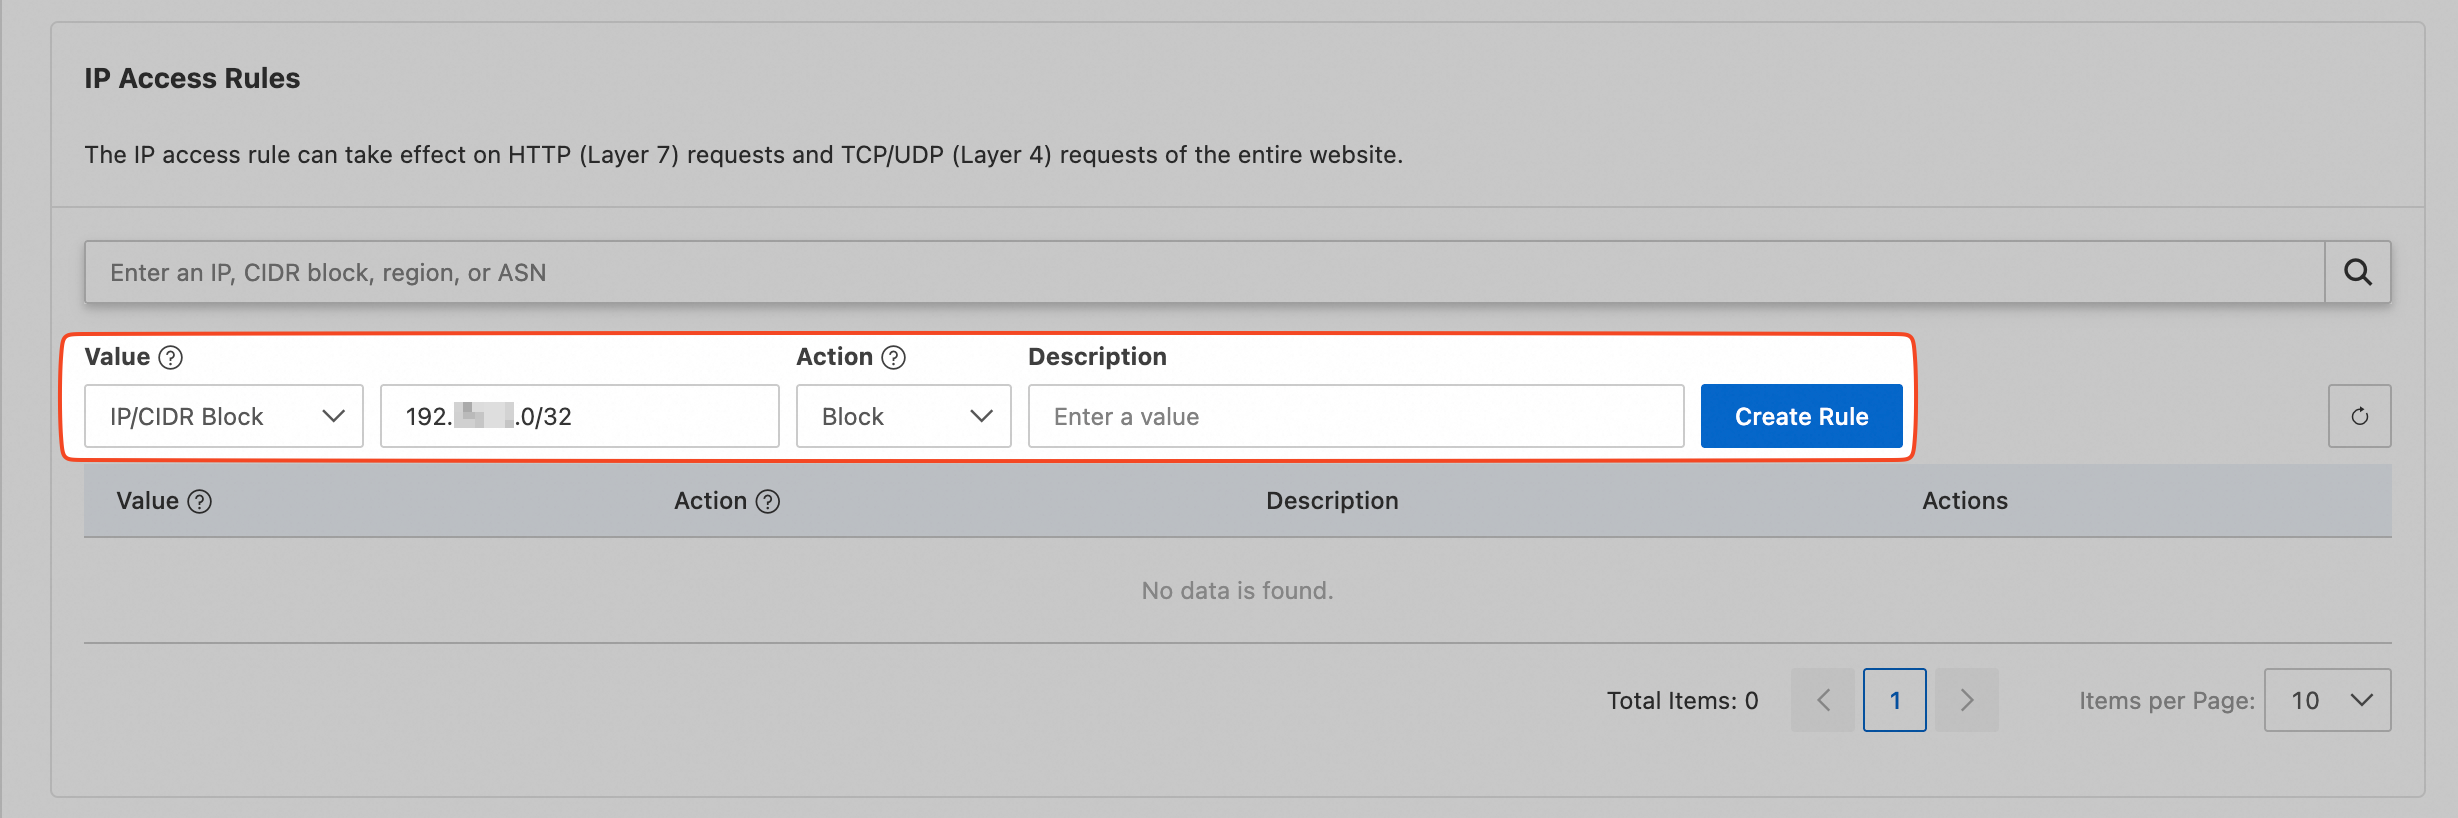
Configure the rule as described in IP access rule.
Bot blocking
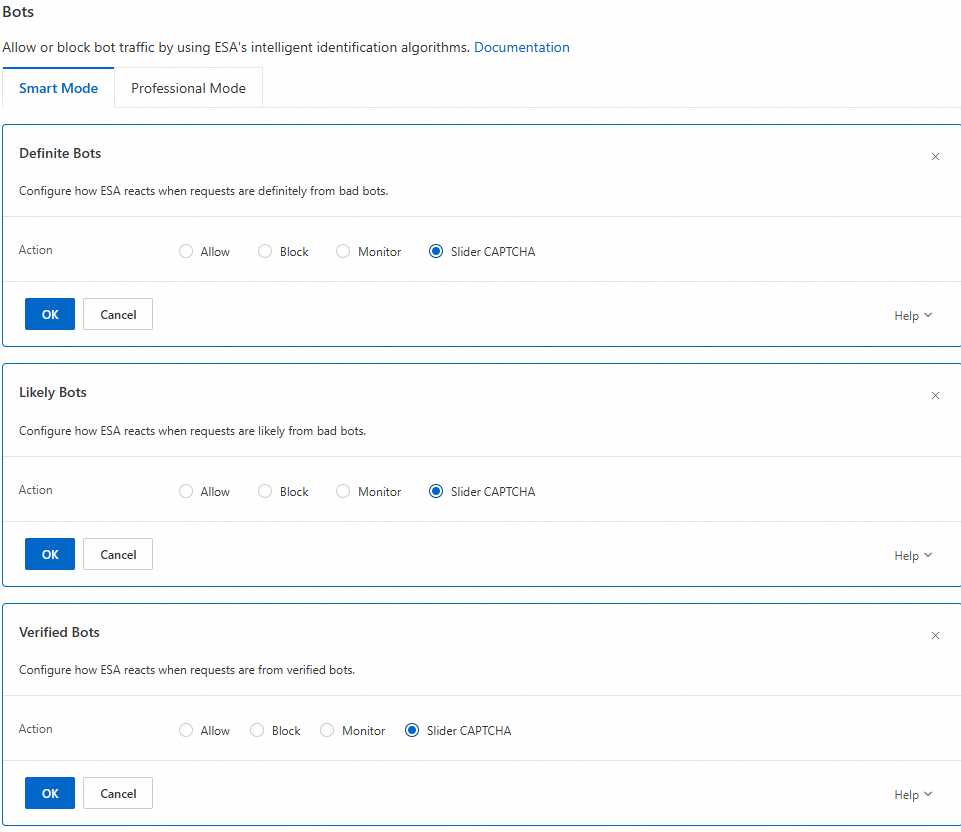
Configure the rule as described in Bots Quick Start and enable the relevant protection items as needed.
Mitigation examples
Game installation package abuse
Background
A gaming company has received unexpectedly high ESA bills for a game that has been running stably for two years.
Anomaly detection
By monitoring traffic and analyzing logs with a real-time log delivery task, the customer discovered multiple instances of high-frequency requests to download the installation package. Within one hour, the PC download count reached 310,000, and the Android download count reached 18,000.
After you enable real-time log delivery and logs are successfully delivered, you are billed based on the number of delivered log entries.

When analyzing requests to download the Android package, the customer found that the User-Agent in the anomalous requests indicated a PC, not an Android device.

Most users download APK packages directly to their phones. Few users download them to a PC and then transfer them to their phones for installation. Therefore, the customer concluded from the User-Agent that an attacker was generating the requests.
An analysis of the request frequency and resources showed that a single IP accessing an APK package more than 300 times per minute and an .exe package more than 5,100 times per minute is clearly abnormal.
Solution
The solution is to use access control to identify users and protect against high-frequency resource downloads.
IP blocking: Set a blacklist rule to block the top-offending IPs. For more information, see IP access rule.
Resource rate limiting: Create a rule to limit requests from a single IP for resources with the
.exeor.apksuffix to 20 times per 60 seconds. For more information, see rate limiting rule.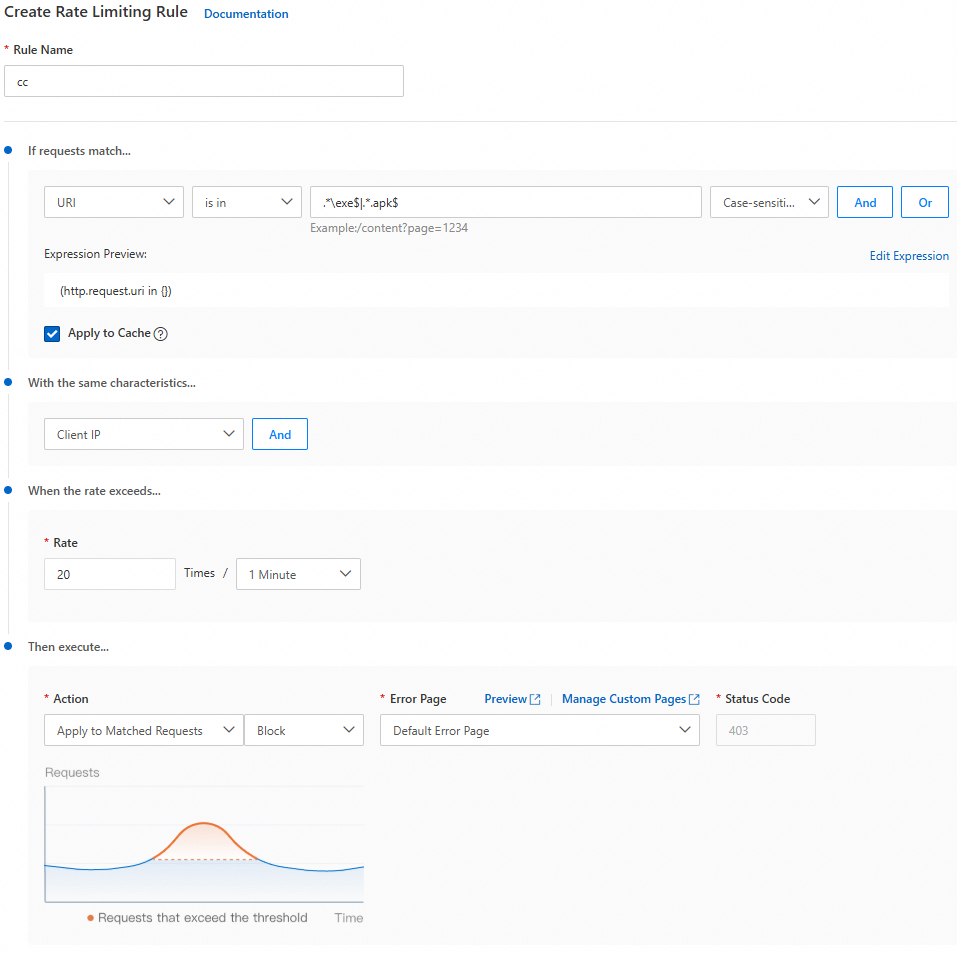
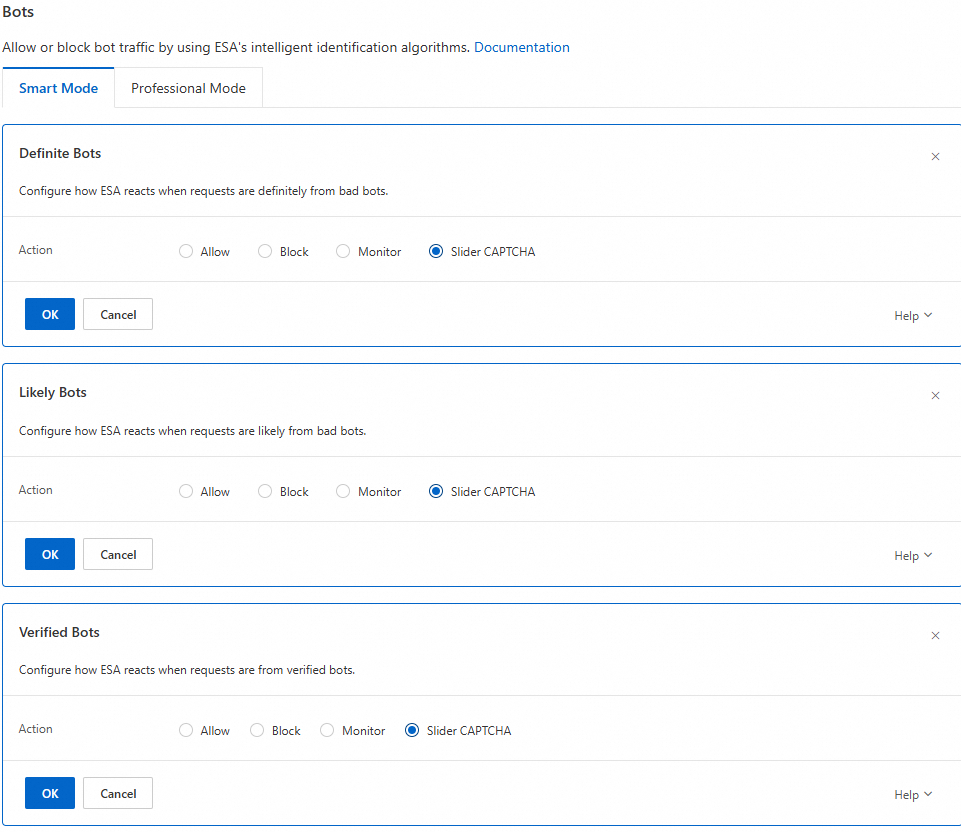
Bot prevention: In the rule, enable the bot threat intelligence feed and slider CAPTCHA verification. For more information, see Bots Quick Start.
Website resource theft
Background
An e-commerce customer, Customer A, has a website that has been running stably. Recently, the customer discovered that other websites were frequently hotlinking their website's image content in a short period.
Anomaly detection
By monitoring traffic and analyzing logs with a real-time log delivery task, the customer found spoofed Referer information in the logs.

An SQL query on refer_domain showed more than 10,000 visits in just over ten minutes.

A check of the refer_domain shows an inconsistency between the refer_domain and domain, which indicates resource hotlinking. Furthermore, the high request volume confirmed it was a malicious attack.
Solution
Use a custom rule to block requests where the domain and refer_domain are inconsistent.