NetACC is a user-mode library that accelerates TCP applications via eRDMA with compatible socket interfaces—no code changes required.
NetACC is in public preview.
Use cases
NetACC suits high-network-overhead scenarios.
High packets per second (PPS) workloads, especially small-packet traffic. NetACC reduces CPU overhead and improves throughput, such as when Redis processes requests.
Latency-sensitive workloads: eRDMA delivers lower latency than TCP, accelerating network responses.
Frequent short-lived connections: NetACC accelerates connection establishment, reducing creation time and improving performance.
Install NetACC
Installation methods
Use the eRDMA driver to install NetACC
NetACC is automatically installed with the eRDMA driver. See Enable eRDMA in the "Use eRDMA" topic.
Separately install NetACC
To install a specific version of NetACC or use it temporarily on an ECS instance, run:
sudo curl -fsSL https://netacc-release.oss-cn-hangzhou.aliyuncs.com/release/netacc_download_install.sh | sudo sh
Configuration file and optimized parameters
After installation, the
/etc/netacc.confconfiguration file is generated automatically. You can tune the following parameters based on your workload:NACC_SOR_MSG_SIZE: buffer size.NACC_RDMA_MR_MIN_INC_SIZE: size of the first Memory Region (MR) registered by RDMA.NACC_RDMA_MR_MAX_INC_SIZE: maximum MR size registered by RDMA.NACC_SOR_CONN_PER_QP: connections per Queue Pair (QP).NACC_SOR_IO_THREADS: number of NetACC threads.
The following example shows a sample configuration file:
Use NetACC
Use NetACC in applications by running the netacc_run command or setting the LD_PRELOAD environment variable. Read the Considerations section before proceeding.
Run the netacc_run command
netacc_run loads NetACC at application startup. Prefix your application command with netacc_run to start the application with NetACC enabled.
netacc_run accepts parameters such as -t (I/O threads) and -p (connections per QP). Parameters specified when you run the netacc_run command override the configuration file.
Examples:
The following examples use Redis. Prefix a Redis command with
netacc_runto start Redis with NetACC.Start Redis with NetACC:
netacc_run redis-serverStart redis-benchmark with NetACC:
netacc_run redis-benchmark
Configure the LD_PRELOAD environment variable
The LD_PRELOAD environment variable specifies shared libraries preloaded at program startup. Set it to the NetACC library in the LD_PRELOAD variable to automate loading.
Query the location of the NetACC dynamic library:
ldconfig -p | grep netaccSample output:
[ecs-user@i          ~]$ ldconfig -p | grep netacc
libnetacc-preload.so (libc6,x86-64) => /lib64/libnetacc-preload.so
libnetacc_cx.so (libc6,x86-64) => /lib64/libnetacc_cx.so
[ecs-user@i          ~]$
Set the
LD_PRELOADenvironment variable to the NetACC shared library:LD_PRELOAD=/lib64/libnetacc-preload.so your_applicationReplace
your_applicationwith the target application.Examples (Redis):
Start Redis with NetACC:
LD_PRELOAD=/lib64/libnetacc-preload.so redis-serverStart redis-benchmark with NetACC:
LD_PRELOAD=/lib64/libnetacc-preload.so redis-benchmark
Monitor NetACC
netacc_ss is the NetACC monitoring tool. Run the netacc_ss command to check the data transfer status of NetACC-accelerated TCP processes. You can run it on both the server and client.
Query data transfer status of NetACC-accelerated TCP processes:
netacc_ss -s all -p <Process ID>To query a process ID, run ps -ef | grep <Process name>.
Usage notes
Only TCP connections established through ENIs with the eRDMA Interface (ERI) feature enabled are converted to RDMA connections. Other connections remain TCP.
NoteIf neither communication end has an ERI-enabled ENI, NetACC falls back to TCP.
RDMA socket file descriptors cannot be sent to other processes via kernel IPC.
NoteRDMA connections are bound to specific QPs that cannot be shared among processes.
NetACC does not support IPv6. To prevent conflicts, disable IPv6 by running
sysctl net.ipv6.conf.all.disable_ipv6=1.NetACC does not support hot updates. Stop all NetACC-accelerated processes before updating NetACC.
NetACC does not support certain TCP socket options, such as SO_REUSEPORT, SO_ZEROCOPY, and TCP_INQ.
NetACC depends on glibc and cannot run in non-glibc environments, such as Golang.
Before using NetACC, set the maximum lockable memory to unlimited by running
ulimit -l unlimited.NoteIf the ulimit -l value is too small, RDMA may fail to register MRs that exceed the limit.
When a NetACC-accelerated application listens on a TCP port, NetACC also listens on an RDMA port (TCP port + 20000) for RDMA data transfer.
NoteIf the RDMA port is occupied or outside the valid range, the connection fails. Allocate ports properly to avoid conflicts.
A child process does not inherit socket connections established by the parent process after a
fork()call.NoteThe child process must establish a new socket connection.
QP reuse is disabled by default.
To enable QP reuse, set connections per QP (-p) to a value greater than 1 via the
NACC_SOR_CONN_PER_QPparameter in the NetACC configuration file or thenetacc_runcommand.QP reuse reduces the number of QPs, management overhead, and resource consumption, improving communication efficiency in high-concurrency scenarios.
With QP reuse enabled, multiple RDMA connections may share a local port number because port numbers identify QPs, not individual connections.
NoteIf your applications require distinct local port numbers (e.g., for different services), disable QP reuse to avoid port conflicts.
Use NetACC in Redis applications
Benefits of NetACC for Redis applications
Improved system throughput
NetACC reduces CPU overhead and improves throughput for high-PPS Redis workloads.
Accelerated network responses
NetACC leverages eRDMA low latency to accelerate Redis network responses.
NetACC used in Redis performance benchmarks
Redis-benchmark is a built-in Redis utility that measures server performance by simulating concurrent client requests.
Test scenario
Use NetACC with redis-benchmark to simulate 100 clients across 4 threads sending 5 million SET requests.
Prerequisites
Create two eRDMA-capable ECS instances. Select Auto-install eRDMA Driver and eRDMA Interface to enable ERI for the primary ENI. Use one instance as the Redis server and the other as the client.
Instance configurations:
Image: Alibaba Cloud Linux 3
Instance type: ecs.g8ae.4xlarge
Primary ENI private IP address: 172.17.0.90 (server) and 172.17.0.91 (client). Replace with actual values in your benchmark.
NoteThis benchmark enables ERI on the primary ENIs. 172.17.0.90 is the primary ENI private IP of the Redis server instance.
If ERI is enabled on secondary ENIs, use their private IP addresses instead. See Enable eRDMA in the "Use eRDMA" topic.
Note the following parameters when creating the instances. For other parameters, see Custom launch ECS instances.
Instances & Images: Select an instance type that supports eRDMA and install the eRDMA driver.
Instance: See Limitations.
Images: Select Public Image and then select Install eRDMA Driver. The eRDMA driver is automatically installed when the instance starts.
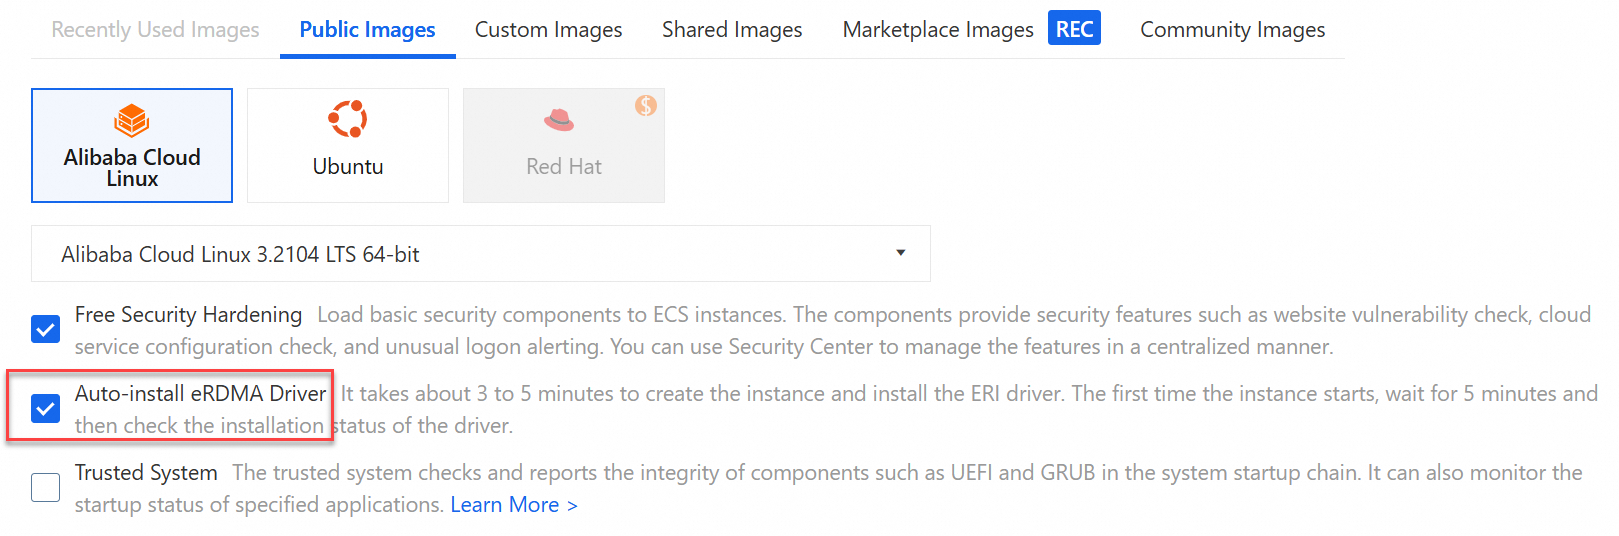
ENIs: To the right of Primary ENI, enable the ERI feature to bind an ERI to the ECS instance.
NoteWhen you create an enterprise-level instance, you can enable the ERI feature only for the primary ENI. If you need to configure eRDMA for a secondary ENI, you can enable the ERI feature for the secondary ENI in the console or by calling an API operation. For more information, see Elastic RDMA network interface (ERI).
Procedure
Connect to both ECS instances (Redis server and client).
Verify that the eRDMA driver is installed.
After the instances start, run
ibv_devinfoto check the eRDMA driver status.The following output indicates the driver is installed.
[root@redis-server ~]# ibv_devinfo
hca_id: erdma_0
	transport:			eRDMA (1)
	fw_ver:				0.2.0
	node_guid:			0216:3eff:fe10:d924
	sys_image_guid:			0216:3eff:fe10:d924
	vendor_id:			0x1ded
	vendor_part_id:			4223
	hw_ver:				0x0
	phys_port_cnt:			1
		port:	1
			state:			PORT_ACTIVE (4)
			max_mtu:		1024 (3)
			active_mtu:		1024 (3)
			sm_lid:			0
			port_lid:		0
			port_lmc:		0x00
			link_layer:		Ethernet

[root@redis-server ~]#
The following output indicates the driver is being installed. Wait a few minutes and try again.
[root@ixxxxxxxxxxxxx Z ~]# ibv_deninfo
-bash: ibv_deninfo: command not found
Install Redis on both instances:
sudo yum install -y redisThe following output indicates Redis is installed.
[root@redis-server ~]# sudo yum install -y redis
Last metadata expiration check: 0:06:35 ago on Tue 03 Sep 2024 10:50:07 AM CST.
Dependencies resolved.
================================================================================
 Package          Architecture       Version              Repository       Size
================================================================================
Installing:
 redis            x86_64             6.2.7-1.0.2.al8      alinux3-updates  1.2 M

Transaction Summary
================================================================================
Install  1 Package

Total download size: 1.2 M
Installed size: 4.3 M
Downloading Packages:
redis-6.2.7-1.0.2.al8.x86_64.rpm                    15 MB/s | 1.2 MB     00:00
--------------------------------------------------------------------------------
Total                                                15 MB/s | 1.2 MB     00:00
Running transaction check
Transaction check succeeded.
Running transaction test
Transaction test succeeded.
Running transaction
  Preparing        :                                                        1/1
  Running scriptlet: redis-6.2.7-1.0.2.al8.x86_64                           1/1
  Installing       : redis-6.2.7-1.0.2.al8.x86_64                           1/1
  Running scriptlet: redis-6.2.7-1.0.2.al8.x86_64                           1/1
  Verifying        : redis-6.2.7-1.0.2.al8.x86_64                           1/1

Installed:
  redis-6.2.7-1.0.2.al8.x86_64

Complete!
[root@redis-server ~]#
Benchmark Redis performance with
redis-benchmark.Perform a benchmark by using NetACC
On the Redis server instance, start Redis with NetACC:
netacc_run redis-server --port 6379 --protected-mode noNoteReplace 6379 with your actual port. See Common parameters used together with the redis-server command.
This example uses
netacc_run. For other methods, see Use NetACC.
The following output indicates Redis started successfully.
[root@redis-server ~]# netacc_run redis-server --port 6379 --protected-mode no
114379:C 03 Sep 2024 10:59:24.477 # oO0OoO0OoO0Oo Redis is starting oO0OoO0OoO0Oo
114379:C 03 Sep 2024 10:59:24.477 # Redis version=6.2.7, bits=64, commit=00000000, modified=0, pid=114379, just started
114379:C 03 Sep 2024 10:59:24.477 # Configuration loaded
114379:M 03 Sep 2024 10:59:24.478 * monotonic clock: POSIX clock_gettime
114379:M 03 Sep 2024 10:59:24.479 # A key '__redis__compare_helper' was added to Lua globals which is not on the globals allow list nor listed on the deny list.

                Redis 6.2.7 (00000000/0) 64 bit

                Running in standalone mode
                Port: 6379
                PID: 114379

                https://redis.io

114379:M 03 Sep 2024 10:59:24.479 # Server initialized
114379:M 03 Sep 2024 10:59:24.479 # WARNING overcommit_memory is set to 0! Background save may fail under low memory condition. To fix this issue add 'vm.overcommit_memory = 1' to /etc/sysctl.conf and then reboot or run the command 'sysctl vm.overcommit_memory=1' for this to take effect.
114379:M 03 Sep 2024 10:59:24.479 * Ready to accept connections
On the Redis client instance, start redis-benchmark with NetACC:
netacc_run redis-benchmark -h 172.17.0.90 -p 6379 -c 100 -n 5000000 -r 10000 --threads 4 -d 512 -t setNoteReplace 172.17.0.90 with the Redis server IP and 6379 with the actual port. See Common command parameters used with redis-benchmark.
Benchmark results may vary with network conditions. The data in this topic is for reference only.
The Summary shows ~770,000 requests/second. For metric details, see Common metrics in redis-benchmark benchmark results.
Perform a benchmark without NetACC
On the Redis server instance, start Redis:
redis-server --port 6379 --protected-mode no --saveNoteReplace 6379 with your actual port. See Common parameters used together with the redis-server command.
The following output indicates Redis started successfully.
[root@redis-server ~]# redis-server --port 6379 --protected-mode no --save
114198:C 03 Sep 2024 10:57:28.957 # oO0OoO0OoO0Oo Redis is starting oO0OoO0OoO0Oo
114198:C 03 Sep 2024 10:57:28.957 # Redis version=6.2.7, bits=64, commit=00000000, modified=0, pid=114198, just started
114198:C 03 Sep 2024 10:57:28.957 # Configuration loaded
114198:M 03 Sep 2024 10:57:28.958 * monotonic clock: POSIX clock_gettime
114198:M 03 Sep 2024 10:57:28.958 # A key '__redis__compare_helper' was added to Lua globals which is not on the globals allow list nor listed on the deny list.

                Redis 6.2.7 (00000000/0) 64 bit
                Running in standalone mode
                Port: 6379
                PID: 114198

                https://redis.io

114198:M 03 Sep 2024 10:57:28.958 # Server initialized
114198:M 03 Sep 2024 10:57:28.958 # WARNING overcommit_memory is set to 0! Background save may fail under low memory condition. To fix this issue add 'vm.overcommit_memory = 1' to /etc/sysctl.conf and then reboot or run the command 'sysctl vm.overcommit_memory=1' for this to take effect.
114198:M 03 Sep 2024 10:57:28.958 * Ready to accept connections
On the Redis client instance, start redis-benchmark:
redis-benchmark -h 172.17.0.90 -c 100 -n 5000000 -r 10000 --threads 4 -d 512 -t setNoteReplace 172.17.0.90 with the Redis server IP and 6379 with the actual port. See Common command parameters used with redis-benchmark.
Benchmark results may vary with network conditions. The data in this topic is for reference only.
The Summary shows ~330,000 requests/second. For metric details, see Common metrics in redis-benchmark benchmark results.