If packet loss occurs or a network connection cannot be established when you run the ping command to test network connectivity, you can use testing tools, such as My Traceroute (MTR), to test the network path and diagnose the issue. This topic describes how to use MTR to test a network path and analyze the test results.
Test workflow
The following figure shows the flowchart for testing a network path.

You can access an IP address search website, such as IPLark, to obtain the public IP address of your local network.
The server represents the domain name or public IP address of a server.
Testing tools
MTR is a network diagnostic tool that combines the traceroute and ping features to check the health of a network path. MTR continuously probes all nodes of the network path and provides probe results. MTR can prevent node changes from affecting test results. You can use MTR to obtain accurate results.
If you use a Linux operating system, install the mtr package to use MTR. For Windows operating systems, you can use WinMTR. The following section describes how to install and use the preceding tools.
MTR (Linux)
Install MTR
CentOS 6, CentOS 7, or CentOS 8
Ubuntu or Debian
Use MTR
Command syntax
The mtr command is in the following format. The hostname parameter specifies the domain name of the server, and the ip parameter specifies the public IP address of the server.
mtr [options] hostname/ipParameters
The following table describes the optional parameters that can be used in the preceding command. You can run the man mtr command to view the description of other parameters.
Optional parameter | Description |
| Switches MTR to report mode. |
| Configures MTR to display the results in a format that is suitable for a split-user interface. |
| Specifies the size of each ping packet. |
| Configures MTR to display numeric IP addresses and prevents MTR from resolving the domain names. |
| Configures source IP addresses for packets. Note You can use this parameter in scenarios in which a host has multiple IP addresses. |
-4 | Uses only IPv4. |
-6 | Uses only IPv6. |
After you run the mtr command, the operating system automatically enters interactive mode. In interactive mode, you can press the ? or h key to display the Help menu and control the behavior of the mtr tool or switch between display views based on the help documentation.
Examples
Run an MTR test by using IPv4.
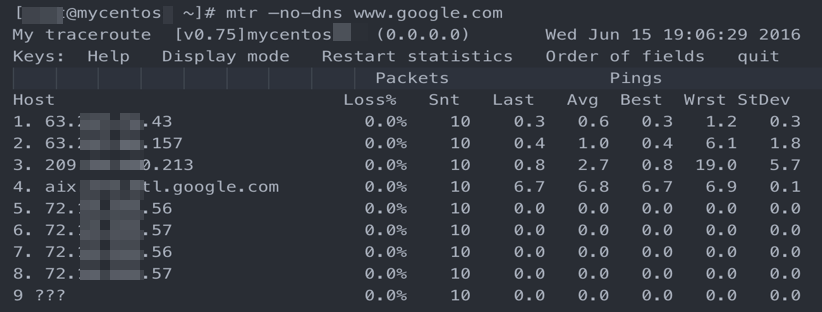
sudo mtr -4 www.aliyun.comSample mtr command output
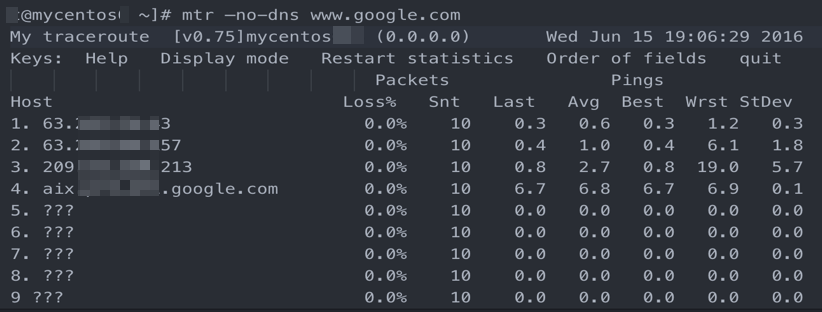
For example, if the mtr <Destination IP address> command is run, the following command output is displayed.
The following table describes the parameters in the command output based on the default configurations.
Parameter | Description |
Host | The IP address or domain name of the node. You can press the |
Loss% | The packet loss rate of the node. |
Snt | The number of packets that are sent. Default value: 10. You can specify the value by using the |
Last | The latency of the previous probe. |
Avg | The average latency of all probes. |
Best | The lowest latency of all probes. |
Wrst | The highest latency of all probes. |
StDev | The standard deviation of the latency on the node. A higher value indicates a larger difference between the response times for data packets on the node. |
WinMTR (Windows)
Install WinMTR
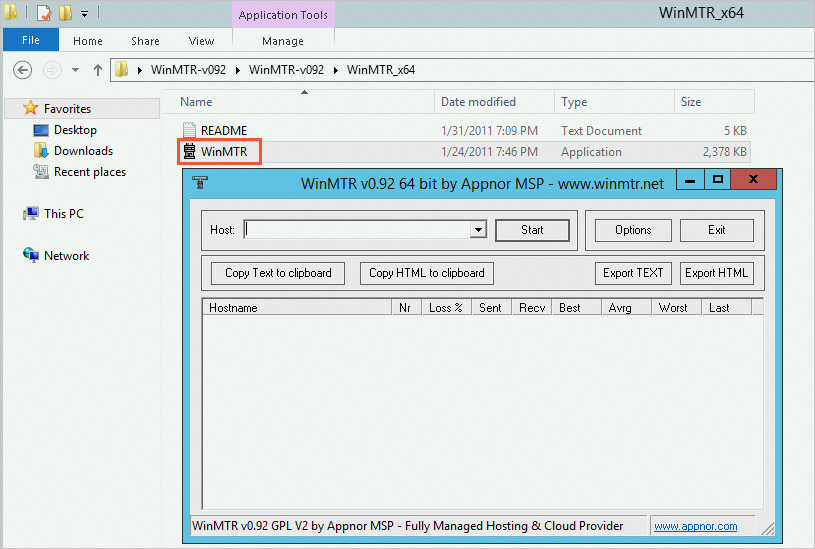
After you download the WinMTR package, you do not need to install WinMTR. You can start WinMTR after you decompress the package. Perform the following steps:
Download WinMTR from the WinMTR official website.
Decompress the WinMTR package and double-click WinMTR.exe to start WinMTR.
Use WinMTR
In the WinMTR window, enter the IP address or domain name of the destination server in the Host field.
ImportantThe specified IP address or domain name cannot contain spaces.
You can configure other features or parameters. The following table describes the features and parameters.
Feature or parameter
Description
Copy Text to clipboard
Copies the test results to the clipboard as text.
Copy HTML to clipboard
Copies the test results in the HTML format to the clipboard.
Export TEXT
Exports the test results to a file in the text format.
Export HTML
Exports the test results to a file in the HTML format.
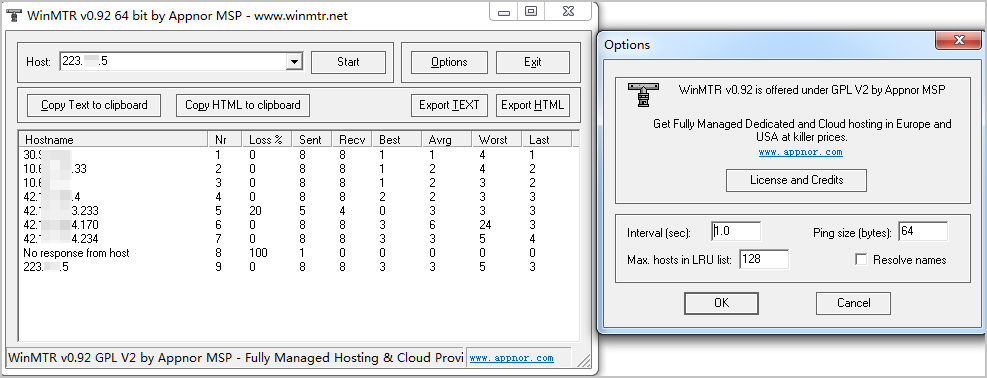
Options
The optional parameters, including:
Interval (sec): the interval between probes. Default value: 1. Unit: seconds.
Ping size(bytes): the size of each packet used for ping probes. Default value: 64. Unit: bytes.
Max. hosts in LRU list: the maximum number of hosts on the least recently used (LRU) list. Default value: 128.
Resolve names: specifies that the domain names of nodes are displayed instead of the IP addresses of the nodes.
Click Start to perform a test.
After you start the test, Start changes to Stop and WinMTR displays the test results.
Wait for WinMTR to run for a period of time and click Stop to stop the test.
Sample test results returned by WinMTR
For example, if the domain name of the destination server is used in WinMTR to perform a test, the following test results are displayed.
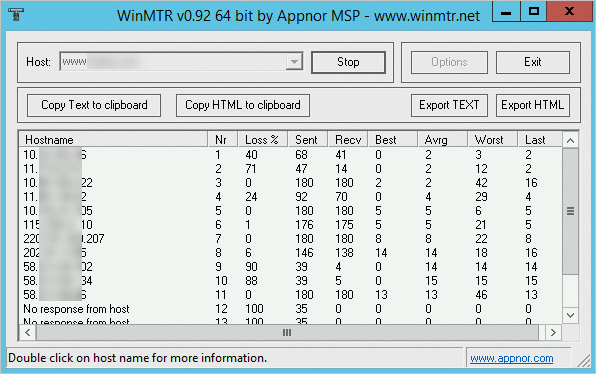
The following table describes the parameters in the test results based on the default configurations.
Parameter | Description |
Hostname | The IP address or domain name of the node. |
Nr | The number of the node. |
Loss% | The packet loss rate of the node. |
Sent | The number of packets that are sent. |
Recv | The number of packets that are received. |
Best | The lowest latency of all probes. |
Avg | The average latency of all probes. |
Worst | The highest latency of all probes. |
Last | The latency of the previous probe. |
StDev | The standard deviation of the latency on the node. A higher value indicates a larger difference between the response times for data packets on the node. |
Analyze the test results
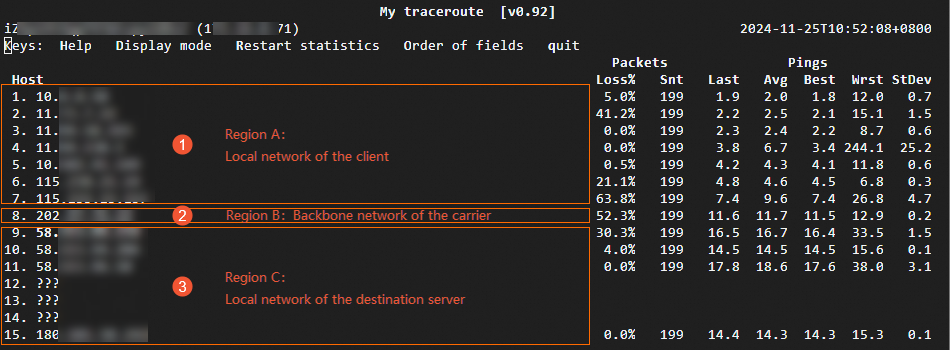
The mtr command provides high accuracy. This section provides an analysis of the test results that are returned by the mtr command. The following figure shows a sample mtr command output.
Networks
In most cases, the network path from a client to a destination server travels across the following networks. For information about the networks and suggestions on how to troubleshoot issues in the networks, refer to the following section:
Local network of the client
The local network of the client consists of a LAN and the networks of local carriers, as shown in Region A in the preceding figure.
If an exception occurs on a node in the LAN, check the LAN and troubleshoot the exception.
If an exception occurs on a node in the network of a local carrier, report the exception to the local carrier.
Carrier networks
The network path travels across the backbone networks of multiple carriers, as shown in Region B in the preceding figure. If an exception occurs on a node in carrier networks, you can query the IP address of the node to identify the carrier to which the IP address belongs. Then, contact the carrier or Alibaba Cloud after-sales technical support for troubleshooting.
Local network of the destination server
The destination server resides in the network of a carrier, as shown in Region C in the preceding figure. If an exception occurs on a node in the local network of the destination server, report the exception to the carrier.
If specific intermediate nodes on the network path are load-balanced, the mtr command numbers, probes, and collects the MTR data of only the start and end nodes. For other nodes, the command output indicates only the IP address or domain name information of each node.
Metric-based analysis
To analyze the connectivity or performance of a network path, you can perform a comprehensive analysis and make judgments based on metrics, such as packet loss rate (Loss%), average value (Avg), standard deviation (StDev), and latency. The following section describes how to analyze the connectivity or performance of a network path based on the preceding metrics:
Loss%
If the packet loss rate (Loss%) of a node is not zero, a network exception may occur at this hop. Packet loss may occur on a node due to the following reasons:
The ICMP transmission rate of the node is limited by the carrier for security purposes or performance reasons.
An exception occurred on the node. In this case, check whether packet loss occurred on the subsequent nodes to identify the cause of packet loss.
If no packet loss occurred on the subsequent nodes, the packet loss on the node is caused by the ICMP throttling policy of the carrier, as shown in the second hop in the preceding figure. You can ignore the packet loss issue.
If packet loss occurred on all subsequent nodes, a network exception occurred on the node and caused packet loss, as shown in the sixth hop in the preceding figure.
If packet loss occurred only on some of the subsequent nodes, the ICMP transmission rate of the node is limited by the carrier and a network exception occurred on the node. In this case, if packet loss repeatedly occurred on the node and the subsequent nodes and the packet loss rate of each node is different, the packet loss rate of the last several hops takes precedence. Packet loss occurred on the sixth, seventh, eighth, and ninth hops, and the packet loss rate of the ninth hop is 30.3%, as shown in the preceding figure. The packet loss rate of the ninth hop is used for reference.
Avg and StDev
The Wrst and Best values of a node may significantly differ due to factors such as link jitters. Avg indicates the average latency of all probes after the MTR test starts and reflects the network quality of a node. A higher StDev value indicates a larger difference between the latencies of data packets on a node and that data packets are more discrete on the node. You can determine whether the Avg value reflects the network quality of a node based on StDev. For example, if the StDev value is high, the latency of packets fluctuates. Specific packets may be sent with low latency, such as 25 ms, and other packets may be sent with high latency, such as 350 ms. In this case, the final Avg value may be in the normal range. In this scenario, the Avg value does not reflect the actual network quality.
We recommend that you analyze the Avg value and the StDev value based on the following items:
If the StDev value of a node is high, check the
Bestvalue andWrstvalue of the node to determine whether a network issue occurred on the node.If the StDev value of a node is not high, determine whether a network issue occurred on the node based on the Avg value of the node.
NoteNo time range standards can be used to determine whether the StDev value of a node is high or not. You can determine whether the StDev value of a node is high based on the other latency values of the node. For example, if the Avg value is 30 ms and the StDev value is 25 ms, the StDev value is determined as high. If the Avg value is 325 ms and the StDev value is 25 ms, the StDev value is determined as not high.
Latency
Latency spike at hops
If latency spikes after a hop, a network exception occurs on the node at the hop. The preceding figure shows that latency spiked after the sixth hop. A network exception occurred on the node at the hop. A high latency does not indicate that an exception occurs on a node. The preceding figure shows that even if latency spiked after the sixth hop, the test data reached the destination host. High latency may also occur on the response path. We recommend that you perform a reverse path test to analyze the issue.
Latency increase caused by ICMP throttling
ICMP throttling on a node may also increase node latency but does not affect latency on the subsequent nodes. The preceding figure shows that the packet loss rate at the ninth hop reaches 30% and a latency spike occurred at the hop. The latency on the subsequent nodes immediately decreased to normal levels. In this case, the latency spike and the packet loss on the node are caused by ICMP throttling.
Sample analysis and conclusions
Based on the path test results shown in the preceding figure and the description of metric-based analysis, you can obtain the following conclusions:
In the local network of the client, packet loss occurred at the second, sixth, seventh, eighth, and ninth hops, but the packet loss is not severe at the third, fourth, fifth, tenth, eleventh, and fifteenth hops. If no exceptions occur on the service requests in the network, the packet loss at the second, sixth, seventh, eighth, and ninth hops may be caused by ICMP throttling.
The
Wrstvalue of the fourth hop is relatively high, but theAvgvalue of the hop is not high, which may indicate an instantaneous network path fluctuation caused by network fluctuation or device performance fluctuation in a probe.The average latency of all nodes in the network path is between 1.8 ms and 17.6 ms, which indicates that the network latency of the network path is low.
The preceding conclusion indicates that no exceptions occur on the network path. If network fluctuation exists in the actual business network, you can analyze the reverse and forward path test results.
You can flexibly analyze the network path test results. The preceding analysis only provides a common method for analyzing metrics. When you analyze the network path test results, you must perform a comprehensive evaluation based on your actual business scenario. This way, you can obtain accurate conclusions. If a one-way network path test does not provide a clear conclusion, you can perform a reverse network path test to analyze and identify issues in depth.
Common scenarios for path exceptions
This section describes common scenarios in which exceptions occur on network paths. In the examples, the mtr command is run on a Linux operating system. The test results that are returned vary based on the operating system and testing tool.
Misconfigured network of the destination host
In this example, all packets are lost at the end of data transmission, as shown in the preceding figure. ICMP may be disabled in the security policies of the destination server, such as firewall policies and iptables policies. As a result, the destination host cannot send responses, and packets cannot reach the destination IP address. You must check the security policies of the destination server.
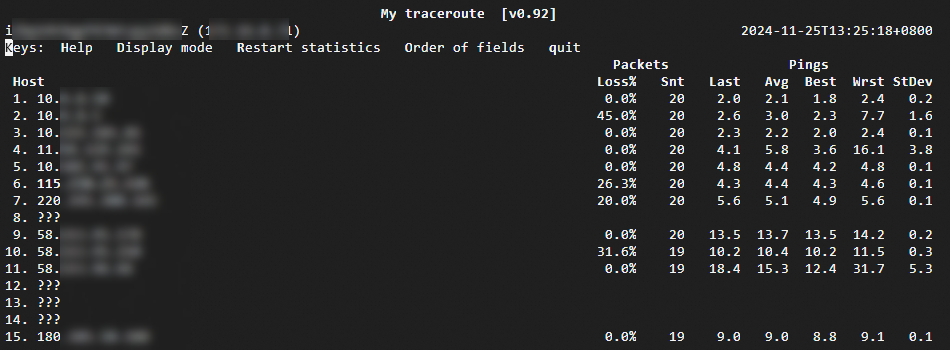
ICMP throttling
In this example, the packet loss rate is high at the end of data transmission, as shown in the preceding figure. ICMP may be disabled in the security policies of the destination server, such as firewall policies, iptables policies, or the throttling policies of carriers. As a result, the destination host cannot send responses, and packets cannot reach the destination IP address. You must check the security policies of the destination server or perform a reverse path test to analyze the issue.
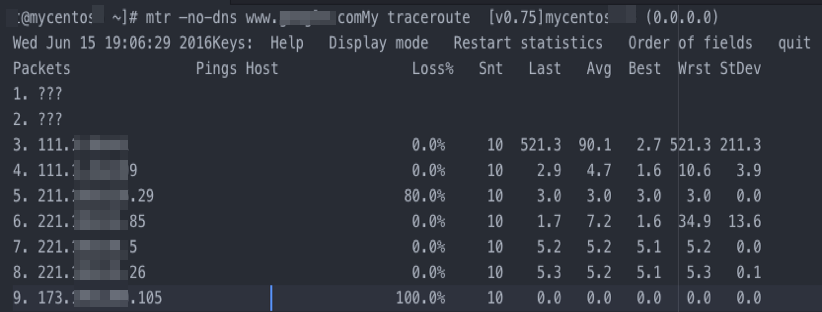
Loop
In this example, a routing loop occurred after packets passed through the fifth hop and packets could not reach the destination server, as shown in the preceding figure. In most cases, the routing loop is caused by an exception in the route configuration of a carrier node. You must contact the carrier to resolve the issue.
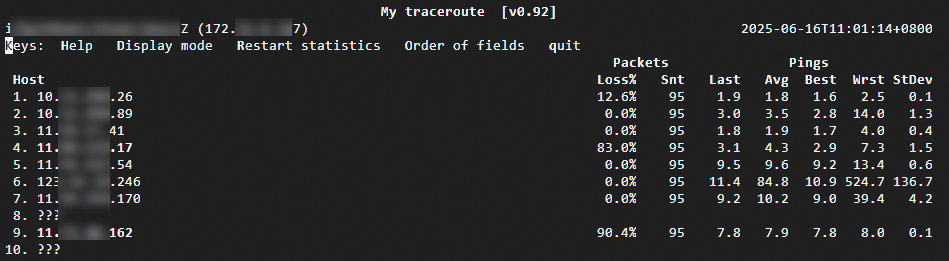
Node interruption
Packets cannot receive feedback after they pass through the fourth hop, as shown in the following figure. The metrics, such as Loss%, Last, Avg, and Best, do not display statistics. In most cases, this issue occurs due to the interruption of the node at the hop. We recommend that you perform a reverse path test to troubleshoot the issue. You must contact the carrier to which the node belongs.