The performance profiling feature allows you to learn in-depth details of cluster resource usage, identify resource imbalance, optimize job scheduling, quick-locate performance bottlenecks, tune performance, and analyze cost efficiency. This provides decision support for resource planning and system optimization. This topic describes how to view the performance profiling of submitted jobs in E-HPC Portal.
Prerequisites
The following items list the prerequisites for viewing performance profiling of the MPI type:
A job is submitted by using the submitter and the MPI Profiling switch is turned on. For more information, see Submit a job by using a submitter.
The job is in the COMPLETED state.
Procedure
Log on to E-HPC Portal.
For more information, see Log on to E-HPC Portal.
In the top navigation bar, click Performance Management.
(Optional) In the Performance Profiling section, configure the following parameters to filter data.
Parameter
Description
Status
You can set Status to Preparing, Running, Completed, or Exception to view data about jobs of the specified status.
Type
You can set Type to MPI.
Click
 on the left to view the performance profiling details.
 MPI
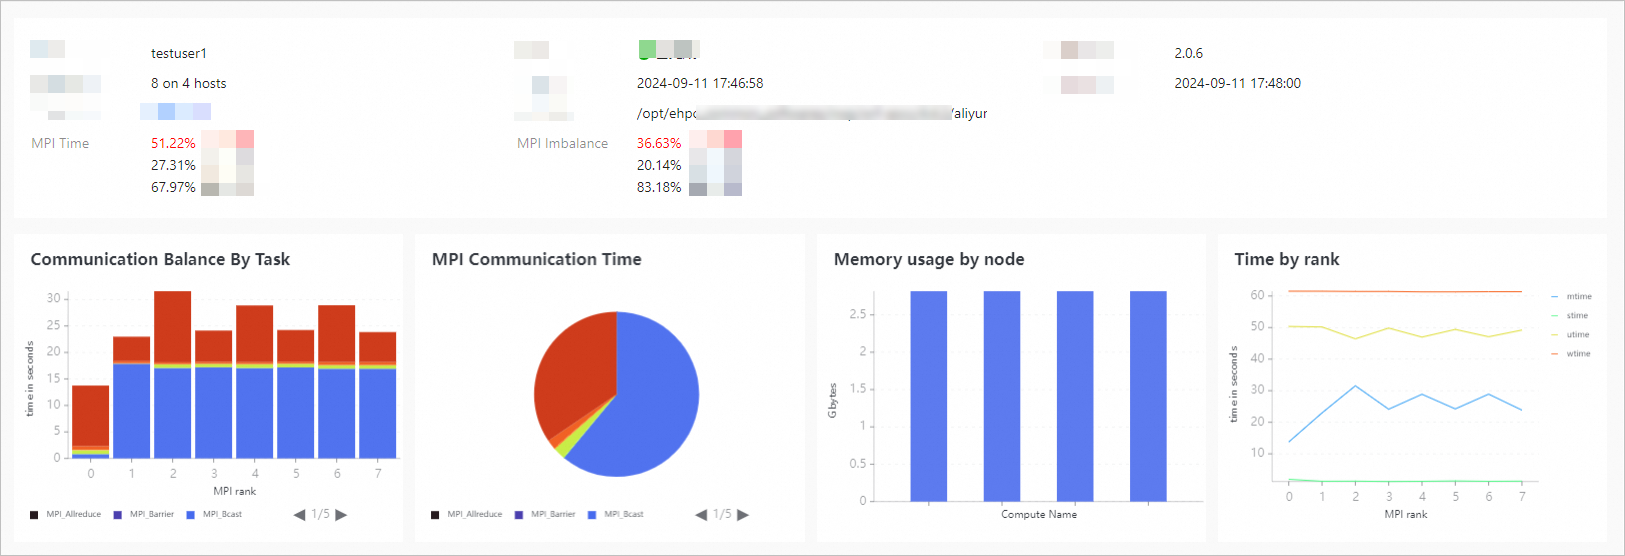
You can view the basic information of the performance profiling task, including the user, status, start time, and command. You can also view advanced statistical parameters. The following table describes the parameters.
Parameter
Description
MPI Time
The ratio of multithreading time (mtime) to user-state time (utime) in percentage in each process. If the percentage exceeds 30%, the application may be MPI communication intensive, which may be caused by MPI communication imbalance, the program communication mode, or the MPI communication library. If the percentage is 30% or lower, a performance bottleneck may exist. In this case, we recommend that you consider I/O or memory access analysis.
MPI Imbalance
The distribution of workloads across multiple parallel processes. If MPI_Wait and the synchronization function together take more than 10% of the time in each rank, the application load is unevenly distributed among MPI ranks. If the proportion is 10% or lower, the load distribution is balanced.
Communication Balance Task
A communication load balance metric that displays a stacked graph of the time values of various MPI functions in each rank.
MPI Communication Time
The total MPI communication time, which is displayed by a pie chart of the total time values of various MPI functions.
Memory usage by node
The memory usage of each node in a multi-node environment in an MPI task.
Time by rank
The time allocation for each rank, including the actual up time (wtime), user-mode time (utime), system-mode time (stime), and MPI time (mtime) of the task.
Example: