The Overview page in the Data Security Center (DSC) console gives you a real-time snapshot of your data security posture. Use it to answer four key questions at a glance:
How many data assets are authorized for scanning?
What sensitive data has been discovered, and at what sensitivity levels?
Are security baseline risks trending up or down?
How many audit alerts have been triggered recently?
Before data appears on the Overview page, activate DSC, authorize it to scan your databases, Object Storage Service (OSS) buckets, and Simple Log Service (SLS) projects, and enable data security audit.
DSC performs only the operations required to protect your data — tagging, static data masking, and auditing. DSC does not store your data files.
Supported data assets
DSC scans the following asset types:
Relational databases
Non-relational databases
Big data platforms
Unstructured data sources
Self-managed databases
For the full list of supported assets, see Supported data asset types.
What the Overview page shows
The table below summarizes each section on the Overview page — what question it answers and where to drill down for details.
| Section | What it tells you | How to drill down |
|---|---|---|
| Version and Quota Statistics (Used/Monthly Quota) | Your current edition, remaining protection days, authorized database count, and storage usage | Upgrade or renew from this section (paid editions only) |
| Asset allocation statistics | How many assets are authorized for scanning and how many have completed data identification | — |
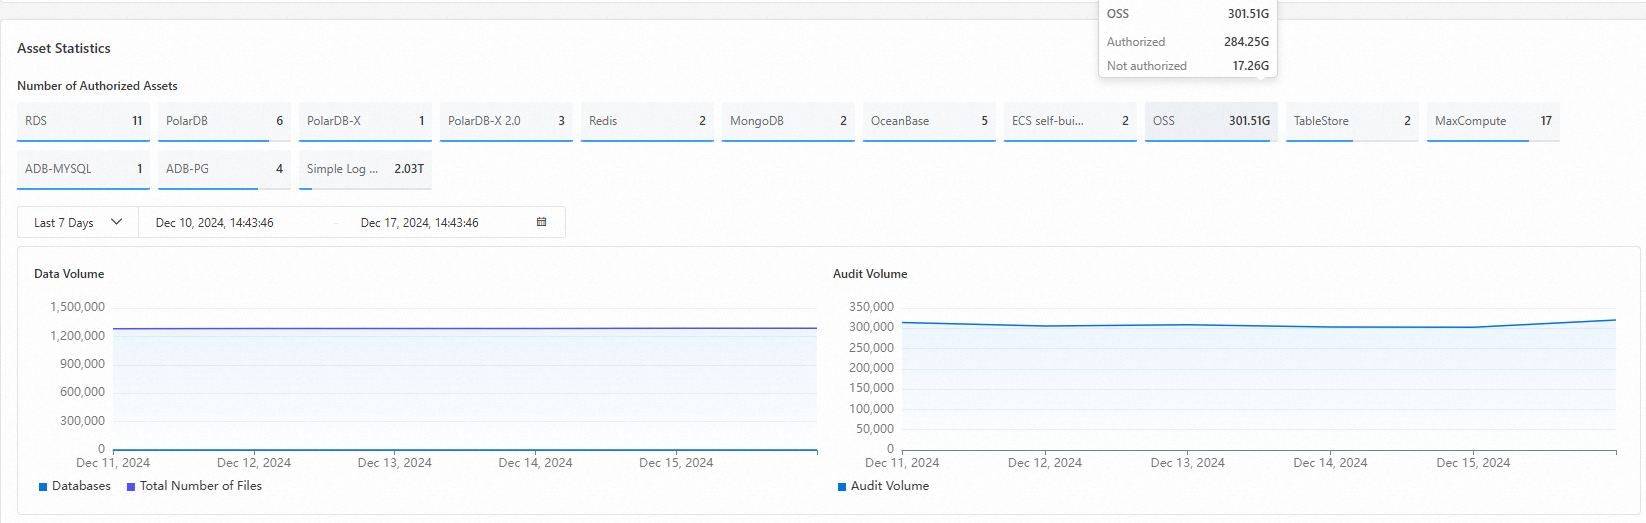
| Asset Statistics | The total number of authorized assets and audit volume trends over the last 12 hours, 1 day, 7 days, or 30 days | — |
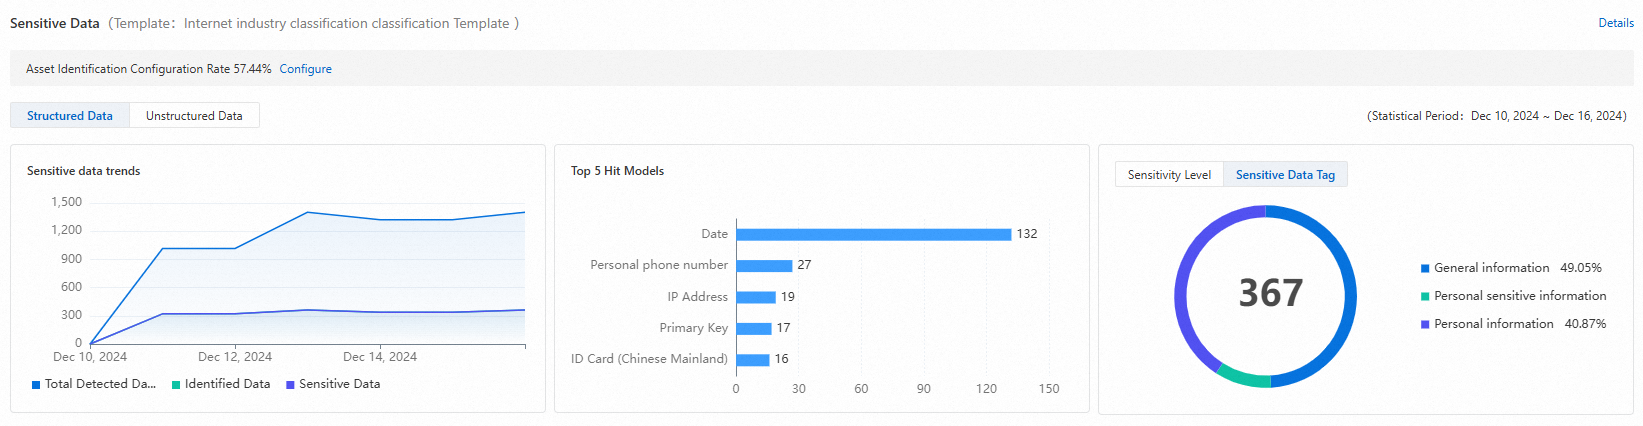
| Sensitive Data | Identification results for structured and unstructured data, classified by sensitivity level | Click Details to go to Classification and Grading > Asset Insight |
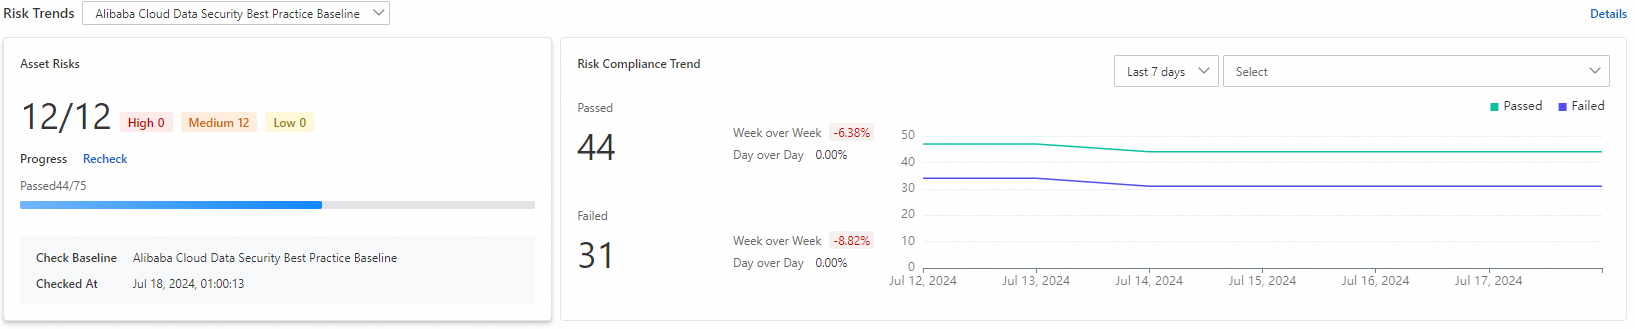
| Risk Trends | Security baseline check results over the last 7 or 30 days — whether configuration risks are increasing or improving | Click Details to go to Risk Governance > Configuration Risks |
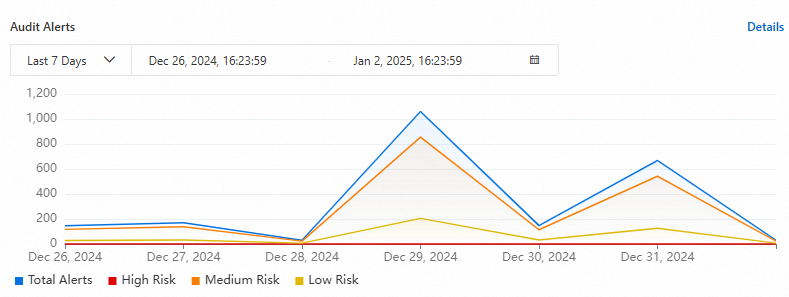
| Threat Trends | Audit alert counts over the last 12 hours, 1 day, 7 days, or 30 days | Click Details for Audit Alerts to go to Data Auditing > Native Data Auditing |
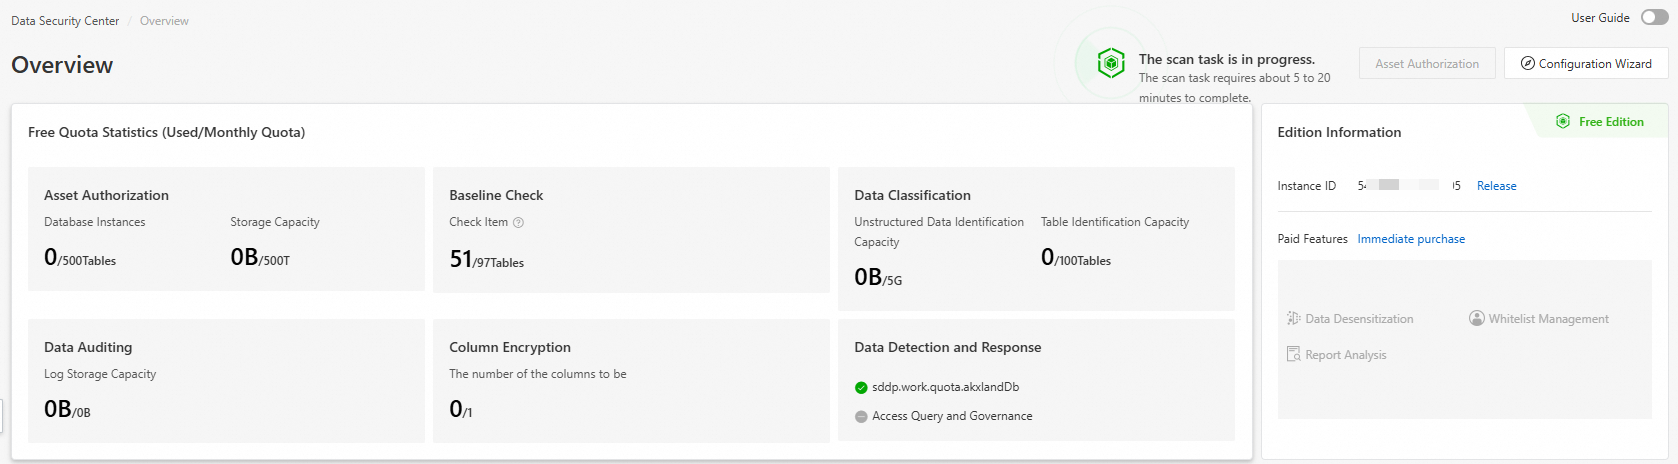
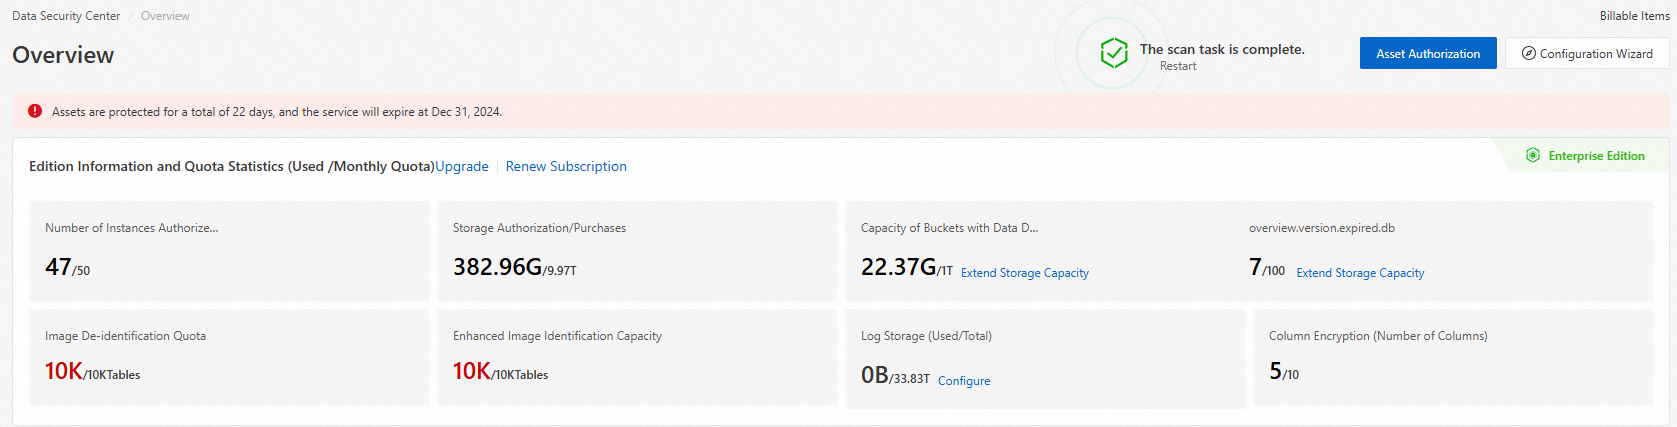
Edition information and quota statistics
The Version and Quota Statistics (Used/Monthly Quota) section shows your current edition and resource usage.
Free Edition
The Free Edition cannot be upgraded or renewed. To maintain continuous data protection, purchase a paid edition if the free resource specifications no longer meet your needs. See Purchase DSC.
Paid editions
To upgrade your instance, click Upgrade. To renew, click Renew Subscription. See Upgrade an instance and Renew subscription DSC.
Asset configuration statistics
The Asset allocation statistics section shows the authorization and data identification status of your data assets.
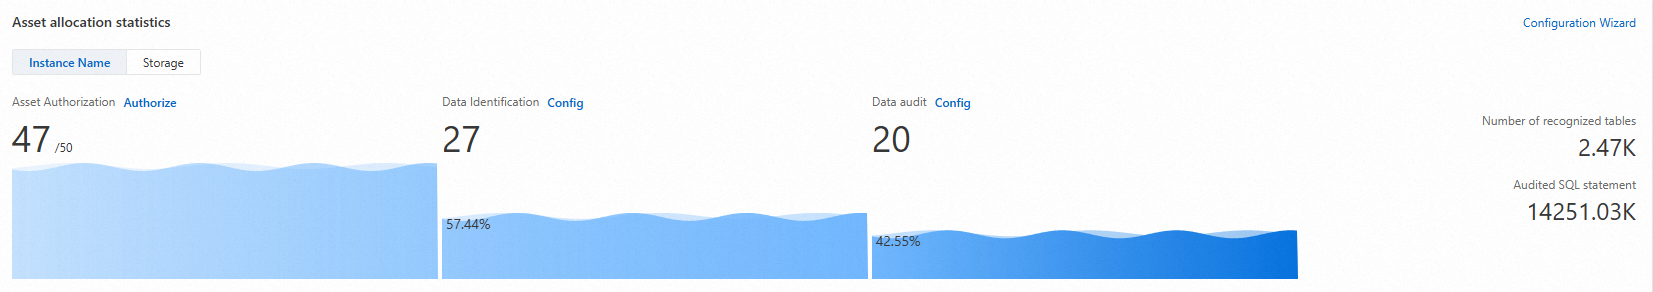
Authorized asset statistics
The Asset Statistics section shows the number of authorized assets and tracks the total asset count and audit volume over time. Select a time range — last 12 hours, 1 day, 7 days, or 30 days — to see how these metrics change.
Sensitive data identification statistics
The Sensitive Data section shows identification results for structured and unstructured data across all scanned assets.
DSC identifies sensitive data using identification templates — either built-in or custom. These templates scan data tables, fields, and files, then classify findings by sensitivity level. For more information, see View and configure identification templates. The Overview page displays statistics from scans that use the New National Standard Template.
Click Details in the upper-right corner of the Sensitive Data section to go to the Classification and Grading > Asset Insight page, where you can review detailed identification results. See View sensitive data identification results.
Risk trend statistics
The Risk Trends section shows whether security baseline check findings are increasing or decreasing over the last 7 or 30 days.
Click Recheck to run a configuration risk check against all authorized assets. Refresh the page after the check completes to see updated results.
Click Details in the upper-right corner to go to the Risk Governance > Configuration Risks page for a full breakdown of security baseline findings.
Threat trend statistics
The Threat Trends section shows the number of data audit alerts over the last 12 hours, 1 day, 7 days, or 30 days — helping you spot unusual activity patterns quickly.
Click Details for Audit Alerts to go to the Data Auditing > Native Data Auditing page and review the corresponding alert details.