This topic describes how to create an alert rule to monitor the usage of File Storage NAS (NAS) file systems. If resource metrics meet specific alert conditions, alerts are triggered and CloudMonitor sends alert notifications. This way, you can identify and handle the exceptions of monitoring data at the earliest opportunity.
Prerequisites
A NAS file system is created. For more information, see Create a file system.
CloudMonitor is activated.
To activate CloudMonitor, go to the product page of CloudMonitor and follow the instructions.
Procedure
Log on to the CloudMonitor console.
In the left-side navigation pane, choose . On the Alert Rules page, click Create Alert Rule.
In the Create Alert Rule panel, configure the parameters.
Configure the basic parameters as described in the following table.
Parameter
Description
Product
Select NAS from the drop-down list.
Resource Range
Select the range of the resources to which the alert rule applies. Valid values:
All Resources: The alert rule is applied to all NAS file systems.
NoteBoth NAS file systems and Cloud Parallel File Storage (CPFS) file systems can be monitored by CloudMonitor. If you select All Resources, both NAS file systems and CPFS file systems are monitored by using the configured alert rule.
Application Groups: The alert rule is applied to all resources in the specified application group of NAS.
Instances: The alert rule is applied to the specified resources of NAS.
Associated Resources
If the resource range is set to Application Groups or Instances, select the associated resources from the drop-down list.
Rule Description
Specify the condition that triggers the alert rule. If a metric meets the specified condition, an alert is triggered. To specify conditions, perform the following steps:
Click Add Rule.
In the Config Rule Description panel, enter a rule name and specify conditions.
Simple Metric: Select a metric and configure the threshold and alert level for the metric.
Combined Metrics: Select an alert level and configure alert conditions for two or more metrics.
Expression: Select an alert level and enter an alert rule expression. For more information about how to configure complex alert conditions, see Alert rule expressions.
Dynamic Threshold: For more information about dynamic thresholds, see Overview and Create dynamic threshold-triggered alert rules.
NoteThe dynamic threshold feature is in invitational preview. To use the feature, you must submit a ticket.
Click OK.
NoteFor more information about the metrics supported by NAS, see Metrics.
Mute Period
The interval at which CloudMonitor resends an alert notification before the alert is cleared. Valid values: 5 Minutes, 15 Minutes, 30 Minutes, 60 Minutes, 3 Hours, 6 Hours, 12 Hours, and 24 Hours.
CloudMonitor sends an alert notification when a metric value reaches the threshold. If the metric value reaches the threshold again within the mute period, CloudMonitor does not resend an alert notification. If the alert is not cleared after the mute period ends, CloudMonitor resends an alert notification.
For example, if the Mute Period parameter is set to 12 Hours and the alert is not cleared 12 hours later, CloudMonitor resends an alert notification.
Effective Period
Specify the period of time during which the alert rule is effective. CloudMonitor monitors the specified resources and generates alerts only within the specified period.
Alert Contact Group
Select the alert contact groups to which alert notifications are sent.
The alert notifications are sent to the alert contacts that belong to the selected alert contact groups. An alert contact group can contain one or more alert contacts.
For more information about how to create an alert contact and an alert contact group, see Create an alert contact or alert contact group.
Tag
Specify tags for the alert rule. A tag consists of a key and a value.
NoteYou can specify a maximum of six tags.
Optional. Click Advanced Settings and configure the parameters. The following table describes the parameters.
Parameter
Description
Alert Callback
The callback URL that can be accessed over the Internet. CloudMonitor sends HTTP POST requests to push alert notifications to the specified URL. Only HTTP requests are supported. For more information about how to configure alert callback, see Use the alert callback feature to send notifications about threshold-triggered alerts.
To test the connectivity of an alert callback URL, perform the following steps:
Click Test next to the callback URL.
In the Webhook Test panel, you can check and troubleshoot the connectivity of the alert callback URL based on the returned status code and test result details.
NoteTo obtain the details of the test result, configure the Test Template Type and Language parameters and click Test.
Click Close.
Auto Scaling
If you turn on Auto Scaling, the specified scaling rule is enabled when an alert is triggered. In this case, you must configure the Region, ESS Group, and ESS Rule parameters.
For more information about how to create a scaling group, see Manage scaling groups.
For more information about how to create a scaling rule, see Manage scaling rules.
Simple Log Service
If you turn on Simple Log Service, the alert information is sent to the specified Logstore when an alert is triggered. In this case, you must configure the Region, ProjectName, and Logstore parameters.
For more information about how to create a project and a Logstore, see Getting Started.
Simple Message Queue (formerly MNS) - Topic
If you turn on Simple Message Queue (formerly MNS) - Topic, the alert information is sent to the specified topic in Simple Message Queue (formerly MNS) (SMQ) when an alert is triggered. In this case, you must configure the Region and topicName parameters.
For more information about how to create a topic, see Create a topic.
Function Compute
If you turn on Function Compute, an alert notification is sent to Function Compute for format processing when an alert is triggered. In this case, you must configure the Region, Service, and Function parameters.
For more information about how to configure services and functions, see Create a function in the Function Compute console.
Method to handle alerts when no monitoring data is found
The method that is used to handle alerts when no monitoring data is found. Valid values:
Do not do anything (default)
Send alert notifications
Treated as normal
Click Confirm to complete the configuration.
If the value of a metric exceeds the specified threshold, alert notifications are automatically sent. This allows you to obtain the information about abnormal monitoring data at the earliest opportunity.
Examples of configuring alert rules
You can refer to the following examples to configure alert rules for NAS file systems, all resources, or application groups. This way, you can identify and handle monitoring data exceptions at the earliest opportunity. For more information about the metrics supported by NAS, see Metrics.
Configure an alert rule based on a simple metric
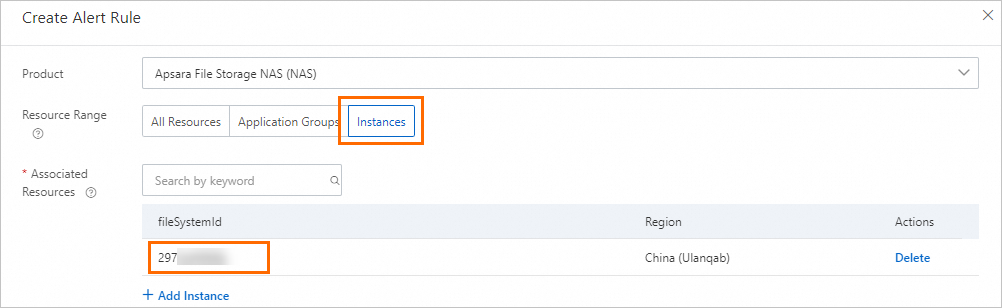
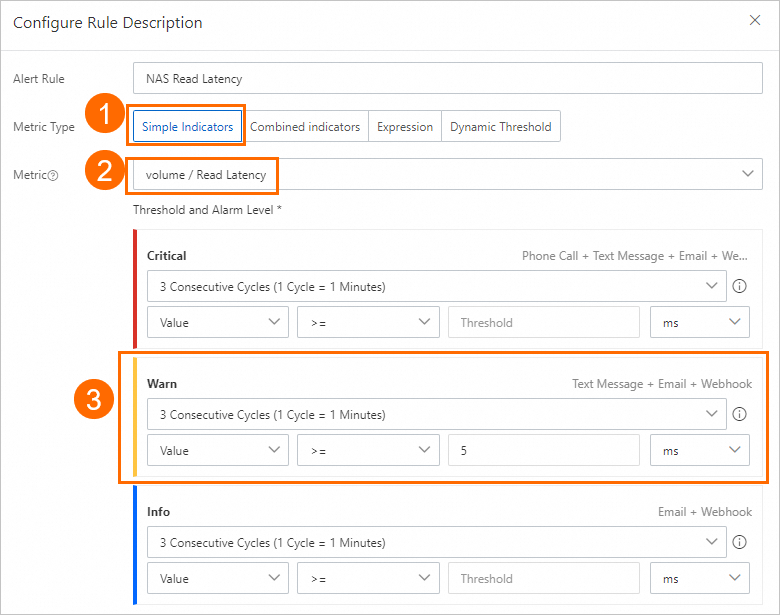
For example, you can configure an alert rule for a General-purpose NAS file system. If the read latency of the file system exceeds 5 milliseconds for three consecutive cycles, a Warn-level alert is triggered. The following figure shows the recommended configurations for the resource range and rule description. For information about other parameters, see Step 3.
Resource Range: Instances.
Associated Resources: Select the ID of a General-purpose NAS file system, for example, 2973ef4xxxx.
Rule Description
Parameter
Example
Metric Type
Simple Metric
Metric
Read latency
Threshold and Alert Level
Alert level: Warn
Cycle: 3 Consecutive Cycles (1 Cycle = 1 Minute)
Operator: >=
Threshold: 5
Configure an alert rule based on combined metrics
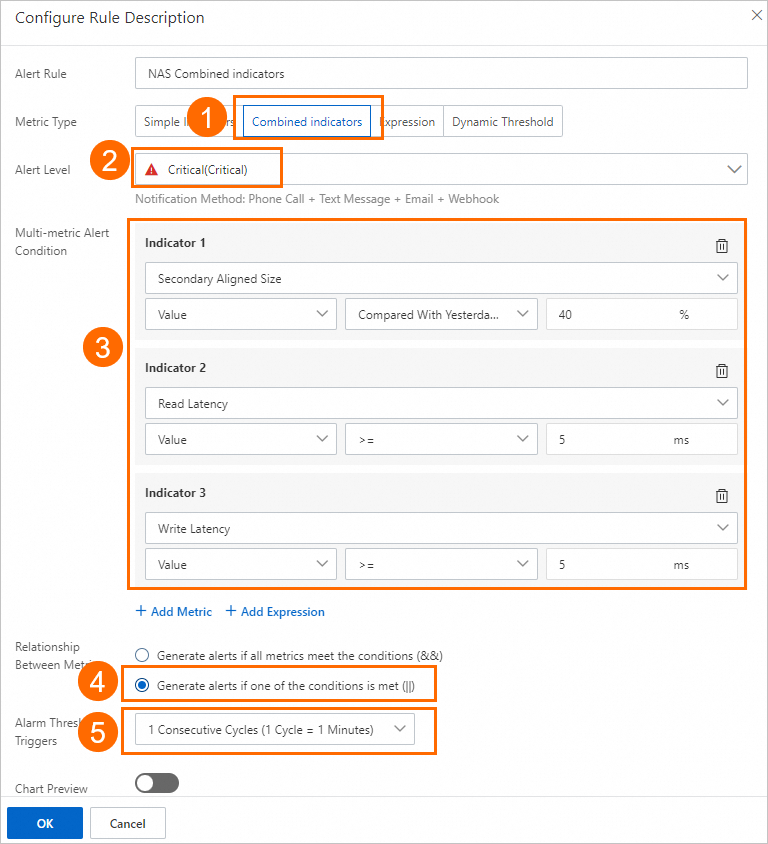
For example, if the read or write latency of a file system exceeds 5 ms within one consecutive cycle, or the storage usage of the IA storage class increases by 40% compared with the storage usage at the same time yesterday, a Critical-level alert is triggered. The following figure shows the recommended configurations for the resource range and rule description.
Resource Range: Instances.
Associated Resources: Select the ID of a General-purpose NAS file system, for example, 2973ef4xxxx.
Rule Description
Parameter
Example
Metric Type
Combined Metrics
Alert Level
Critical
Multi-metric Alert Condition
Click Add Metric. In the Metric drop-down list, choose .
Select an operator. In this example, select Compared With Yesterday Rise.
Set the threshold. In this example, set the threshold to 40.
Click Add Metric and choose and in sequence and configure the related settings.
NoteFor more information about how to configure complex alert conditions, see Alert rule expressions.
Relationship Between Metrics
Generate alerts if one of the conditions is met (||)
Alert Threshold Triggers
1 Consecutive Cycle
References
For more information about how to configure an alert rule that is triggered based on the computing results of multiple metrics, see Configure an advanced alert rule.
For more information about how to create a dynamic threshold-triggered alert rule, see Create dynamic threshold-triggered alert rules.
For more information about how to view the resources for which alerts are triggered, see View resources for which alerts are triggered.
For more information about how to modify an alert rule, see Modify an alert rule.
For more information about how to merge the alert notifications for different alert rules, see Merge alert notifications.