This topic describes the basic concepts of DataWorks modules, including Data Integration, Data Modeling, Data Development, Data Analysis, and Data Service.
This topic describes the terms used in data development across DataWorks modules, including Data Integration, Data Modeling, DataStudio, DataAnalysis, and DataService Studio.
Common terms
Workspace
A workspace is the basic unit for managing tasks, members, roles, and permissions in DataWorks. A workspace administrator can add users and assign them one of the following roles: Workspace Administrator, Develop, O&M, Deploy, Security Administrator, or Visitor. Members with different roles can then collaborate within the workspace.
Create workspaces by department or business unit to isolate resources.
Resource group
A resource group is a DataWorks service that provides computing resources for different DataWorks features. Before you can perform data development operations by using DataWorks, you must have a resource group. The status of a resource group affects the running status of related features, and its quota affects task and service efficiency.
Resource groups in DataWorks are distinct from resource groups in your Alibaba Cloud account—the latter manages account resources and permissions, while DataWorks resource groups run tasks.
Key details:
-
Unless otherwise specified, resource groups in DataWorks refer to serverless resource groups, not old-version resource groups. Serverless resource groups serve general purposes.
-
Serverless resource groups can be used for data synchronization, data scheduling, and DataService Studio.
Basic mode and standard mode
DataWorks provides two workspace modes—basic mode and standard mode—to meet different security control requirements. In standard mode, adding a data source creates two separate data sources for the development and production environments, isolating them from each other.
Computing resource
A computing resource is a resource instance that a compute engine uses to run data processing and analysis tasks. Examples include a MaxCompute project with a configured quota group and a Hologres instance.
You can associate multiple computing resources with a workspace to develop and schedule tasks that use those resources.
Data Integration
Data source
Data sources connect DataWorks to external data storage services. Before you configure a synchronization task, you must define information about the data sources that you want to use in DataWorks. When you configure a synchronization task, you can select the names of data sources to determine the database from which you want to read data and the database to which you want to write data. You can add multiple types of data sources to a workspace.
Data synchronization
The data synchronization feature in Data Integration moves data between storage systems. It supports structured data (such as ApsaraDB RDS and PolarDB-X 1.0), semi-structured data, and unstructured data (such as Object Storage Service (OSS) and text files). Data Integration can synchronize only data that can be abstracted into two-dimensional logical tables—fully unstructured data such as MP3 files in OSS is not supported.
Supported synchronization methods include:
-
Batch synchronization
-
Real-time synchronization
-
Full and incremental data synchronization for a single table or an entire database
Data Integration also supports serverless synchronization tasks, which require no resource group configuration.
Data Modeling
Data modeling
With the rapid development of enterprise business, the amount of business data exponentially grows, the data complexity increases, and various inconsistent data standards appear. This significantly increases the difficulty in data management. Data Modeling helps enterprises structure and manage large volumes of complex, disordered data and extract more business value.
Reverse modeling
Reverse modeling generates data models from existing physical tables, eliminating the need to manually create tables in Dimensional Modeling. This helps reduce the time required to produce models.
Modeling workspace
If your data system spans multiple workspaces and you want to apply a unified data warehouse plan across all of them, use the modeling workspace feature. It shares one suite of data modeling tools across workspaces, enabling unified data warehouse planning, dimensional modeling, and metric definition.
Dimension table
A dimension table stores a dimension and its attributes, extracted from a data domain for analytical purposes. For example, in e-commerce analytics, typical dimensions include order, user, and commodity—each with their own attributes (such as order ID and creation time for the order dimension, or commodity ID and name for the commodity dimension). The attributes of each dimension become the fields in the dimension table.
Fact table
A fact table stores the actual data generated by a business activity. For example, a fact table for order placement might include fields such as order ID, order creation time, commodity ID, number of commodities, and sales amount. ETL operations populate the fact table so that business teams can query it for downstream data analysis.
Aggregate table
An aggregate table stores statistical data for multiple derived metrics that share the same statistical period and dimension within a data domain. Aggregate tables are derived from business abstractions of raw data and serve as the foundation for business queries, online analytical processing (OLAP) analysis, and data distribution.
Application table
An application table organizes statistical data collected by atomic and derived metrics that share the same statistical period, dimension, and statistical granularity. This structure supports efficient business queries, OLAP analysis, and data distribution in specific application scenarios.
Data mart
A data mart is a data organization scoped to a specific business category or scenario. Data marts typically belong to the application layer and depend on aggregate data from common layers.
Data warehouse planning
The data warehouse planning page in the DataWorks console is where data warehouse architects and model group members design the structure of a data warehouse. From this page, you can define data layers, business categories, data domains, business processes, data marts, and subject areas. Model designers then manage models based on these structural objects.
DataWorks supports the following data warehouse layers:
-
Data import layer: Stores basic raw data such as database records, logs, and messages. Raw data is processed through ETL operations before landing here. Only operational data store (ODS) tables can be stored at this layer.
-
Common layer: Processes and aggregates data from the data import layer into reusable fact data and aggregate data. You can create a unified metric dimension and create reusable fact data and aggregate data for data analysis and collection at a common layer. Stores fact tables, dimension tables, and aggregate tables.
-
Application layer: Stores data processed at the common layer, scoped to specific products or application scenarios. Stores application tables and dimension tables.
Data layer
By default, a DataWorks data warehouse is divided into five layers:
-
ODS (operational data store): Receives and stores raw data with the same table structure as the source. Serves as the staging area for the data warehouse.
-
DWD (data warehouse detail): Builds data models based on individual business activities. Creates fact tables at the highest granularity and supports wide tables that reduce joins between fact and dimension tables.
-
DWS (data warehouse summary): Builds data models based on specific analytical subject objects. Creates general aggregate tables for upper-layer applications and products.
-
ADS (application data service): Stores product-specific metric data and generates various reports.
-
DIM (dimension): Builds data models based on dimensions. Stores logical dimension tables and conceptual dimensions, defines primary keys and dimension attributes, and associates different dimensions for dimension tables. This ensures consistency across data analysis and mitigates the risks of inconsistent data calculation specifications and algorithms.
For more information, see Data warehouse layering.
Subject area
A subject area is a collection of business subjects used to categorize data in a data mart from multiple analytical perspectives. For example, e-commerce data can be organized into a transaction subject area, a member subject area, and a commodity subject area.
Data domain
A data domain groups data of the same type. Classification criteria vary based on data usage—for example, e-commerce data might be divided into a transaction data domain, a member data domain, and a commodity data domain. Data domains make it faster to locate relevant data.
Business process
A business process is a business activity that an enterprise performs within a specific data domain, and is the primary logical subject for analysis in Data Modeling. For example, a transaction data domain might contain business processes such as adding items to a cart, placing orders, and processing payments.
Composite metric
A composite metric is calculated from specific derived metrics and custom calculation rules. Derived metrics collect statistics within a defined time window but cannot compute relative measures such as week-on-week growth rates. Composite metrics fill this gap, enabling fine-grained statistical analysis such as growth rates and value differences.
Data metric
Data Modeling's metric system provides a unified framework for defining and managing metrics. It consists of four components:
-
Atomic metric: A single measurement tied to a business process. For example, Payment Amount for the Order Placing process.
-
Modifier: A filter that narrows the statistical scope. For example, Maternity and Infant Products limits the Payment Amount metric to a specific product category.
-
Period: A time range or point in time for data collection. For example, Last Seven Days.
-
Derived metric: A combination of an atomic metric, a period, and one or more modifiers. For example, Payment Amount of Maternity and Infant Products in Last Seven Days.
Lookup table
A lookup table defines the valid value range for fields governed by a field standard. For example, a lookup table for a gender field standard might contain the values "male" and "female."
Field standard
A field standard centrally manages fields that share the same meaning but appear under different names across tables. It also defines the value range and measurement unit for those fields. When a field standard changes, DataWorks can quickly identify all affected tables, improving data consistency and accuracy.
DataStudio
Node
DataStudio lets you create nodes of different types to handle different stages of data processing:
-
Data synchronization nodes: Move data between sources and destinations.
-
Compute engine nodes: Execute data transformation logic. Examples include ODPS SQL nodes, Hologres SQL nodes, and EMR Hive nodes.
-
General nodes: Coordinate or extend compute engine logic. Examples include zero load nodes (for managing groups of nodes) and do-while nodes (for looping over node code).
Combine node types to meet your specific data processing requirements.
Auto triggered workflow
An auto triggered workflow is a development mode that provides a visual directed acyclic graph (DAG) interface from a business perspective. Drag and drop different node types onto the canvas to configure dependencies between tasks visually. This facilitates data processing, improves task development efficiency, and simplifies complex project management.
Notebook
The Notebook feature provides an interactive environment that integrates SQL code, Python code, text, execution results, and data visualization charts in a single interface. Use Notebook for data exploration, data analysis, and AI model development.
SQL script template
An SQL script template is a reusable logic block abstracted from an SQL script. SQL script templates apply only to MaxCompute tasks.
Each template involves one or more source tables. You can filter, join, and aggregate those tables to produce a result table. Templates accept input and output parameters, making them adaptable to different business scenarios.
Scheduling dependency
A scheduling dependency defines the execution order between tasks. If Node B can run only after Node A completes, Node A is the ancestor of Node B. In a DAG, arrows represent these dependencies.
Data timestamp
A data timestamp is a date that is directly relevant to a business activity—it reflects the actual time when business data is generated. This concept is crucial in offline computing scenarios.
For example, if a retail task calculates turnover for October 10, 2024, the task runs in the early morning of October 11, 2024. The task's data timestamp is 20241010, not the actual run date.
Output name
An output name identifies the output produced by a task. Use the output name—not the task name or ID—when configuring dependencies between tasks within an Alibaba Cloud account. The output name of an upstream task becomes the input name for its downstream tasks.
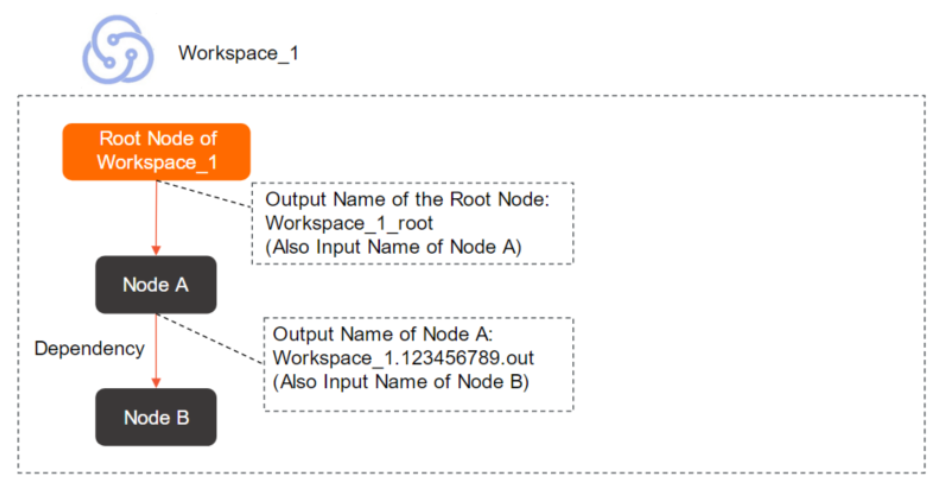
An output name must be globally unique within your Alibaba Cloud account. The default format is Workspace name.Randomly generated nine-digit number.out. You can specify a custom output name, but it must remain unique within your Alibaba Cloud account.
Output table name
An output table name is an identifier used to help verify that data in a descendant task comes from the expected ancestor table when configuring dependencies. Use the name of the table that the task generates as the output table name, and avoid modifying auto-parsed output table names.
An output name must be globally unique. An output table name has no such requirement—it is an identifier only. Modifying an output table name does not affect the name of the table that SQL statements actually generate.
Scheduling parameter
A scheduling parameter is a variable in task code whose value is replaced dynamically at runtime. Use scheduling parameters when your code needs context-specific information—such as the current date—each time the task runs.
Data catalog
A data catalog is a structured map of all data assets in your organization, including databases, tables, and files. It records the metadata of those assets in DataWorks.
Relationships among computing resources, data sources, and data catalogs
Computing resources, data sources, and data catalogs are independent but related objects. Their relationships are:
-
Associating a computing resource with a workspace automatically generates a data source and a data catalog.
-
Adding a data source to a workspace automatically generates a data catalog.
-
Creating a data catalog does not generate a data source or computing resource.
Operation Center
Scheduling time
The scheduling time is the point in time at which an auto triggered task is expected to run, accurate to the minute.
Reaching the scheduling time does not guarantee that a task starts immediately. Before a task runs, DataWorks verifies three conditions: the ancestor task completed as expected, the scheduling time has arrived, and sufficient resources are available. The task runs only when all three conditions are met.
Data timestamp
A data timestamp is a date that is directly relevant to a business activity—it reflects the actual time when business data is generated.
For example, in retail, if you calculate turnover for October 10, 2024, the calculation runs in the early morning of October 11, 2024. The data timestamp is 20241010.
Auto triggered task
An auto triggered task is triggered by the scheduling system based on the task's configured scheduling properties. From Operation Center, you can perform O&M and management operations on auto triggered tasks, including viewing the DAG, running tests, backfilling data, and changing the task owner.
Auto triggered instance
An auto triggered instance is automatically generated from an auto triggered task's scheduling properties each time the task is due to run. For example, a task configured to run once per hour generates 24 instances per day, with one instance triggered every hour. Only instances carry runtime state such as running status. From Operation Center, you can stop, rerun, or manually mark an instance as successful.
Data backfill
The data backfill operation generates backfill instances for a specified task based on a selected time range. Use data backfill for historical data write-back and data rectification—for example, to recompute data for a past period or to correct previously generated data.
Baseline
A baseline defines the quality-of-service expectations for a set of tasks. After you associate tasks with a baseline, DataWorks monitors them against three properties: priority, committed completion time, and alert margin threshold.
-
Priority: A higher number means higher priority. DataWorks preferentially allocates resources to higher-priority baselines.
-
Committed completion time: The deadline by which tasks in the baseline must produce output.
-
Alert margin threshold: A time buffer subtracted from the committed completion time to calculate the alert time. If DataWorks detects that a task in the baseline cannot generate data before the alert time, it sends an alert to the configured contact.
Data Governance Center
Health score
A health score is a composite metric that reflects the governance effectiveness of a tenant, workspace, or user. Scores range from 0 to 100—a higher score indicates healthier data assets.
DataWorks calculates health scores using its health assessment model, which evaluates governance items across five dimensions: storage, computing, R&D, quality, and security. Each dimension has specific metrics, giving you a clear view of where governance attention is needed.
Governance item
A governance item is a rule that DataWorks uses to detect issues in data assets during governance, such as R&D specification violations, data quality problems, security compliance gaps, and resource utilization inefficiencies.
Governance items are either mandatory or optional:
-
Mandatory: Enabled globally by default and cannot be disabled.
-
Optional: Enable based on your requirements. Examples include detecting tasks that time out, nodes that fail repeatedly, or leaf nodes that are never accessed.
Check item
A check item is an active governance mechanism that validates task code before it is committed and deployed. If a check item detects a violation—such as a full table scan or a missing scheduling dependency—DataWorks generates a check event and blocks the content from being deployed.
Check items complement governance items: governance items detect issues in existing data assets, while check items prevent non-compliant code from entering production.
Data governance plan
Data Asset Governance provides data governance plan templates for different scenarios, with a focus on achieving predetermined governance objectives within specific periods. Use data governance plan templates to quickly identify the most relevant governance items and check items, locate optimization candidates, and track progress toward governance goals through quantitative assessments.
Knowledge base
The knowledge base contains definitions, root cause explanations, and remediation guidance for all built-in check items and governance items in Data Governance Center. Use it to quickly understand issues and take action.
Security Center
Data permission
Security Center supports fine-grained permission requesting, request processing, and permission auditing based on the principle of least privilege. It also lets you track and follow up on permission requests in real time. For more information, see Data access control.
Data security
Security Center provides tools for identifying and managing data risks throughout your workflows, including data classification by category and sensitivity level, sensitive data identification, data access auditing, and data source tracking. For more information, see Overview.
Data Quality
Data quality monitoring
Data quality monitoring continuously tracks the status of data objects—such as specific partitions in a partitioned table—to verify they meet predefined quality standards. Trigger monitoring via scheduling events for automated quality checks, and configure alert notifications to be sent to specified recipients when issues are detected.
Monitoring rule
A monitoring rule is a condition or logical criterion that determines whether data meets quality expectations. For example, "The age of customers cannot be less than 0" is a monitoring rule. Configure monitoring rules for a specific range of data, and DataWorks will alert you when data violates them.
Rule template
A rule template is a reusable quality rule with predefined verification logic. Use a rule template directly or adjust its thresholds to create monitoring rules for your data.
DataWorks provides two types:
-
Built-in rule templates: Ready-to-use templates provided by DataWorks. For more information, see Built-in rule templates.
-
Custom rule templates: Create your own templates using custom SQL statements, especially for monitoring data specified by partition filter expressions. Save frequently used custom rules as templates for reuse. For more information, see Custom rule templates.
Data Security Guard
Data category and data sensitivity level
Data category and data sensitivity level allow you to classify data based on its value, content sensitivity, potential impact, and distribution scope. Data management requirements and development controls vary by sensitivity level.
Sensitive data identification rule
A sensitive data identification rule defines data categories and configures sensitive field types based on the source and usage of data. This helps identify sensitive data in the current workspace. DataWorks provides built-in identification rules, and you can create custom rules based on your requirements.
Data masking rule
A data masking rule specifies how identified sensitive data is masked. Masking behavior varies based on data sensitivity level to meet business control requirements.
Risk identification rule
A risk identification rule enables Data Security Guard to proactively detect risky operations on data using intelligent analysis. When a risk is identified, the system reports an alert to help you perform comprehensive risk management.
Data Map
Metadata
Metadata describes the properties and structure of data assets. It includes:
-
Data attributes: Name, size, and data type
-
Data structures: Field name, type, and length
-
Other information: Location, owner, output task, and access permissions
Data lineage
Data lineage maps the journey of data from creation through processing, synchronization, and consumption, showing all the data objects involved at each stage. DataWorks displays data lineage visually, making it straightforward to trace the source of issues and assess the impact of changes to a table or field.
Data album
A data album organizes and manages tables by business category. Add specific tables to a data album to make them easier to search and locate.
DataAnalysis
SQL query
DataAnalysis supports standard SQL statements to query and analyze data across different data source types. For more information, see SQL query.
Workbook
Workbooks are online tools for editing and managing data. Import SQL query results or local files into a workbook for further analysis and visualization. Export, download, or share workbook data with other users as needed. For more information, see Create and manage a workbook.
Data insight
Data insight supports data exploration and visualization using artificial intelligence (AI) technologies. Use it to understand data distribution, create data cards, and combine those cards into a data report. Reports can be shared as long images. AI-powered analysis helps interpret complex data for business decision-making.
DataService Studio
API
An API (Application Programming Interface) in DataService Studio is a data access endpoint that developers quickly encapsulate based on various types of data sources. Once created, APIs can be called from business applications, software, systems, and reporting scenarios to facilitate data retrieval and consumption.
Function
A function acts as a filter for an API—either on the way in or the way out:
-
Pre-filter: Processes incoming request parameters before the API executes. For example, modify a parameter value or assign a default value.
-
Post-filter: Processes the API's return results. For example, restructure the response data or append additional content.
Data push
The data push feature lets you create tasks that periodically push data to destination webhook URLs. Write SQL statements for single- or multi-table queries to define the data to push, and format the output as rich text or a table. Configure scheduling properties to control push frequency.
Open Platform
OpenAPI
The OpenAPI module lets you call DataWorks API operations to use DataWorks features programmatically and integrate your applications with DataWorks.
OpenEvent
The OpenEvent module lets you subscribe to event notifications for changes in DataWorks. For example, subscribe to table change events to receive real-time alerts about changes to core tables, or subscribe to task change events to build custom monitoring dashboards for real-time synchronization task status.
Extensions
The Extensions module is a plug-in system that works with OpenAPI and OpenEvent to process and intercept user operations in DataWorks based on custom logic. For example, build an extension to implement custom task deployment controls.