Resource analysis
Data Asset Governance enables you to view and analyze resource consumption in your workspaces by type, such as computing and storage. This analysis helps you use resources more efficiently.
Permissions
To view resource usage for any workspace, you need one of the following permissions:
An Alibaba Cloud account
A RAM user with the
AliyunDataWorksfullAccesspolicy attachedA tenant administrator
A tenant-level data governance administrator
Other users can only select the workspaces that they have joined.
Usage notes
In pay-as-you-go scenarios, the cost information on this page is only an estimate and may differ slightly from the actual charges. Your final bill is the authoritative source for all charges.
Go to the Resource page
Go to the Data Asset Governance page.
Log on to the DataWorks console. In the top navigation bar, select the desired region. In the left-side navigation pane, choose . On the page that appears, click Go to Data Asset Governance.
In the navigation pane on the left, click .
View storage resource details
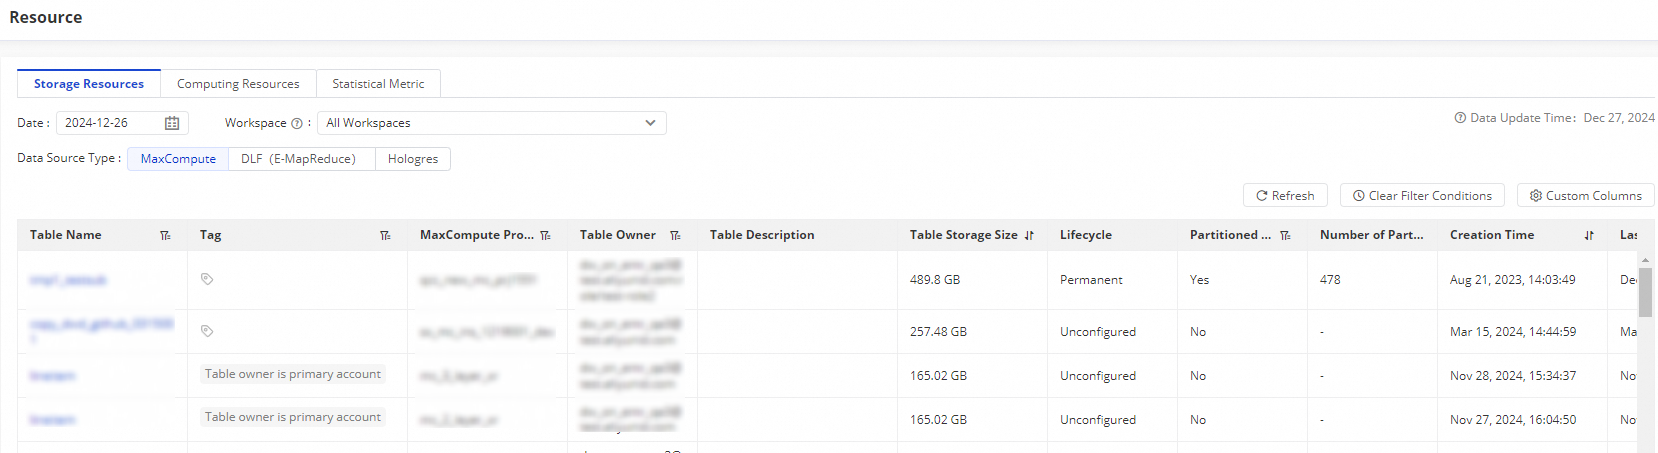
The Storage Resources tab shows the storage resource consumption details for a specified Generated At and Workspace. The details include information such as Table Storage Size, Lifecycle, Number of Partitions, and Table Owner.
Use this analysis and your business requirements to optimize related workloads.
View computing resource details
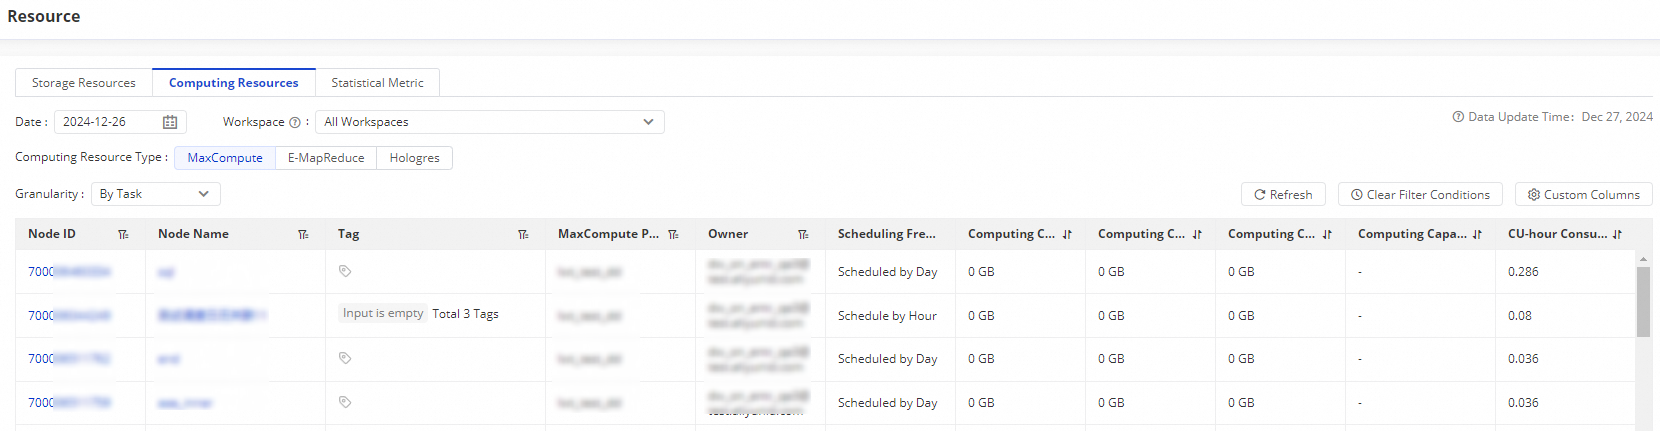
The Computing Resources tab shows the computing resource consumption details for a specified date and workspace.
Click Custom Columns to customize the columns displayed in the list.
View the resource details By Task or By Job.
You can also click the
 icon next to a key metric column to sort the results.
View statistical metrics
The Statistical Metrics tab shows metrics for three resource types: MaxCompute, E-MapReduce, and Hologres, in a specified workspace. These metrics include table quantity, table storage trends and distribution, resource usage trends, and job quantity trends. Based on the distribution of table quantity and storage, you can adjust resource allocation for more efficient use.
Table Quantity Trend: Shows how the number of development tables, production tables, or all tables changes over a specified period in the selected workspace.
Table Storage Distribution: Shows the storage usage of tables in the selected workspace on a specified date.
Table Storage Trend: Shows how storage consumed by development tables, production tables, or all tables changes over a specified period in the selected workspace.
Table Quantity Distribution: Shows the distribution of table counts in the selected workspace on a specified date.
Resource Usage Trends: Shows the resource usage trend in the selected workspace on a specified date. You can filter by MaxCompute Project and Quota Group.
In subscription scenarios, you can view CU consumption, Consumed CPUs, and Consumed Memory.
In pay-as-you-go scenarios, you can view the trend of Computing Capacity. Data is available for up to 7 days.
Job Quantity Trend: Shows the job count trend in the selected workspace on a specified date. You can filter by MaxCompute Project to view trends for different task types. Data is available for up to 7 days.