Development
Data Asset Governance provides the Development feature to view and analyze the run status and resource consumption of DataWorks batch synchronization tasks and scheduling tasks within a workspace. This helps you identify high-cost resource categories, spot failed tasks, optimize your cost structure, and resolve task execution issues.
Permissions
To view resource usage for any workspace, you need one of the following permissions:
An Alibaba Cloud account
A RAM user with the
AliyunDataWorksfullAccesspolicy attachedA tenant administrator
A tenant-level data governance administrator
Other users can only select the workspaces that they have joined.
Go to Development
Go to the Data Asset Governance page.
Log on to the DataWorks console. In the top navigation bar, select the desired region. In the left-side navigation pane, choose . On the page that appears, click Go to Data Asset Governance.
-
In the left-side navigation pane, choose .
Data synchronization: DataWorks batch synchronization consumption
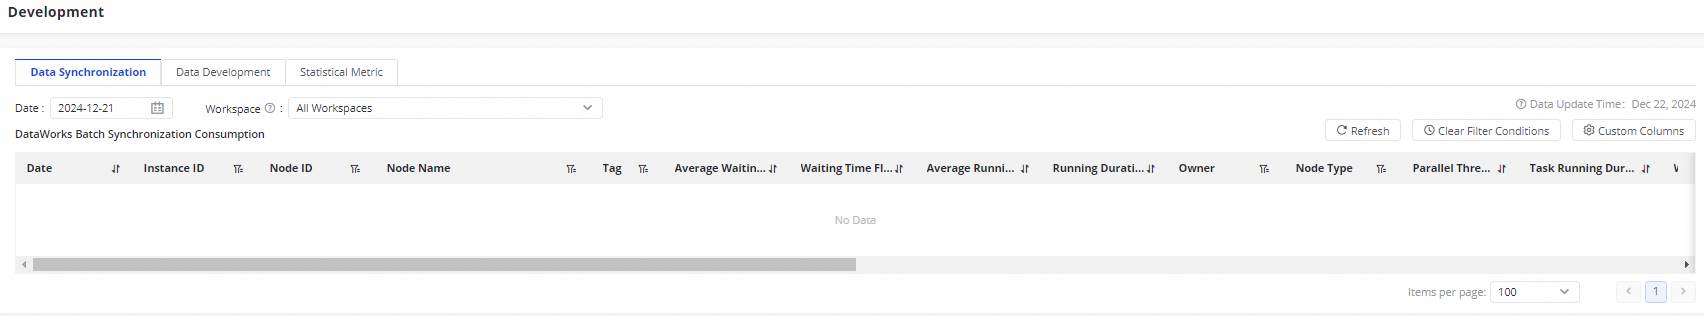
On the Data Synchronization tab, view the resource consumption details for DataWorks batch synchronization tasks in the selected workspace and date range. This view includes multiple metrics, such as tag , Average Waiting Time in 7 Days, Average Running Duration in 7 Days, Waiting Time Fluctuation Rate, Running Duration Fluctuation Rate, Owner, Task Running Duration, and Synchronize data volume.
The tags displayed here are from an offline snapshot and cannot be edited in this view. If you modify or add tags on the tag management page, the changes take effect on the following day (T+1).
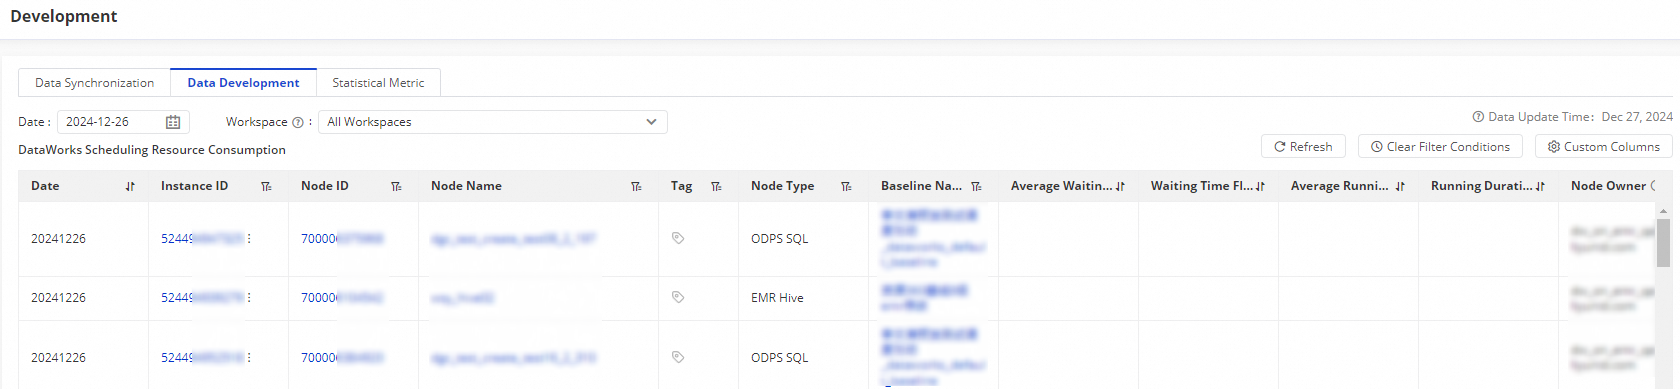
Data development: DataWorks scheduling consumption
On the Data Development tab, view the resource consumption details for DataWorks scheduling tasks in the selected workspace and date range. This view includes multiple metrics, such as Label, Average Waiting Time in 7 Days, Average Running Duration in 7 Days, Waiting Time Fluctuation Rate, Running Duration Fluctuation Rate, Node Owner, Task Running Duration, Operating Environment (development, production), and Task type (auto-triggered task, data backfill task, etc.).
The tags displayed here are from an offline snapshot and cannot be edited in this view. If you modify or add tags on the tag management page, the changes take effect on the following day (T+1).
DataWorks consumption data and task status
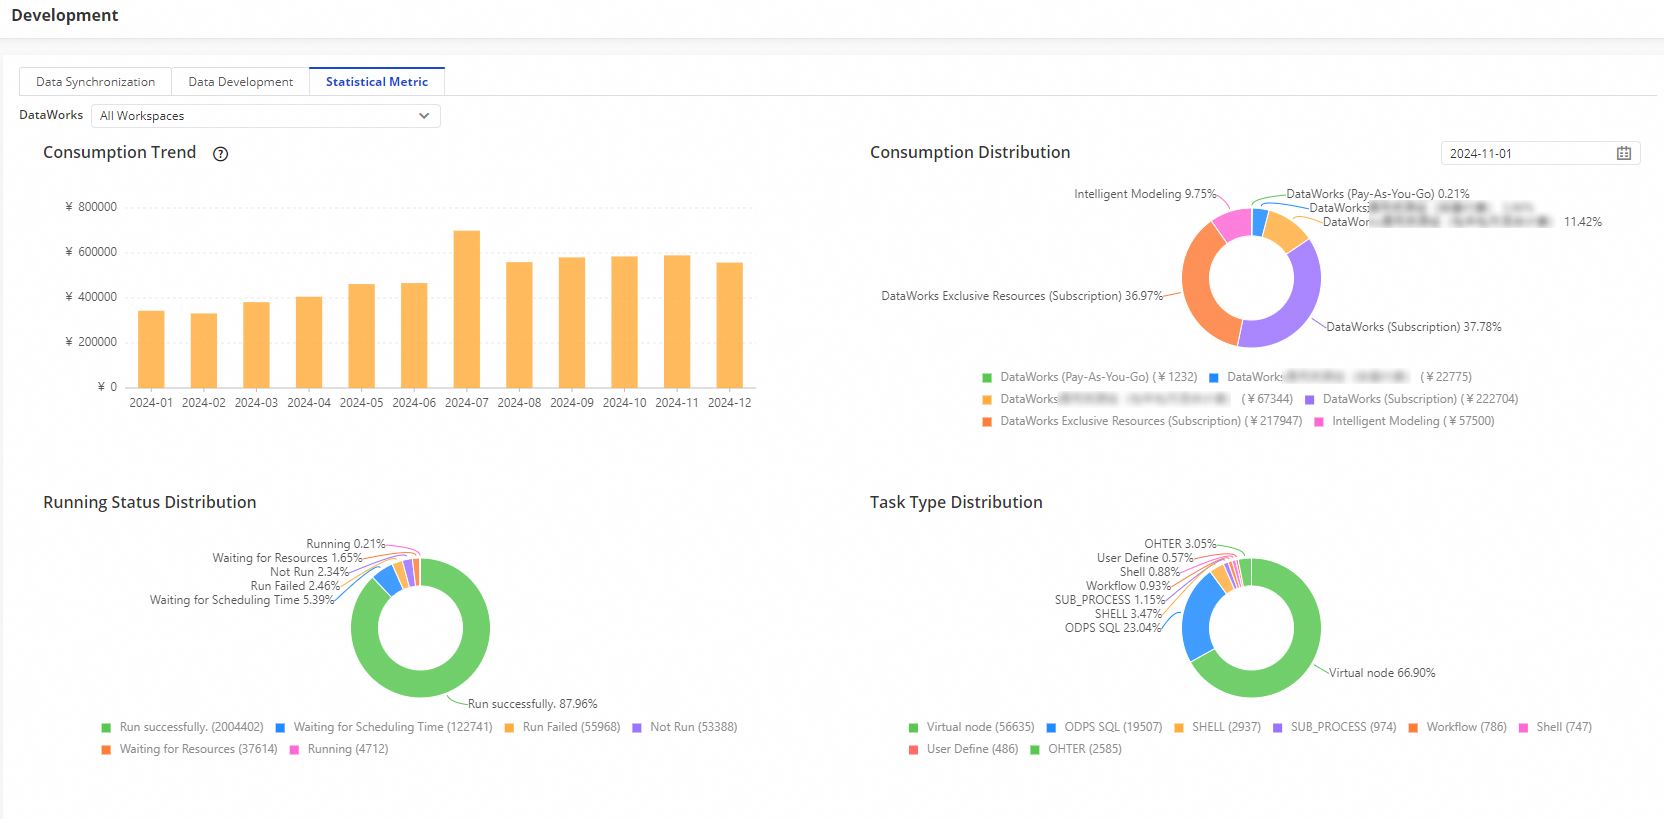
On the Statistical Metrics tab, view overall consumption trends and distribution, trends in task and instance counts and their run statuses, and the task running concurrency trend for a specified workspace.
-
Consumption Trend: The overall DataWorks consumption trend in the selected workspace.
-
Consumption Distribution: The consumption breakdown by DataWorks edition types in the selected workspace.
-
Operating state distribution: The distribution of task statuses in the selected workspace. This helps you understand the proportion of failed tasks to promptly investigate and resolve issues.
-
Node Types: The distribution of task types in the selected workspace.
-
Task Quantity Trend: Data can be categorized by the type of resource group used for task scheduling. Trends are available for the last 7 days.
-
Instance Quantity Trend: Data can be categorized by the type of resource group used for task scheduling. Trends are available for the last 7 days.
-
Parallelism Trend of Task: You can view the total concurrency for scheduling tasks and batch synchronization tasks, as well as the concurrency trends for different types of resource groups. The time range is limited to a single day, selectable from the last seven days.