All Products
Search
Document Center

DataWorks:Data quality monitoring node

Last Updated:Nov 27, 2025

DataWorks provides data quality monitoring nodes. You can configure monitoring rules on these nodes to check the data quality of tables in a data source, such as detecting dirty data. You can also define a custom scheduling policy to run monitoring tasks periodically. This topic describes how to use a data quality monitoring node.

Background information

The Data Quality feature in DataWorks helps you detect changes in source data and track dirty data generated during the extract, transform, and load (ETL) process. It automatically blocks tasks that have issues to prevent dirty data from spreading to downstream nodes. This prevents tasks from producing unexpected data that can affect normal operations and business decisions. It also significantly reduces the time spent on troubleshooting and avoids wasting resources on rerunning tasks. For more information, see Data Quality.

Limits

  • Supported data source types: MaxCompute, E-MapReduce, Hologres, CDH Hive, AnalyticDB for PostgreSQL, AnalyticDB for MySQL, and StarRocks.

  • Supported table scope:

    • You can monitor only tables in a data source that is bound to the same workspace as the data quality monitoring node.

    • Each node can monitor only one table, but you can configure multiple monitoring rules for the node. The monitoring scope varies based on the table type:

      • Non-partitioned tables: The entire table is monitored by default.

      • Partitioned tables: Specify a partition filter expression to monitor a specific partition.

      Note

      To monitor multiple tables, you must create multiple data quality monitoring nodes.

  • Limits on supported operations:

    • Data quality monitoring rules created in DataStudio can be run, modified, published, and managed only in DataStudio. You can view these rules in the Data Quality module, but you cannot trigger scheduled runs or manage them there.

    • If you modify the monitoring rules in a data quality monitoring node and then publish the node, the original monitoring rules are replaced.

Prerequisites

  • A business flow is created.

    In Data Development (DataStudio), development operations for different data sources are performed based on business flows. Therefore, you must create a business flow before you create a node. For more information, see Create a business flow.

  • A data source is created and bound to the current workspace, and the table to be monitored has been created in the data source.

    Before you run a data quality monitoring task, you must create the table that the monitoring node will monitor in the data source. For more information, see Data Source Management, Resource Management, and Node development.

  • A resource group is created.

    Data quality monitoring nodes can run only on Serverless resource groups. For more information, see Resource Management.

  • (Optional, for RAM users) The Resource Access Management (RAM) user for task development has been added to the workspace and granted the Development or Workspace Manager role. The Workspace Administrator role has extensive permissions and must be granted with caution. For more information about adding members and granting permissions, see Add workspace members.

Step 1: Create a data quality monitoring node

  1. Go to the DataStudio page.

    Log on to the DataWorks console. In the top navigation bar, select the desired region. In the left-side navigation pane, choose Data Development and O&M > Data Development. On the page that appears, select the desired workspace from the drop-down list and click Go to Data Development.

  2. Right-click the target business flow and choose Create Node > Data Quality > Data Quality Monitoring.

  3. In the Create Node dialog box, enter a name for the node and click Confirm. After the node is created, you can develop and configure the task on the node's configuration page.

Step 2: Configure data quality monitoring rules

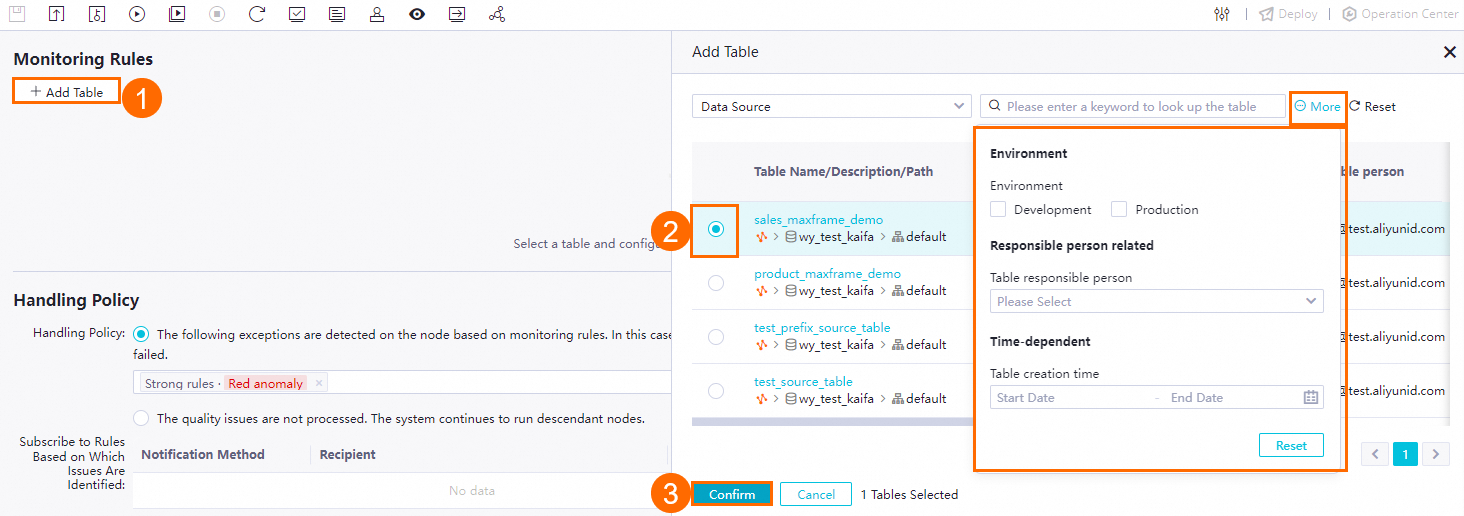
1. Select the table to monitor

Click Add Table. In the Add Table dialog box, search for and select the target table to monitor.image

2. Configure the data range for monitoring

  • Non-partitioned tables: The entire table is monitored by default. You can skip this step.

  • Partitioned tables: Select the partition to monitor. You can use scheduling parameters. Click Preview to verify that the calculation result of the partition filter expression is correct.image

3. Configure data quality monitoring rules

You can create new rules or import existing ones.
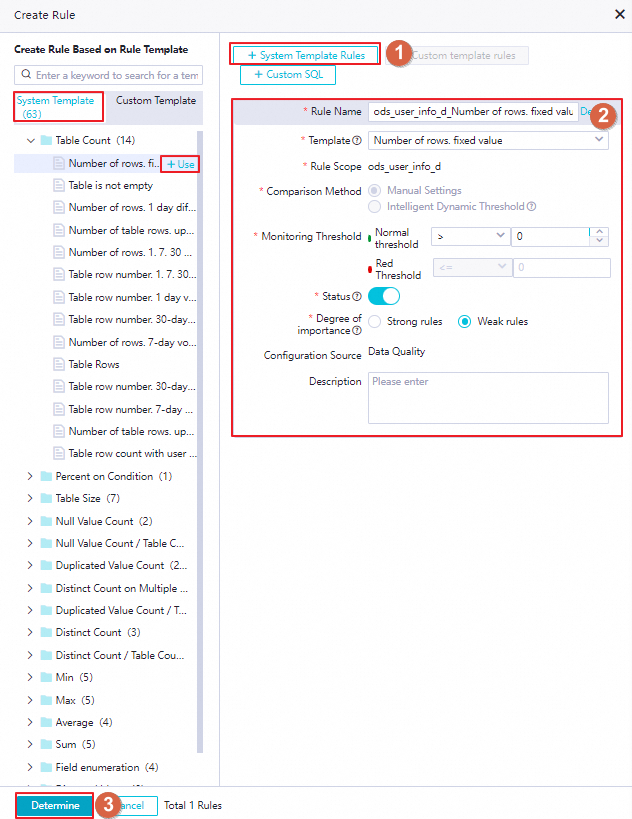
 Configured rules are enabled by default.

  • Create a rule

    Click Create Rule to create a data quality monitoring rule from a template or using a custom SQL statement. The following sections describe these methods.

    Method 1: From a system template

    The platform provides various built-in monitoring rules. You can use these rule templates to quickly create a data quality monitoring rule. The following figure shows the procedure.

    Note

    You can also find the required rule template in the system template list on the left and click +Use to create a rule.

    image

    Parameters for configuring a rule based on a built-in rule template

    Parameter

    Description

    Rule Name

    The name of the monitoring rule.

    Template

    Define the type of rule validation that needs to be performed on the table.

    Data Quality provides many built-in table-level and field-level rule templates that are ready for use. For more information, see View built-in rule templates.

    Note

    You can configure field-level monitoring rules of the following types only for numeric fields: average value, sum of values, minimum value, and maximum value.

    Rule Scope

    The application scope of the rule. For a table-level monitoring rule, the application scope is the current table by default. For a field-level monitoring rule, the application scope is a specific field.

    Comparison Method

    The comparison method that is used by the rule to check whether the table data is as expected.

    • Manual Settings: You can configure the comparison method to compare the data output result with the expected result based on your business requirements.

      You can select different comparison methods for different rule templates. You can view the comparison methods that are supported by a rule template in the DataWorks console.

      • For numeric results, you can compare a numeric result with a fixed value, which is the expected value. The following comparison methods are supported: Greater Than, Greater Than Or Equal To, Equal To, Not Equal To, Less Than, and Less Than Or Equal To. You can configure the normal data range (normal threshold) and abnormal data range (red threshold) based on your business requirements.

      • For fluctuation results, you can compare a fluctuation result with a fluctuation range. The following comparison methods are supported: Absolute Value, Raise, and Drop. You can configure the normal data range (normal threshold) based on your business requirements. You can also define data output exceptions (orange threshold) and unexpected data outputs (red threshold) based on the degree of abnormal deviation.

    • Intelligent Dynamic Threshold: If you select this option, you do not need to manually configure the fluctuation threshold or expected value. The system automatically determines the reasonable threshold based on intelligent algorithms. If abnormal data is detected, an alert is immediately triggered or the related task is immediately blocked. When the Comparison Method parameter is set to Intelligent Dynamic Threshold, you can configure the Degree of importance parameter.

      Note

      Only monitoring rules that you configure based on a custom SQL statement, a custom range, or a dynamic threshold support the intelligent dynamic threshold comparison method.

    Monitoring Threshold

    • If you set the Comparison Method parameter to Manual Settings, you can configure the Normal Threshold and Red Threshold parameters.

      • Normal Threshold: If the data quality check result meets the specified condition, the data output is as expected.

      • Red Threshold: If the data quality check result meets the specified condition, the data output is not as expected.

    • If the rule that you configure is a rule of the Intelligent Dynamic Threshold, you must configure the Orange Threshold.

      • Orange Threshold: If the data quality check result meets the specified condition, the data is abnormal but your business is not affected.

    Retain problem data

    If the monitoring rule is enabled and a data quality check based on the rule fails, the system automatically creates a table to store the problematic data that is identified during the data quality check.

    Important
    • The Retain problem data parameter is available only for MaxCompute tables.

    • The Retain problem data parameter is available only for specific monitoring rules in Data Quality.

    • If you Disable the monitoring rule, problematic data is not stored.

    Status

    Specifies whether to Enable or Disable the rule in the production environment.

    Important

    If you Disable the rule, the rule cannot be triggered to perform a test run or triggered by the associated scheduling nodes.

    Degree of importance

    The strength of the rule in your business.

    • Strong rules are important rules. If you set the parameter to Strong rules and the critical threshold is exceeded, the scheduling node that you associate with the monitor is blocked by default.

    • Weak rules are regular rules. If you set the parameter to Weak rules and the critical threshold is exceeded, the scheduling node that you associate with the monitor is not blocked by default.

    Configuration Source

    The source of the rule configuration. The default value is Data Quality.

    Description

    You can add additional descriptions to the rule.

    Method 2: From a custom template

    Before you use this method, go to Data Quality > Quality Assets > Rule Template Library to create a custom rule template. You can then create a data quality monitoring rule based on that template. For more information, see Create and manage custom rule templates.

    The following figure shows how to create a data quality rule from a custom template.

    Note

    You can also find the required rule template in the custom template list on the left and click +Use to create a rule.

    image

    Parameters for configuring a rule based on a custom rule template

    Only the parameters that are unique to rules based on custom rule templates are described in the following table. For information about other parameters, see the parameters for configuring a rule based on a built-in rule template.

    Parameter

    Description

    FLAG parameter

    The SET statement that you want to execute before the SQL statement in the rule is executed.

    SQL

    The SQL statement that determines the complete check logic. The returned results must be numeric and consist of one row and one column.

    In the custom SQL statement, enclose the partition filter expression in brackets []. Example:

    SELECT count(*) FROM ${tableName} WHERE ds=$[yyyymmdd];
    Note
    • In this statement, the value of the ${tableName} variable is dynamically replaced with the name of the table for which you are configuring monitoring rules.

    • For information about how to configure a partition filter expression, see the Appendix 2: Built-in partition filter expressions section in this topic.

    • If you have created a monitor for the table, the setting of the table partition that you specify in the Data Range parameter during the monitor configuration no longer takes effect for the table after you configure this parameter. The rule determines the table partition to be checked based on the setting of WHERE in the SQL statement.

    Method 3: 
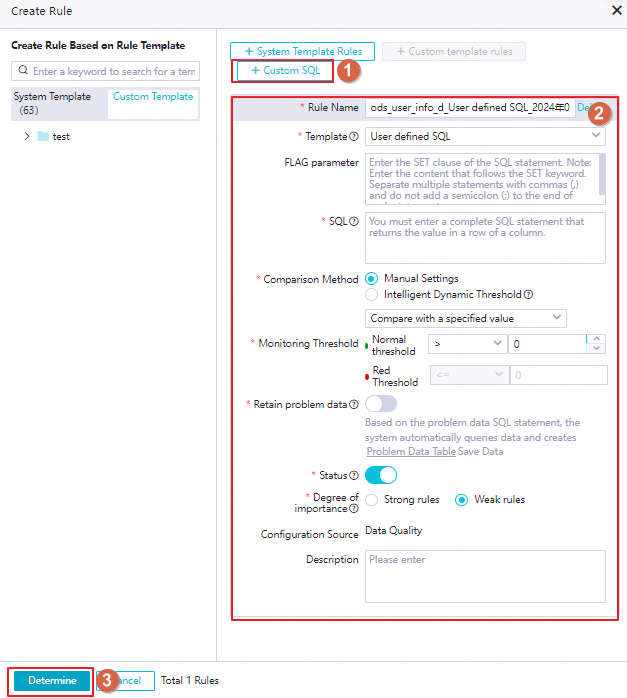
From a custom SQL statement

    This method lets you define custom data quality check logic for a table.

    image

    Parameters for configuring a rule based on a custom SQL statement

    Only the parameters that are unique to rules based on a custom SQL statement are described in the following table. For information about other parameters, see the parameters for configuring a rule based on a built-in rule template.

    Parameter

    Description

    FLAG parameter

    The SET statement that you want to execute before the SQL statement in the rule is executed.

    SQL

    The SQL statement that determines the complete check logic. The returned results must be numeric and consist of one row and one column.

    In the custom SQL statement, enclose the partition filter expression in brackets []. Example:

    SELECT count(*) FROM <table_name> WHERE ds=$[yyyymmdd];
    Note
    • You must replace <table_name> with the name of the table for which you are configuring monitoring rules. The SQL statement determines the table that needs to be monitored.

    • For information about how to configure a partition filter expression, see the Appendix 2: Built-in partition filter expressions section in this topic.

    • If you have created a monitor for the table, the setting of the table partition that you specify in the Data Range parameter during the monitor configuration no longer takes effect for the table after you configure this parameter. The rule determines the table partition to be checked based on the setting of WHERE in the SQL statement.

  • Import existing rules

    If monitoring rules for the target table already exist in the Data Quality module, you can import them to quickly clone the rules. If no rules exist, you must first create them in the Data Quality module. For more information, see Configure rules for a single table.

    Note

    This method supports importing multiple rules in a batch and configuring monitoring rules at the table and field levels.

    Click Import Rule. You can search for and select the rules to import by rule ID or name, rule template, or associated scope (the entire table or specific fields of the table).

    image

Note

After you publish a data quality monitoring node, you can view the details of the quality monitoring rules in the Data Quality module. However, you cannot perform management operations, such as modifying or deleting the rules.

4. Configure compute resources

Select the compute resources required to run the quality rule check. This specifies the data source on which the data quality monitoring task runs. By default, the data source of the monitored table is used.

Note

If you select another data source, confirm that the data source has access permissions to the table.

Step 3: Configure a policy for handling check results

In the Handling Policy section of the node configuration page, you can configure a policy for handling abnormal check results and the method for subscribing to them.

Exception categories

The following table describes the categories of check exceptions.

Exception category

Description

Strong rule - Check failed

  • Strength: Indicates the severity of the rule.

  • Red anomaly: The value of the metric for data quality check hits the critical threshold. In most cases, if the monitored data hits the critical threshold, the quality check result does not meet the expectation, which will severely affect subsequent business operations.

  • Orange exception: The value of the metric for data quality check hits the warning threshold. In most cases, if the monitored data hits the warning threshold, exceptions are identified in the data but subsequent business operations are not affected.

  • Check Failed: The monitor fails to run. For example, the monitored partition is not generated or the SQL statement used to monitor data fails to execute.

Strong rule - Error alert

Strong rule - Warning alert

Soft rule - Check failed

Soft rule - Error alert

Soft rule - Warning alert

Handling policy for exceptions

Configure a policy to handle exceptions found by the rule check as needed:

  • Do not ignore: When a specific exception category is detected, such as an error alert for a strong rule, the current node is stopped and its status is set to failed.

    Note
    • If the current node fails to run, its downstream nodes will not run. This blocks the production pipeline and prevents the spread of problematic data.

    • You can add multiple exception categories for detection.

    • This policy is typically used when an exception has a major impact and blocks the execution of downstream tasks.

  • Ignore: Ignore the exception and continue to run downstream nodes.

Subscription method for exceptions

You can configure how to receive exception notifications, such as by email. When an exception occurs, the platform sends a notification using the specified method so you can find and handle the exception promptly.

Note

The platform supports multiple notification methods. The methods available on the UI may vary. Note the following:

  • For email, email and text message, or phone calls, you can select only users within the current account as recipients. Confirm that the email addresses or phone numbers of the relevant personnel are configured correctly. For more information, see View and set alert contacts.

  • For other methods, enter the webhook URL for receiving the information. For more information about how to obtain a webhook URL, see Obtain a webhook URL.

Step 4: Configure task scheduling

To run the created node task periodically, click Properties in the right-side pane of the node configuration page and configure the scheduling properties for the node task as needed. For more information, see Configure scheduling properties for a node.

Note

You must set the Rerun and Parent Nodes properties for the node before you can submit it.

Step 5: Debug the task

Perform the following debugging operations as needed to check whether the task runs as expected.

  1. (Optional) Select a resource group and assign values to custom parameters.

    • Click the 高级运行 icon in the toolbar. In the Parameters dialog box, select the scheduling resource group to use for debugging.

    • If your task uses scheduling parameters, you can assign values to the variables here for debugging. For more information about the parameter assignment logic, see Task debugging process.

      The following figure shows an example of scheduling parameter configuration.

      image

  2. Save and run the task.

    Click the 保存 icon in the toolbar to save the task. Click the 运行 icon to run the task.

    After the task is complete, you can view the run result at the bottom of the node configuration page. If the run fails, troubleshoot the issue based on the error message.

  3. (Optional) Perform smoke testing.

    If you want to perform smoke testing in the development environment to check whether the scheduling node task runs as expected, you can perform smoke testing when you submit the node or after the node is submitted. For more information, see Perform smoke testing.

Step 6: Submit and publish the task

After the node task is configured, submit and publish it. After the node is published, it will run periodically based on its scheduling configuration.

Note

When you submit and publish the node, the quality rules configured for the node are also submitted and published.

  1. Click the 保存 icon in the toolbar to save the node.

  2. Click the 提交 icon in the toolbar to submit the node task.

    When you submit the task, enter a Change description in the Submit dialog box. If needed, you can also select whether to perform a code review after the node is submitted.

    Note
    • You must set the Rerun and Parent Nodes properties for the node before you can submit it.

    • Code review helps control the quality of task configurations and prevents errors that can occur if incorrect configurations are published online without review. If you perform a code review, the submitted node can be published only after it is approved by a reviewer. For more information, see Code review.

If you are using a workspace in standard mode, after the task is submitted successfully, click Deploy in the upper-right corner of the node configuration page to publish the task to the production environment. For more information, see Publish tasks.

Next steps

  • Task O&M: After the task is submitted and published, it runs periodically based on the node's configuration. You can click Operation Center in the upper-right corner of the node configuration page to go to the Operation Center and view the scheduling and running status of the auto triggered task, including the node status and details of triggered rules. For more information, see Manage auto triggered tasks.

  • Data Quality: After the data quality monitoring rules are published, you can also go to the Data Quality module to view rule details. However, you cannot perform management operations, such as modifying or deleting the rules. For more information, see Data Quality.