This topic describes the solutions that you can use to resolve the latency issues on a real-time synchronization node.
Check whether the latency is caused by the source or destination
If the real-time synchronization node is created in DataStudio, you must view the running details of the node in Operation Center. To view the running details, perform the following operations: Go to the Operation Center page and choose in the left-side navigation pane. On the Real Time DI page, find the name of the real-time synchronization node and click the node name. On the Details tab of the panel that appears, you can view the running details of the real-time synchronization node. For more information, see Manage real-time synchronization tasks.
On the Details tab, view the values of the waitTimeWindow (5 min) metric in the Reader Statistics and Writer Statistics sections. The value of the waitTimeWindow (5 min) metric indicates the period of time that the real-time synchronization node waited during the last 5 minutes before the node can read data from the source or write data to the destination. The waitTimeWindow (5 min) metric can help you check whether the bottleneck that causes latency of data synchronization exists at the source or destination side. The bottleneck exists at the side for which the waitTimeWindow (5 min) metric has a larger value.
Check whether exceptions occur on the system that causes the latency
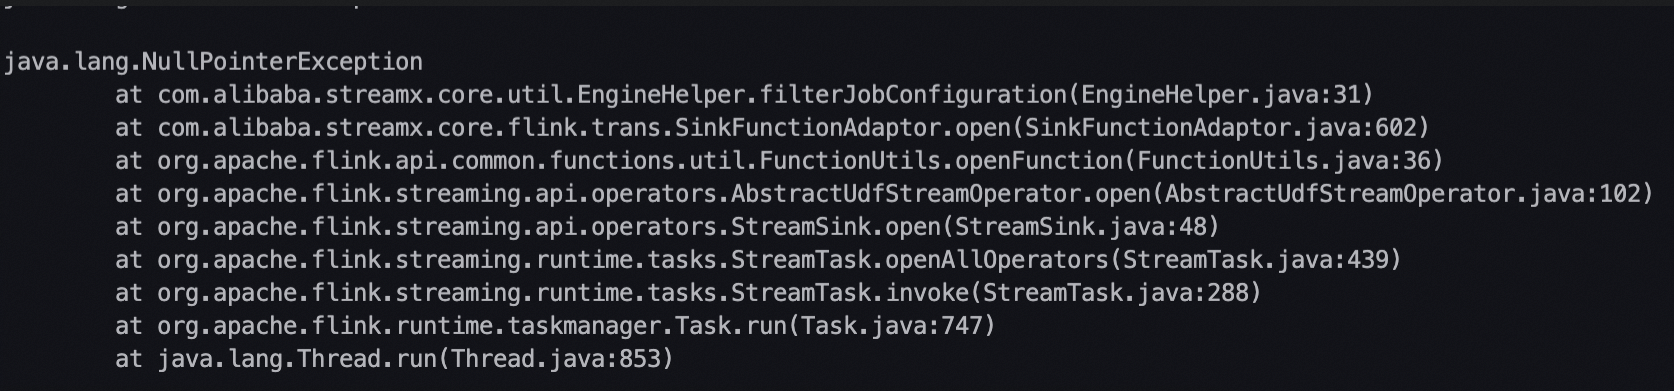
After you determine the side at which the bottleneck exists, you can click the Log tab of the same panel, and search for exception information by keyword such as Error, error, Exception, exception, or OutOfMemory on the tab to check whether exception information that is similar to the information shown in the following figure exists during the latency period. If such an exception exists, you can refer to FAQ about real-time synchronization to determine whether you can resolve the issue by optimizing the configurations of the real-time synchronization node.
A real-time synchronization node reads data from the source system and writes data to the destination system. If the time required to write data is longer than the time required to read data, the destination system imposes backpressure on the source system. As a result, data read slows down. This indicates that the system in which the bottleneck exists may impose backpressure on another system and cause exceptions to occur on the system. In this case, you must pay special attention to the system in which the bottleneck exists.
Check whether out of memory (OOM) errors are frequently reported for the real-time synchronization node
You can click the Failover tab of the same panel to check whether frequent failovers occur on the real-time synchronization node. More than one failover within 10 minutes indicates frequent failovers. If frequent failovers occur on the real-time synchronization node, you can move the pointer over a failover event in the Failover Events column to view the detailed information of the exception that causes the failover. You can also click View Details in the Actions column of a failover record to view the complete logs that are generated for the real-time synchronization node before the failover. You can search for the error message that contains the OutOfMemory keyword in the detailed exception information or in the complete logs. If the failover is caused by insufficient memory configured for the real-time synchronization node, the error message exists in the detailed exception information or in the complete logs. In this case, you must increase the memory size for the real-time synchronization node. 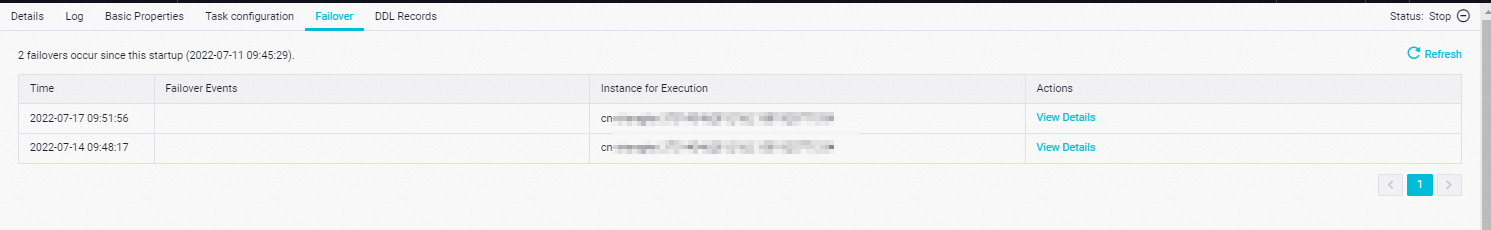
You can use one of the following methods to configure the memory size for a real-time synchronization node:
If the real-time synchronization node is created on the DataStudio page and used to synchronize data from a single table to another single table, you can go to the configuration tab of the node, click Basic Configuration in the right-side navigation pane, and then configure the memory size for the node on the Basic Configuration tab.
If the real-time synchronization node is created on the DataStudio page and used to synchronize data from a database to a data source such as a DataHub data source, you can go to the configuration tab of the node, click Basic Configuration in the right-side navigation pane, and then configure the memory size for the node on the Basic Configuration tab.
If the real-time synchronization node is generated by a data synchronization solution, you can configure the memory size for the node in the Configure Resources step on the configuration page of the solution.
Check whether data skews occur on the source or whether you need to increase the number of partitions or shards for the source
If the source of the real-time synchronization node is a Kafka, DataHub, or LogHub data source and the latency is not caused by the preceding reasons, you need to check whether data skews occur on the source or whether the transmission rate at which data is read from partitions or shards in the source reaches the maximum transmission rate allowed by the source.
For a real-time synchronization node that is used to synchronize data from a Kafka, DataHub, or LogHub data source, only a single thread can be used to consume data in each partition or shard. If most of the data that is written to the source is stored in a few partitions or shards and only a small amount of data is stored in the remaining partitions or shards, data skews may occur on the source or bottlenecks may occur when data in the partitions or shards that store most of the data is consumed. As a result, latency occurs on the real-time synchronization node. In this case, you cannot resolve the issue by adjusting the configurations of the real-time synchronization node. You must resolve the data skew issue in the upstream system of the Kafka, DataHub, or LogHub data source. After the data skew issue is resolved, the latency issue can be resolved.
You can find the real-time synchronization node on the Real Time DI page in Operation Center and go to the Details tab of the node to view the value of the Total Bytes metric in the Reader Statistics section. You can perform the same steps to go to the Details tab of other real-time synchronization nodes that are normally running and view the value of the Total Bytes metric in the Reader Statistics section. Then, you can compare the obtained metric values. If the value of the metric for the real-time synchronization node is larger than that for other real-time synchronization nodes, data skews occur on the source of the real-time synchronization node. The total number of bytes displayed on the Details tab includes the number of bytes of the data that is synchronized from the previous offset. If the real-time synchronization node has been run for a long period of time, the displayed total number of bytes may not reflect the current data skew situation. In this case, you must check the metrics in the source system to determine whether data skews occur on the source.
If the transmission rate at which data is transferred from an upstream system to the source or the transmission rate at which data is read from a single partition or shard in the source reaches the maximum transmission rate allowed by the source, you can increase the number of partitions or shards in the source to resolve the latency issue. Kafka allows you to configure the maximum transmission rate at which data can be read from a single partition in a Kafka cluster. DataHub limits the maximum transmission rate at which data can be read from a single partition in a DataHub topic to 4 MB/s. LogHub limits the maximum transmission rate at which data can be read from a single shard in a LogHub Logstore to 10 MB/s.
If multiple real-time synchronization nodes consume data in the same Kafka topic, DataHub topic, or LogHub Logstore, you must check whether the sum of the transmission rates at which the nodes read data exceeds the maximum transmission rate allowed by the related data source.
Check whether large transactions are submitted at the source or data in the source is frequently changed by a large number of DDL or DML operations if the source type is MySQL
If the source of the real-time synchronization node is a MySQL data source and the latency is not caused by the preceding reasons, you must check whether large transactions are submitted at the source or whether data in the source is frequently changed by a large number of DDL or DML operations. If large transactions are submitted at the source or data in the source is frequently changed by a large number of DDL or DML operations, binary logs for the MySQL data source quickly increase, and the increase speed may exceed the speed at which the real-time synchronization node consumes data in the MySQL data source. As a result, latency may occur on the real-time synchronization node.
For example, if you change the values of a field in a source MySQL table or delete a large amount of data from the MySQL table, binary logs for the MySQL data source quickly increase. You can find the real-time synchronization node on the Real Time DI page in Operation Center and go to the Details tab of the node to view the data synchronization speed of the node.
A high data synchronization speed indicates a high increase speed of binary logs.
If the data synchronization speed that is displayed on the Details tab is not excessively high, you can view audit logs and the values of metrics related to binary logs on the MySQL server to obtain the actual increase speed of binary logs.
The data synchronization speed that is displayed on the Details tab may not accurately reflect the actual speed at which the real-time synchronization node consumes binary logs. If the databases or tables that are involved in transactions or changes are not specified in the real-time synchronization node, the node filters out the data that is read from the databases and tables after the data is read. As a result, the speed at which data is read from these databases or tables is not counted in the overall data synchronization speed of the node, and the related data is not counted in the total amount of data that is read by the node.
If you confirm that the latency is caused by large transactions or a large number of temporary data changes, you can wait until data involved in the large transactions or the temporary data changes is processed by the real-time synchronization node. After the data is processed, the latency is gradually reduced.
Check whether flush operations are frequently performed on the real-time synchronization node due to the configuration of dynamic partitioning by field value for the destination
If the destination of the real-time synchronization node is a MaxCompute data source and you set the partitioning method to dynamic partitioning by field value when you configure the destination, you must select the source columns that can be mapped to the partition key columns of the destination MaxCompute table. In addition, you must make sure that the number of enumeration values within the flush interval specified on the Basic Configuration tab of the real-time synchronization node is not excessively large. The default flush interval is 1 minute.
Data that falls in the specified flush interval and is waiting to be written to the MaxCompute table is stored in a group of queues of the real-time synchronization node. Each queue caches a data record that needs to be written to the MaxCompute table. The default maximum number of queues is 5. If the number of enumeration values within the specified flush interval of the selected source columns that correspond to the partition key columns of the MaxCompute table exceeds the maximum number of queues, flush operations are triggered for all data to be written. Frequent flush operations significantly affect the data write performance.
You must check whether the exhaustion of queues used to store the data to be written to the MaxCompute table triggers frequent flush operations. You can find the real-time synchronization node on the Real Time DI page in Operation Center, go to the Log tab of the node, and search for uploader map size has reached uploaderMapMaximumSize in the logs of the node. If the logs contain the information, go to the configuration panel of the destination and increase the size of the partition cache queue.
Increase the number of parallel threads or enable the distributed execution mode for the real-time synchronization node
If you determine that the latency is caused by a business traffic increase after you perform the preceding checks, you can increase the number of parallel threads for the real-time synchronization node to reduce the latency.
After you increase the number of parallel threads for the real-time synchronization node, you must also increase the memory size for the node. You can increase the number of parallel threads and the memory size for the real-time synchronization node based on the ratio of 4:1.
You can use one of the following methods to configure the number of parallel threads and the memory size for a real-time synchronization node:
If the real-time synchronization node is created on the DataStudio page and used to synchronize data from a single table to another single table, you can go to the configuration tab of the node, click Basic Configuration in the right-side navigation pane, and then configure the number of parallel threads and the memory size for the node on the Basic Configuration tab.
If the real-time synchronization node is created on the DataStudio page and used to synchronize data from a database to a data source such as a DataHub data source, you can configure the number of parallel threads for the node in the Configure Resources step of the node configuration tab and configure the memory size for the node on the Basic Configuration tab of the node.
If the real-time synchronization node is generated by a data synchronization solution, you can configure the number of parallel threads and the memory size for the real-time synchronization node in the Configure Resources step on the configuration page of solution.
If the distributed execution mode is not enabled for a real-time synchronization node, we recommend that you configure no more than 32 parallel threads for the node. If you configure more than 20 parallel threads for the real-time synchronization node, latency may occur on the node due to the insufficient resources of a single machine. The following table lists the types of nodes for which the distributed execution mode can be enabled, and the source and destination types that support the mode.
Node type | Source type | Destination type |
DataStudio ETL node | Kafka | MaxCompute |
DataStudio ETL node | Kafka | Hologres |