The flying line layer is a sub-component of the basic flat map. It supports independent styles and data configurations. It can represent the OD data between two points on a geographic location in the form of flying lines. It can be used to display related information between two places, such as logistics and transactions. This topic describes the meaning of each configuration items in the flight layer.
Click Flying Routes Layer under Components. The Settings tab of Flying Routes Layer appears.
Note If Components does not contain Flying Routes Layer, add the Flying Routes Layer component. For more information, see Map Container.
Settings
- Search for Configurations: In the right-side panel of Canvas Editor, click the Settings tab, and click Search for Configurations in the upper-right corner. Enter the required configuration item in the search box, and click the search icon to quickly locate the configuration item. Fuzzy match is supported. For more information, see Search for widget configuration items.
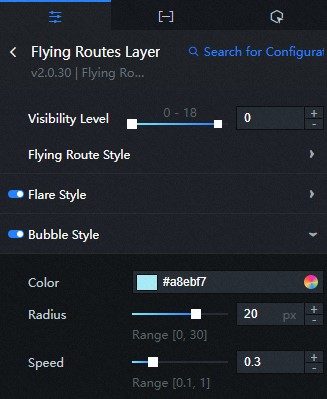
- Visibility Level: specifies the visibility level of the flying line layer. When the map is scaled to the specified visibility level, the flying line layer is visible.
- Flying Routes Style: Set the start color, end color, gradient, and length of the flying line.
Parameter Description Origin Color For more information about the start color of the flying line, see the color picker description. Destination Color The color of the end of the flight. Gradient Ratio The color interpolation of the beginning and end gradient of a flying line. Valid values: 1 to 10. Route Length The flight length of the flight line. Valid values: 10 to 120. Route Width The thickness of the flight line. Valid values: 0 to 20. Path Points The number of component points of the flying route. Valid values: 100 to 400. Height Ratio The height ratio of the flying line. Valid values: 0.5 to 5. Flying Frequency The frequency of flying out. Unit: number of pieces /frame. Flight Speed The flight rate of the flight. Valid values: 1 to 10. - Flare Style: Specify the color and size of the flare. Click the
 icon to the left of the flare style to control the visibility of the Flare Style.
Parameter Description Color The flare color of the flying line. Size The size of the flare. Valid values: 0 to 20. - Bubble Style: Set the color, radius, and rate parameters. Click the icon on the left of Bubble Style to control the Bubble Style.
Parameter Description Color The color of the flying bubbles. Radius The radius of the flying bubble. Valid values: 0 to 30. Speed The rate of flying bubbles. Valid values: 0.1 to 1.
Data
Sample code in the preceding figure:
[
  {
    "from": "116.85059,31.69078",
    "to": "118.69629,36.20882"
  },
  {
    "from": "120.89355,37.09024",
    "to": "116.93848,31.61597"
  },
  {
    "from": "121.28906,29.34388",
    "to": "117.20215,31.12820"
  },
  {
    "from": "118.16895,31.57854",
    "to": "119.79492,32.47270"
  },
  {
    "from": "116.76270,33.35806",
    "to": "116.49902,38.95941"
  },
  {
    "from": "116.41113,30.93992",
    "to": "114.78516,26.58853"
  },
  {
    "from": "115.83984,32.13841",
    "to": "97.47070,37.54458"
  },
  {
    "from": "116.27930,32.36140",
    "to": "114.08203,36.27971"
  },
  {
    "from": "103.66699,25.79989",
    "to": "116.05957,31.54109"
  },
  {
    "from": "112.14844,24.40714",
    "to": "116.71875,33.21112"
  },
  {
    "from": "116.93848,31.65338",
    "to": "118.34473,26.62782"
  },
  {
    "from": "90.70313,42.26105",
    "to": "116.23535,32.32428"
  },
  {
    "from": "116.41113,30.82678",
    "to": "114.87305,36.94989"
  },
  {
    "from": "116.45508,30.78904",
    "to": "118.91602,28.57487"
  },
  {
    "from": "116.01562,40.07807",
    "to": "116.71875,31.69078"
  },
  {
    "from": "116.71875,31.72817",
    "to": "108.45703,40.24599"
  },
  {
    "from": "117.99316,40.84706",
    "to": "116.85059,31.69078"
  },
  {
    "from": "118.30078,36.56260",
    "to": "117.24609,40.97990"
  },
  {
    "from": "119.35547,26.86328",
    "to": "120.41016,32.28713"
  },
  {
    "from": "113.07129,31.42866",
    "to": "106.04004,31.31610"
  },
  {
    "from": "116.85059,31.31610",
    "to": "110.43457,32.76880"
  }
]| Log field | Description |
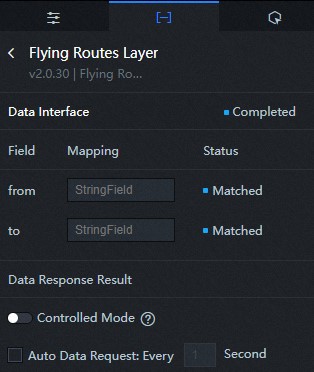
|---|---|
| from | The longitude and latitude of the starting point of the flight. Separate the longitude and latitude with commas (,). |
| to | The longitude and latitude of the end position of the flying line. Separate the longitude and latitude with commas (,). |
| Parameter | Description |
|---|---|
| Controlled Mode | If you turn on the switch, data is not requested when a widget is initialized. Data requests are triggered only based on callback IDs or the method configured in Blueprint Editor. If you turn off the switch, data requests are automatically triggered. By default, the switch is turned off. |
| Auto Data Request | After you select the Auto Data Request check box, you can enable dynamic polling, and manually specify the polling interval. If you do not select this check box, data is not automatically requested. You must manually refresh the page to request data or use Blueprint Editor or callback ID events to trigger data requests. |
| Data Source | In the right-side panel of Canvas Editor, click the Data tab. Click Set next to Static Data. In the Configure Datasource panel, select a data source from the Data Source Type drop-down list. Enter code for data query in the code editor, click Preview Data Response to preview the response of the data source, and then view the response. For more information, see Configure widget data. |
| Data Filter | If you select the Data Filter check box, you can convert the data structure, filter data, and perform simple calculations. If you click the plus sign (+) next to Add Filter, you can configure the script for the data filter in the editor that appears. For more information, see Use the data filter. |
| Data Response Result | The response to a data request. If the data source changes, you can click the |
Interaction
This widget does not support interaction events.
Configure interactions in Blueprint Editor
- On the Canvas Editor page, click the
 icon on the right of Flying Routes Layer in the Basic Plat Map Subcomponent Management List.
- Click the
 icon in the upper-left corner of the page.
- In the blueprint editor, click Flying Routes Layer in the Added Nodes pane. You can configure parameters of the flying routes layer
on the canvas.
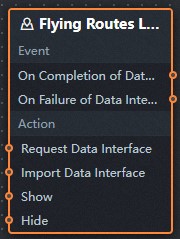
- Event
Event Description On Completion of Data Interface Request The event is triggered with the processed JSON data after a data interface request is responded and processed by a filter. For more information about specific data examples, see the Data Response Result section on the Data tab of the canvas editor. On Failure of Data Interface Request When a data interface request fails (the request may be caused by network problems or interface errors, etc.), the event is returned and processed by the filter, and the processed JSON-formatted data is also thrown. For more information about specific data examples, see the Data Response Result section on the Data tab of the canvas editor. - Action
Action Description Request Data Interface This action is performed to request the server data again. The data sent by an upstream data processing node or layer node is used as a parameter. For example, if the API data source is configured as http://api.testat the flight line layer and the data passed to the Request Data Interface action is{ id: '1'}, the final request interface ishttp://api.test?id=1.Import Data Interface After data of a widget is processed in accordance with its drawing format, the widget is imported for redrawing. You do not need to request server data again. For more information about specific data examples, see the Data Response Result section on the Data tab of the canvas editor. Show A widget is shown without the need to specify parameters. Hide A widget is hidden without the need to specify parameters.
- Event